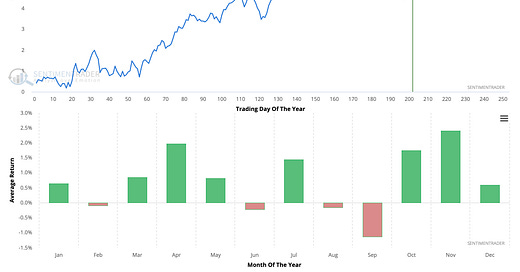
This week we’ll review Market Conditions and Seasonality. In the Premium Section we’ll go over the connection between the 60-Year Cycle and the Professor Weston Cycle and how that may be the most important dynamic right now.
Note: We’ve now released our Q4 2024 Cycle Forecasts for sale to everybody. You can read more about these Forecasts here. Access all different asset Forecasts at www.cyclesedge.com. Our Founding Members have already been emailed the entire set. If you’re a Founding Member and haven’t received the Q4 2024 Cycle Forecasts, please reach out to us via Substack or the Founding Member Discord Server (preferable).
Market Conditions: No News…Take a Break
Last week had little economic news, so there was not much to move the markets. Earnings did take center stage as disappointing forward guidance from ASML (semiconductor company) sent the chip industry and the greater market on a dip on Tuesday 10/15. However positive earnings reports for Taiwan Semiconductor on Thursday and Netflix on Friday reversed the damage and the S&P 500 (SPY) ended the week up 0.86%. Meanwhile Goldman Sachs beat earnings and revenue estimates, keeping the financial sector strong.
SPY reached the R1 Pivot Point as we mentioned here. Despite last week’s volatility, it remains in an uptrend above the 9 & 21 EMAs. It’s important to note that following the 21 EMA on the daily chart often leads to multi-week or multi-month trends. If SPY cannot move above the R1 Pivot Point around $586, which aligns with the Upper Bollinger Band (grey), a pullback to test the 9 EMA at $580 or the 21 EMA at $574 is possible—and even healthy. This aligns with our expectations based on Seasonality analysis, which we’ll discuss later. Here are other key factors we observe on the chart below:
Net New Highs: The market for individual stocks is healthy as there are ample Net New Highs.
McClellan Oscillator: This is above 0 and pointing up, representing broadening breadth.
VIX Curve (VXV/VIX): The VIX Curve hit the 1.0 mark and is rising from there. A move back up to 1.2 would translate to another leg higher in the stock market, perhaps to the R2 Pivot Point at $598.
Equity Put/Call Ratio (CPCE): The CPCE tells us the market is still loaded with call options. A fast move higher (a rush to buy puts) could tank the market, but there is no evidence of that happening now. For now we assume market makers hedged their portfolios bullishly and are along for the ride higher.
The Advance/Decline Line (NYAD) set to Bollinger Bands is proving to be the most reliable breadth measure. Notice how the NYAD reverted to the Bollinger Band midpoint (20 SMA or dotted green line) during the early August and September drops. It then indicated a buy-the-dip scenario both times as it bounced above the midpoint. Last week it did it once again. The RSI is overbought, but the MACD appears to be making a bullish crossover. Next week this indicator will be essential to see if we continue higher or start a dip.
Smart Money continues to sell at highs, while Dumb Money buys-the-dip. So far Dumb Money has been right…
…and this should continue as long as the market doesn’t get spooked. The Fear & Greed model is in a “Greed Grind”, where a prolonged stay in the Greed area continues as the market trends higher. Earlier this year the Greed Grind lasted 3.5 months and we are only 1 month in at the moment.
Next week is another week with little economic news, where Initial Jobless Claims on Thursday may be the most important data drop.
Tesla (TSLA), IBM, and ServiceNow (NOW) all report earnings on Wednesday, 10/23, after the market close. Tesla's earnings are expected to be the week's key highlight, while IBM could offer insights into the AI industry, and ServiceNow may provide a gauge of software spending trends.
Let’s see what Seasonality has to say about the market going into year end.
Seasonality: A Dip to Buy
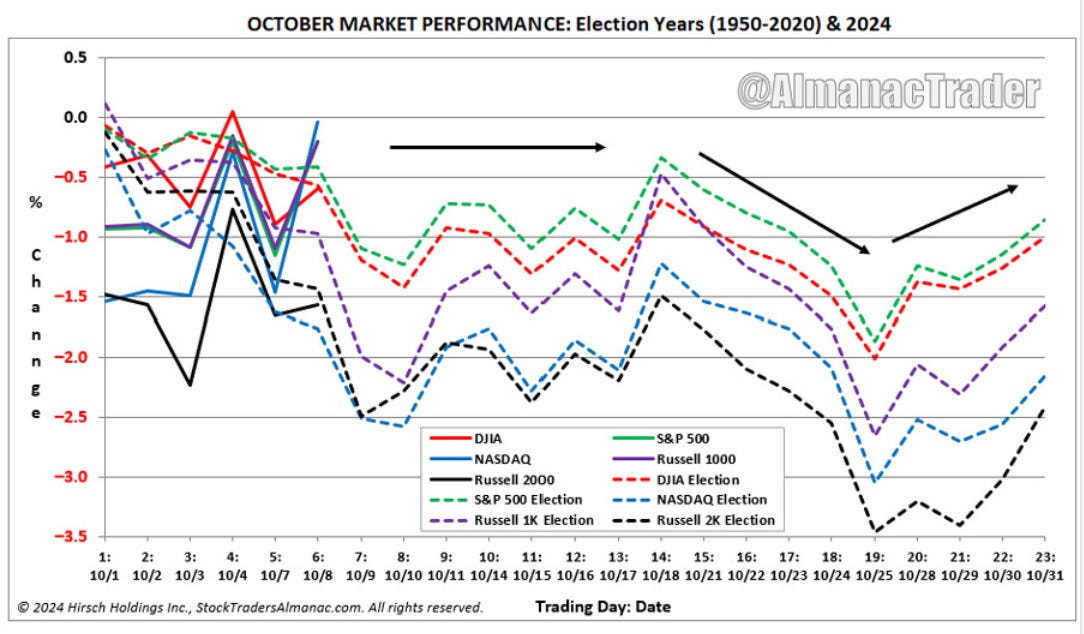
The October Seasonality chart below (courtesy of Stock Traders Almanac) suggests a dip across all indexes starting Monday, 10/21, and lasting through Friday, 10/25. A higher low may even occur on Tuesday, 10/29.
This dip is likely buyable based on SPY seasonality, as early November is typically bullish. By October 31, mutual funds must sell stocks to prepare for year-end tax distributions, potentially increasing selling pressure on overvalued or underperforming stocks. This could lead to a short-term dip before the usual November rally (we will expand on this in our Cycles discussion in the Premium Section).
In the next section, we’ll review seasonality for the Nasdaq 100 (QQQ), Russell 2000 (IWM), and Dow Jones Industrial Average (DIA) to determine which index is likely to outperform. We’ll also cover something truly mind-blowing in the Premium Section, as we dive into the 60-Year Cycle and the Weston Cycle.
Disclaimer - All materials, information, and ideas from Cycles Edge are for educational purposes only and should not be considered Financial Advice. This blog may document actions done by the owners/writers of this blog, thus it should be assumed that positions are likely taken. If this is an issue, please discontinue reading. Cycles Edge takes no responsibility for possible losses, as markets can be volatile and unpredictable, leading to constantly changing opinions or forecasts.


