Note: We’ve now released our Q4 2024 Cycle Forecasts for sale to everybody. You can read more about these Forecasts here. Access all different asset Forecasts at www.cyclesedge.com. Our Founding Members have already been emailed the entire set. If you’re a Founding Member and haven’t received the Q4 2024 Cycle Forecasts, please reach out to us via Substack or the Founding Member Discord Server (preferable).
In this article, we’ll cover:
1) Outlook on Gold and Silver
2) Gold vs Silver, who has an advantage?
3) Our proprietary Cycle Forecasts for Gold and Silver
4) Update on Gold Miners ($GDX) and Silver Miners ($SIL and $SILJ)
5) An attractive Money Making opportunity in Palladium and how to play it
Let’s dive in!
Gold Pullback
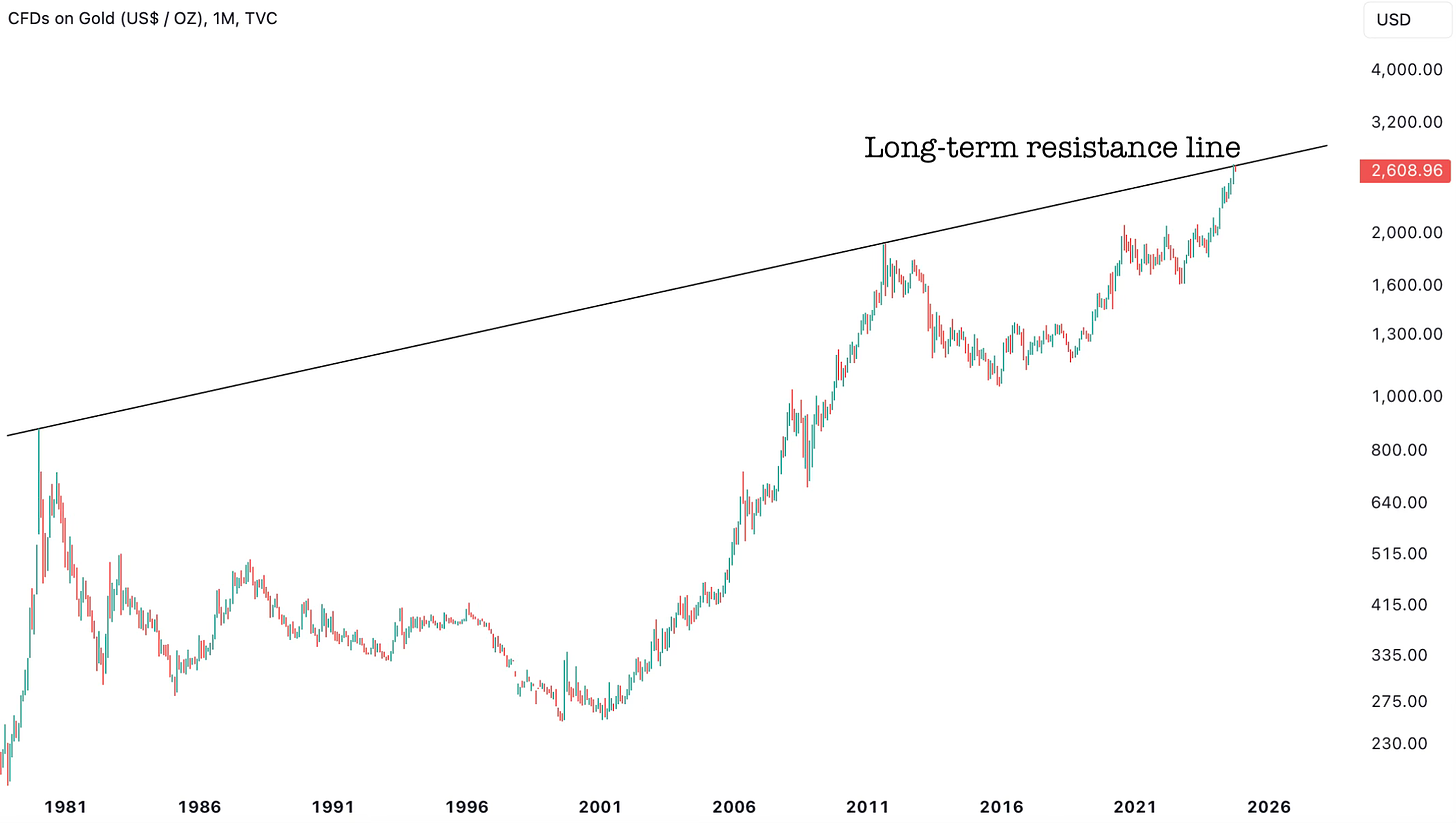
Gold has recently hit its long-term resistance line that dates back to the 1980. This is a logical area for a pullback, something we have highlighted in the last Gold update (found here).
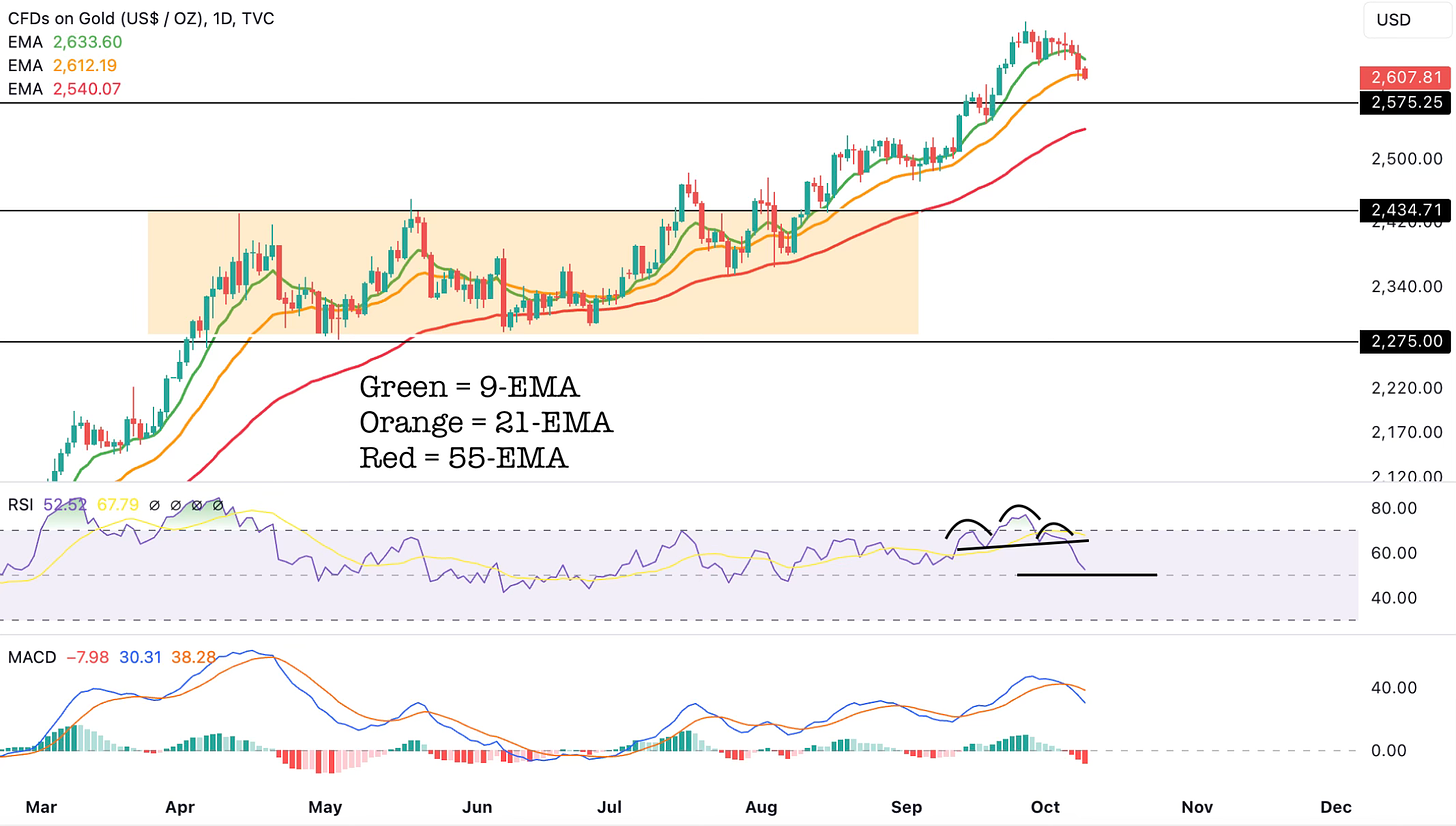
Gold looks to be rolling over and is on the verge of closing below its daily 21-EMA (currently at $26.12). If price confirms a close below it, then our pullback targets are at $2575 to $2580 region first and a break below that could see price tag the daily 55-EMA (currently at $2540).
If/when price comes down to our pullback targets, then we’ll re-assess if it makes sense to add to Gold at those levels or if a deeper pullback is likely.
Interestingly, this pullback is happening just as the daily RSI formed and broke below a head and shoulders pattern (yes, you can run basic technicals on some indicators that are derivates of price, like the RSI). The target for the daily RSI’s head and shoulders target is 50.
The ongoing short-term Gold pullback is healthy for the mid-term and long-term, which we’re still bullish on. We’ll re-consider our short-term pullback view is Gold is able to reclaim its daily 9-EMA (currently at $2633).
Gold’s Overextension
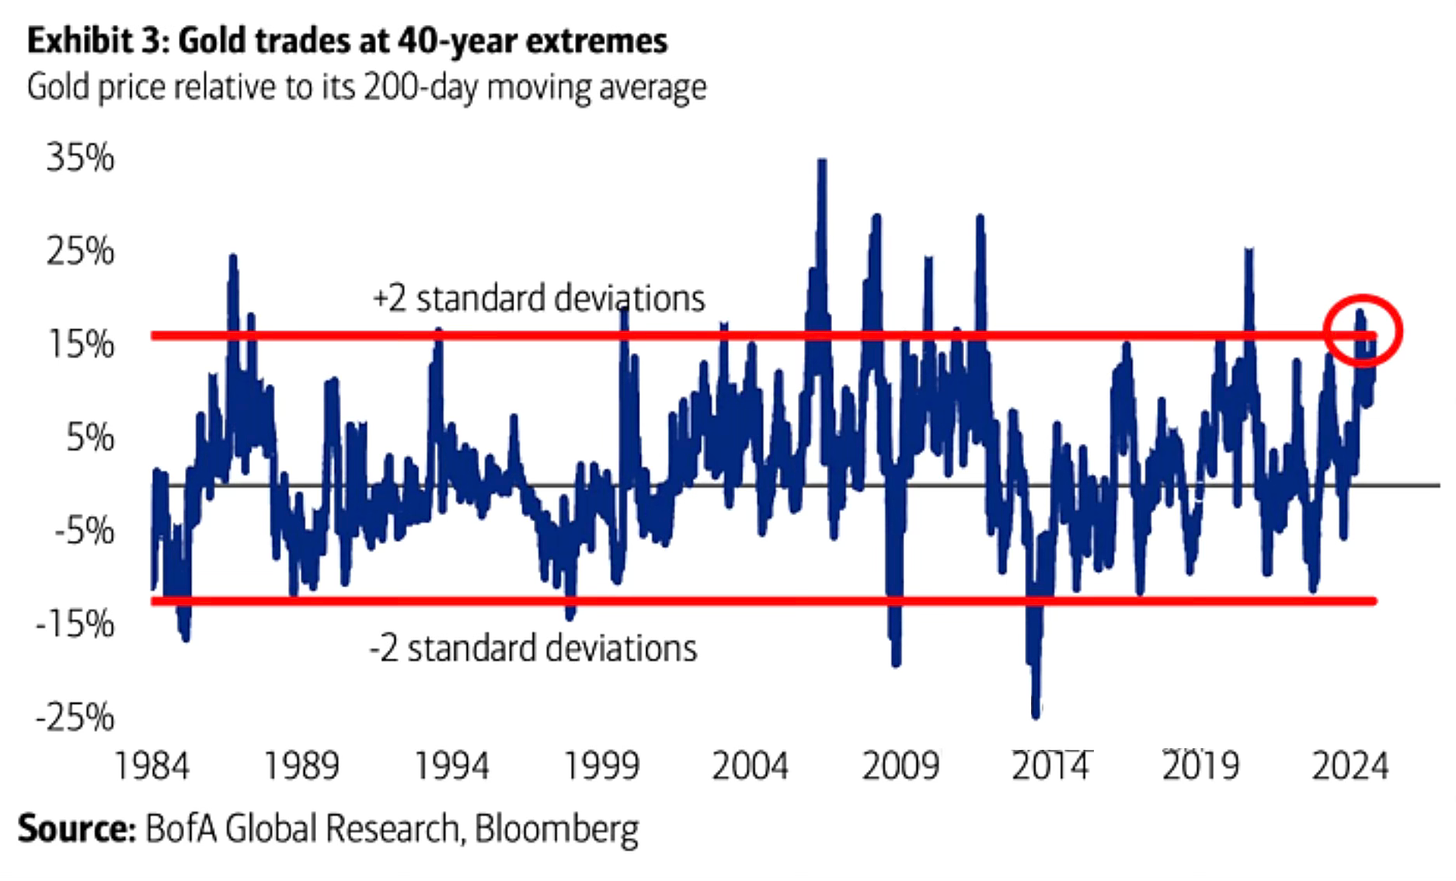
Technically, Gold has reached quite an over-extended level. Gold price is around 15% above its 200-day MA, which is 2 standard deviations based on historical data.
This is the widest gap since 2020 and a pullback would make perfect sense.
Gold Demand From Chinese Retail
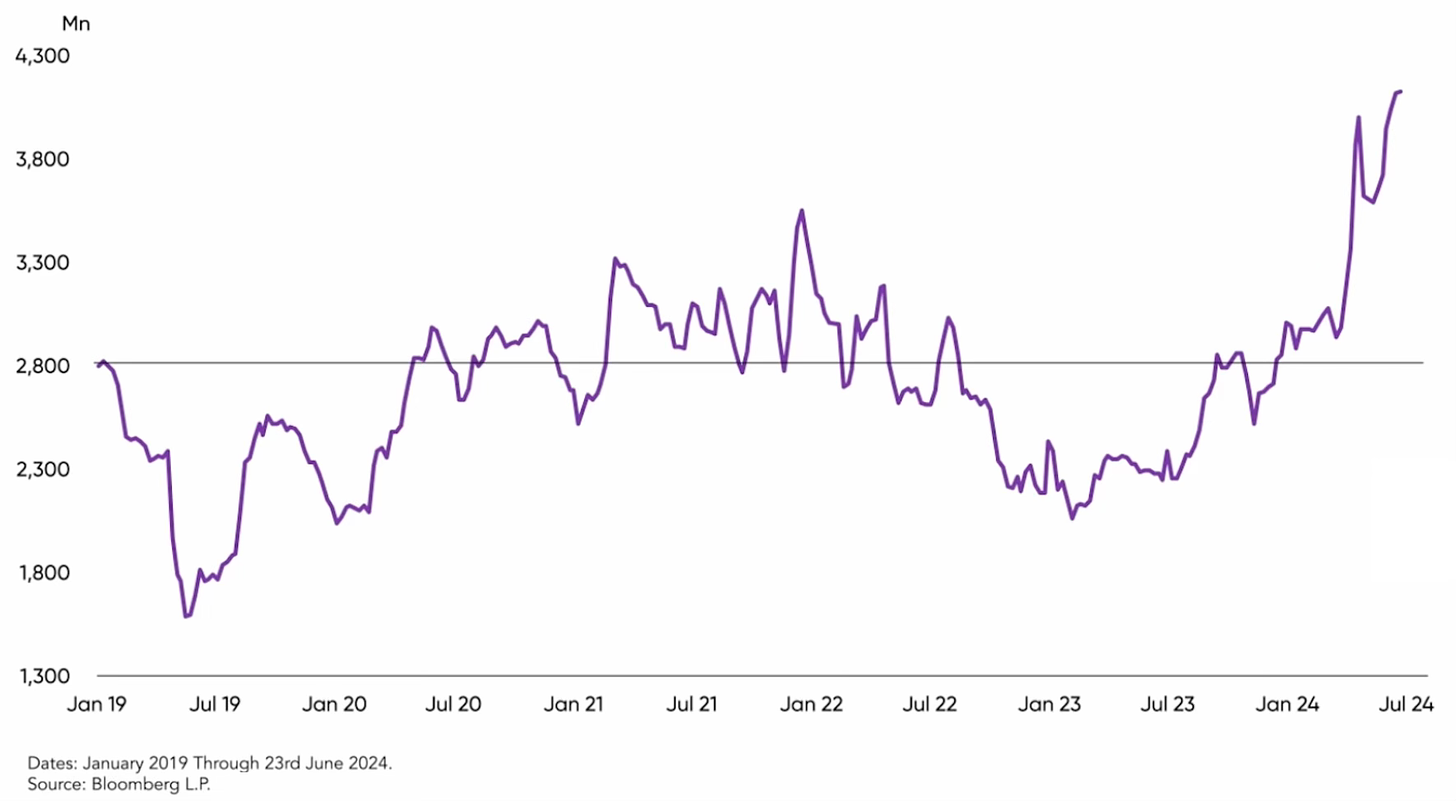
Another headwind for Gold in the near-term could be China’s retail demand. Alongside Central Banks that have been loading up on Gold, even Chinese retail demand had shot up to the highest levels seen since 2019.
However, now with the Chinese Central Bank’s monetary pivot and stimulus + beaten valuations, Chinese stocks are now an attractive alternative for Chinese retail. This could see a falloff in Gold demand at least from China’s retail.
Silver/Gold Ratio
So, now it’s time to decide on whether Gold is more attractive or Silver.
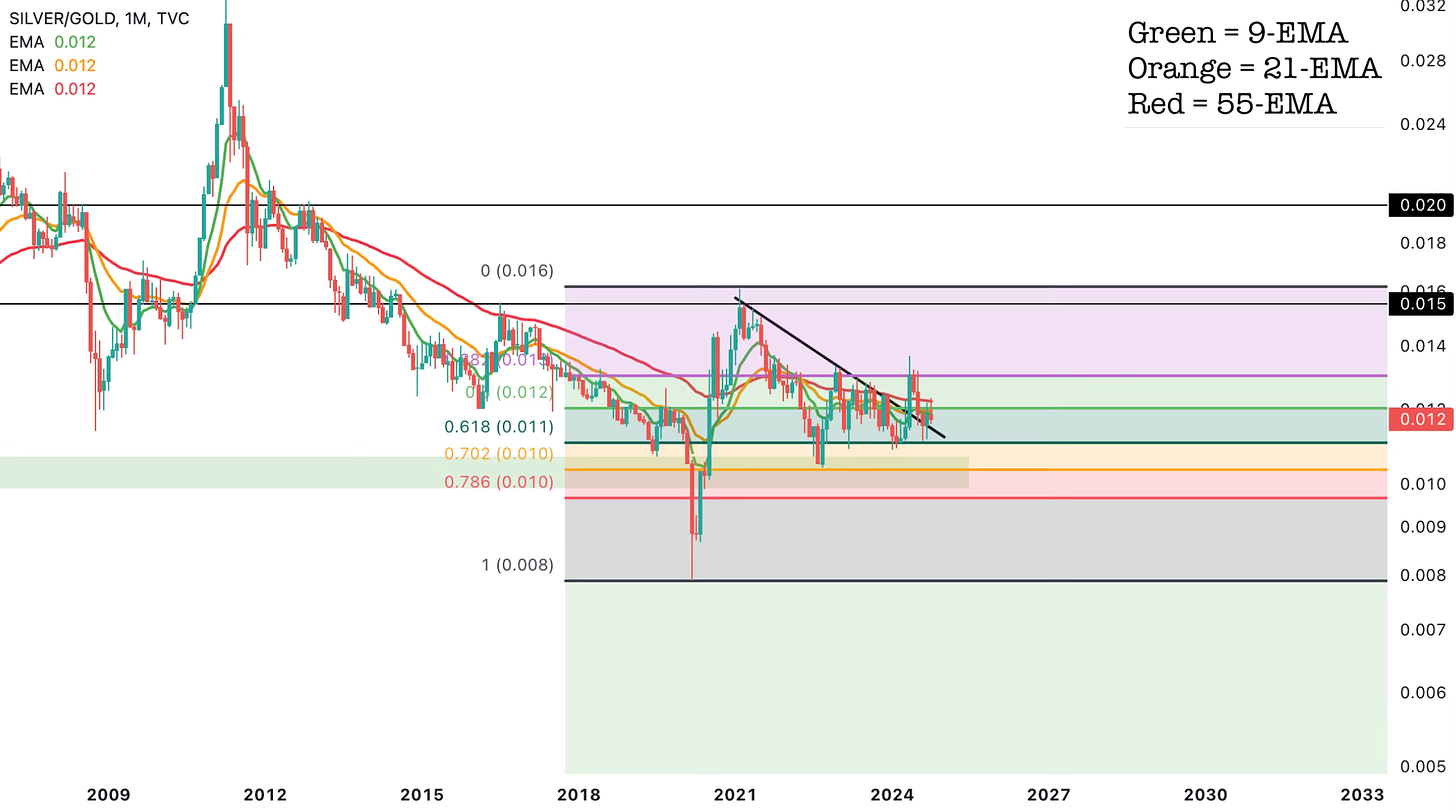
Looking at the monthly chart of the Silver/Gold ratio, it’s clear that:
1) Silver/Gold ratio has broken above its downward sloping resistance
2) It has retested and still continues to hold above this downward sloping resistance
3) The ratio is just above the 0.618 Fibonacci retracement of the low and high points from 2020 and 2021 respectively
This type of a monthly setup typically leads to more upside, which would mean that Silver outperforms Gold in the coming months.
But remember, this is a monthly chart, so there could be volatility on the smaller timeframes, but the bigger picture still supports Silver to outperform.
Influence Of US Dollar (DXY) – Intermarket Analysis
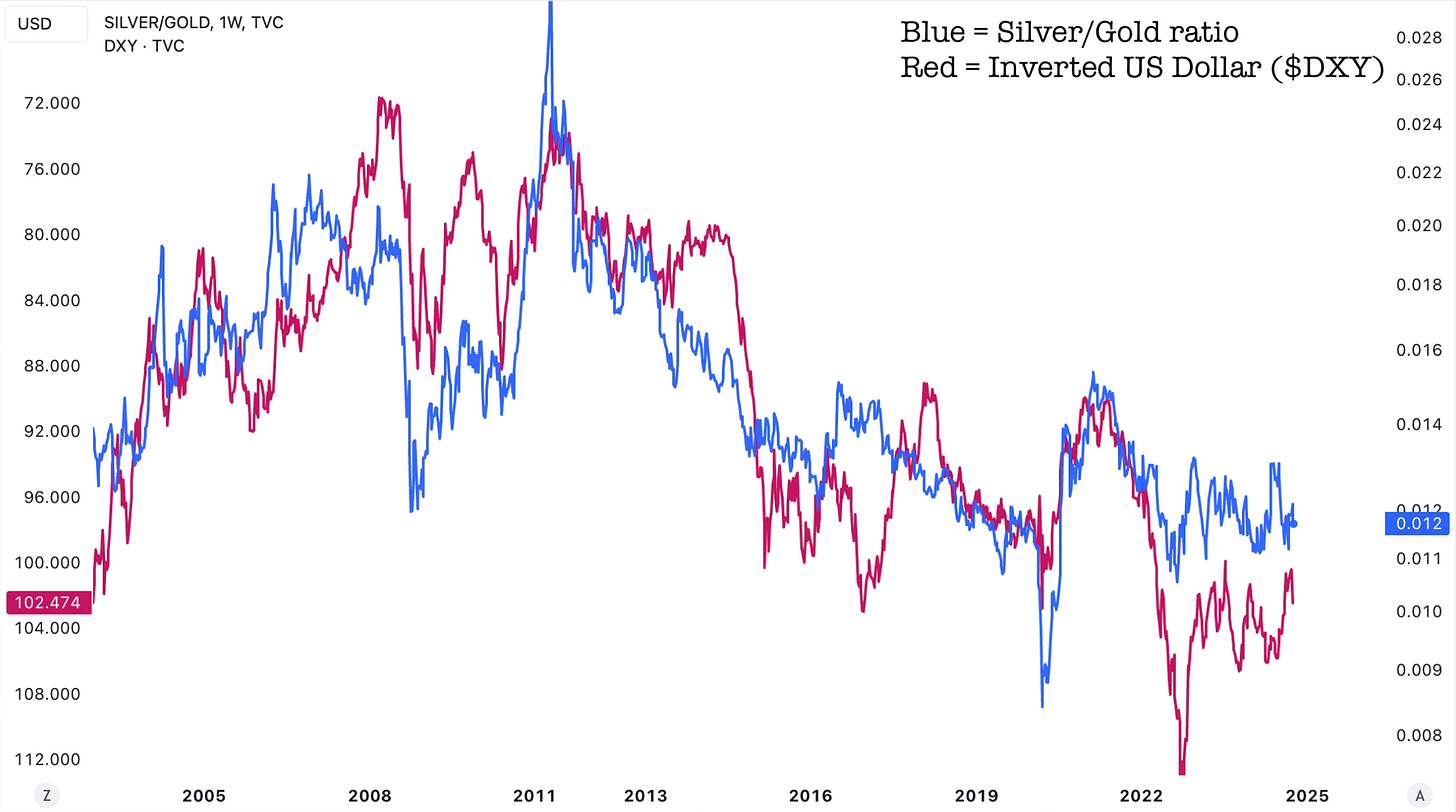
Even from an intermarket standpoint, Silver is likely to outperform Gold.
Here’s what the chart below shows:
The blue line is the Silver/Gold ratio
The red line is the US Dollar index (DXY), but it is inverted
There’s quite a strong positive correlation between Silver/Gold ratio and inverted DXY.
In other words, when the DXY strengths, Gold tends to outperform Silver, and when DXY weakens, Silver tends to outperform Gold.
We’re of the opinion that the US Dollar (DXY) is going to weaken in the coming months (especially if yields fall), which should be a tailwind for Silver to outperform Gold.
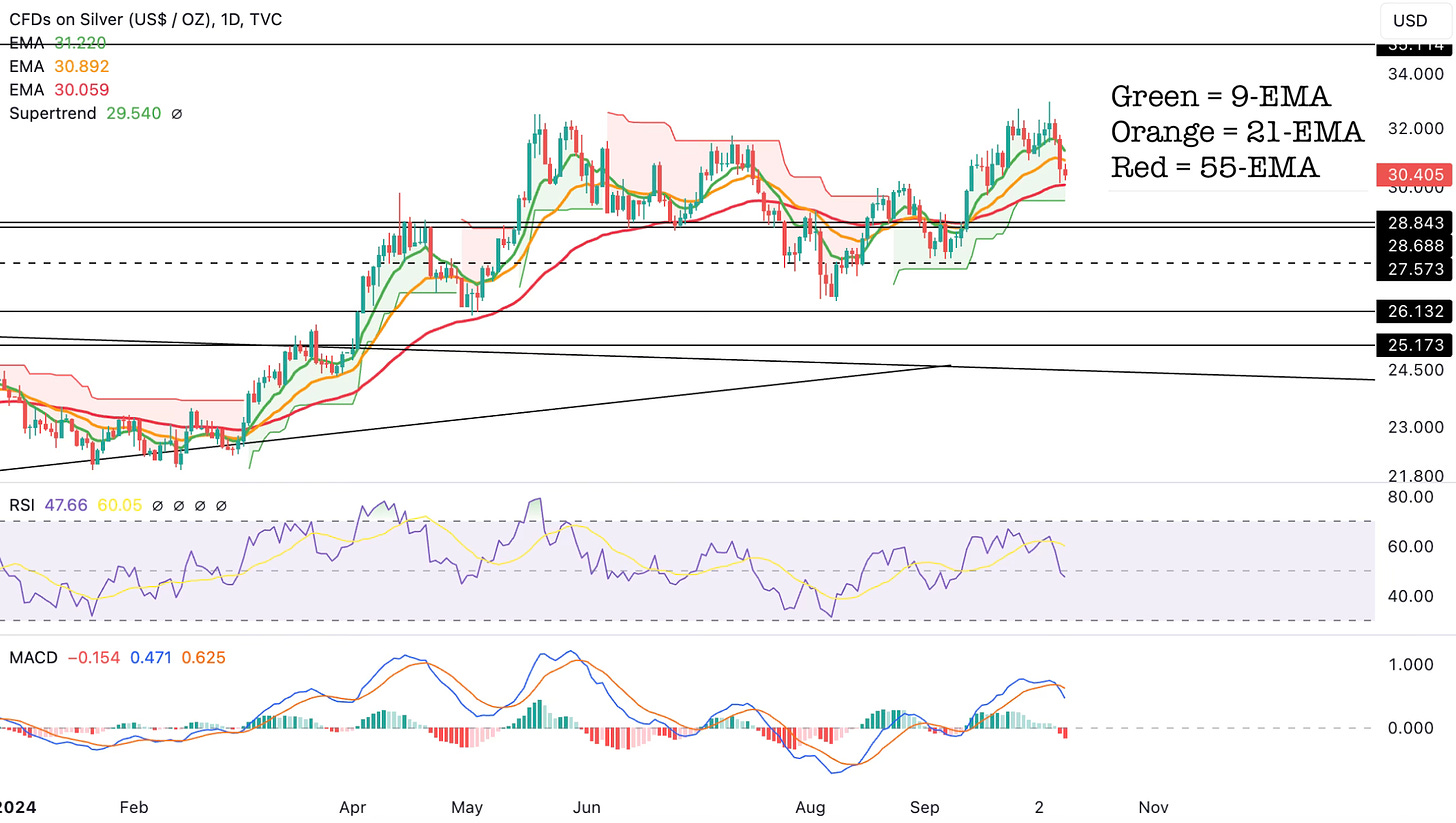
Silver Pullback
Similar to Gold, even Silver is currently pulling back. It is currently hovering just above its daily 55-EMA (at $30.06). A break below the daily 55-EMA would put the supertrend support level at $29.54 and potentially the horizontal support at $28.84 into play.
As far as price is above the $28.84 support level, there’s nothing to worry about for Silver bulls. We still believe that Silver is making its way to our $35.11 initial target that we’ve held since Silver was in the mid-20s.
Next up, we’ll cover our proprietary Cycle Forecasts for Gold and Silver. Then, we’ll dive into the Miners for Gold and Silver, namely: $GDX, $SIL, and $SIL. Lastly, we’ll highlight an attractive Money Making opportunity in Palladium, which has been quite a forgotten commodity in recent months.
Find our membership cost/benefits below. If you’re serious about Making Money (our primary goal at Cycles Edge), then the Premium Sections are key for you!
Gold’s Cycle Forecasts


