2024 Stock Market Outlook
Preface: The Most Important Thing
He said…she said…I said…it doesn’t matter much. The most important thing to make money in the financial markets is to follow the trend and follow the cycle, where the former is more important. Making money is always more important than sounding smart. Having said that, let’s see what 2024 has in store for us.
Presidential & Decennial Cycles: Expect Volatility
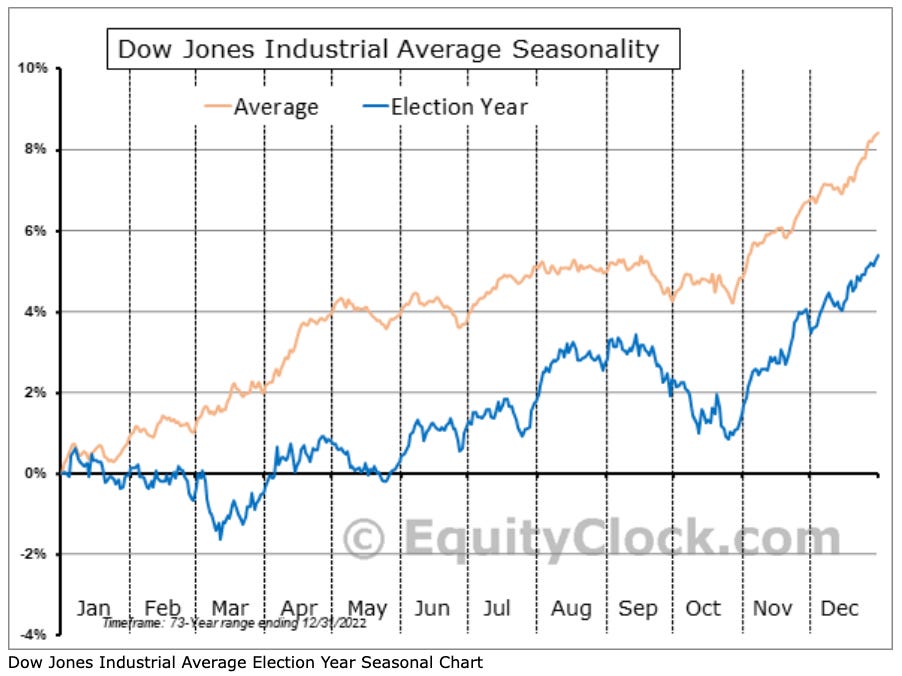
In the Four Year Presidential Cycle, 2024 will be an Election Year, which is not for the faint of heart. The Election Year often has weakness in the 1st Quarter, some strength in between, and then weakness before Election Day. Typically, when the next President is known and a degree of certainty is restored to the public, the stock market usually rallies in November and December.
Based on statistics from The Stock Trader’s Almanac, when the Sitting President Runs, the market is up 12.8% for the year. If it’s an Open Field (issues with Incumbent President) the market tends to dip 5% in the first quarter and end down 1.5% for the year. Based on this it’s a good idea to keep an eye on the strength of Biden’s re-election campaign.
Many cycle analysts follow the Decennial Cycle and under this study, “4” years are full of fits and starts, short squeezes and rug pulls. Range trading key levels could become your best friend in 2024.
Knowing these cycles gives us an edge, now let’s look at other factors.
Macro: The Narrative Better Hold
In November Fed Chair Powell gave guidance that got the market to expect a Fed Pivot to “Dovish Policy” in 2024. The Street is expecting six cuts to the Fed Funds Rate, getting it down to 3.75% by the end of 2024. Market rates such as the 10-year Treasury Rate (TNX) are reflecting this expectation and as interest rates come down, P/E ratios and valuations go up. This narrative assumes that we have vanquished inflation.
But…what if we didn’t? The Geopolitical scene is very hot right now and news of a new conflict or war could spike oil prices. Oil prices are a top contributor to inflation, so if oil prices or commodity prices spike, that could weaken the “Fed killed inflation, let’s bring on Dovish policy” narrative. We see the risk here. The market is rallying on the Fed Pivot narrative, and anything that discredits that narrative could cause a rug-pull in the markets, especially since the market is drastically overbought.
There could be a “buy the hype, sell the event” dynamic going on here. Often expectations of a Fed Pivot to Dovish Policy lead to a rally, but when the Fed actually cuts the Fed Funds Rate, the market goes down. In the chart below you can see that when the Fed Funds Rate (orange line) drops, the S&P 500 (black line) also tends to drop. This is often because the Fed kept rates too high for too long and that causes an economic slowdown.
The Yield Curve Inversion is another potential issue. Typically, when an inverted yield curve begins to re-steepen and breaks above the 0 point or “un-inverts”, the economy and stock market decline. In the chart below, the orange line represents the 10-Year to 2-Year Yield Curve and the black line represents the S&P 500. Notice that when the Yield Curve re-steepened above 0, the SPX dropped in 2001, 2007, and 2020. This is something to monitor this year.
On the bright side, we’ve been having “rolling recessions” where the economic slowdown only hits certain industries and not the economy as a whole. If this continues, an upcoming economic recession may only hurt certain industries, leaving the greater US economy unscathed.
Valuation: Earnings Need to Step Up
The S&P 500 is up about 24% this year and it’s mostly from multiple expansion, not earnings growth. It is trading at $4,781 or about 21.7x 2023 estimated earnings of $220 or 19.6x 2024 estimated earnings of $244.
The market is not cheap right now. The 25-year average Forward P/E is 16.75x. Moreover, it is not likely that a lot of gains will come from multiple expansion this year, as the P/E ratio is close to the high level. Wall Street expects earnings to increase by 11% over the next year. If the S&P 500 increases by 11%, it would bring the P/E ratio to about 22.1x, near the upper historical extreme.
Technical Analysis: Our Secret Levels
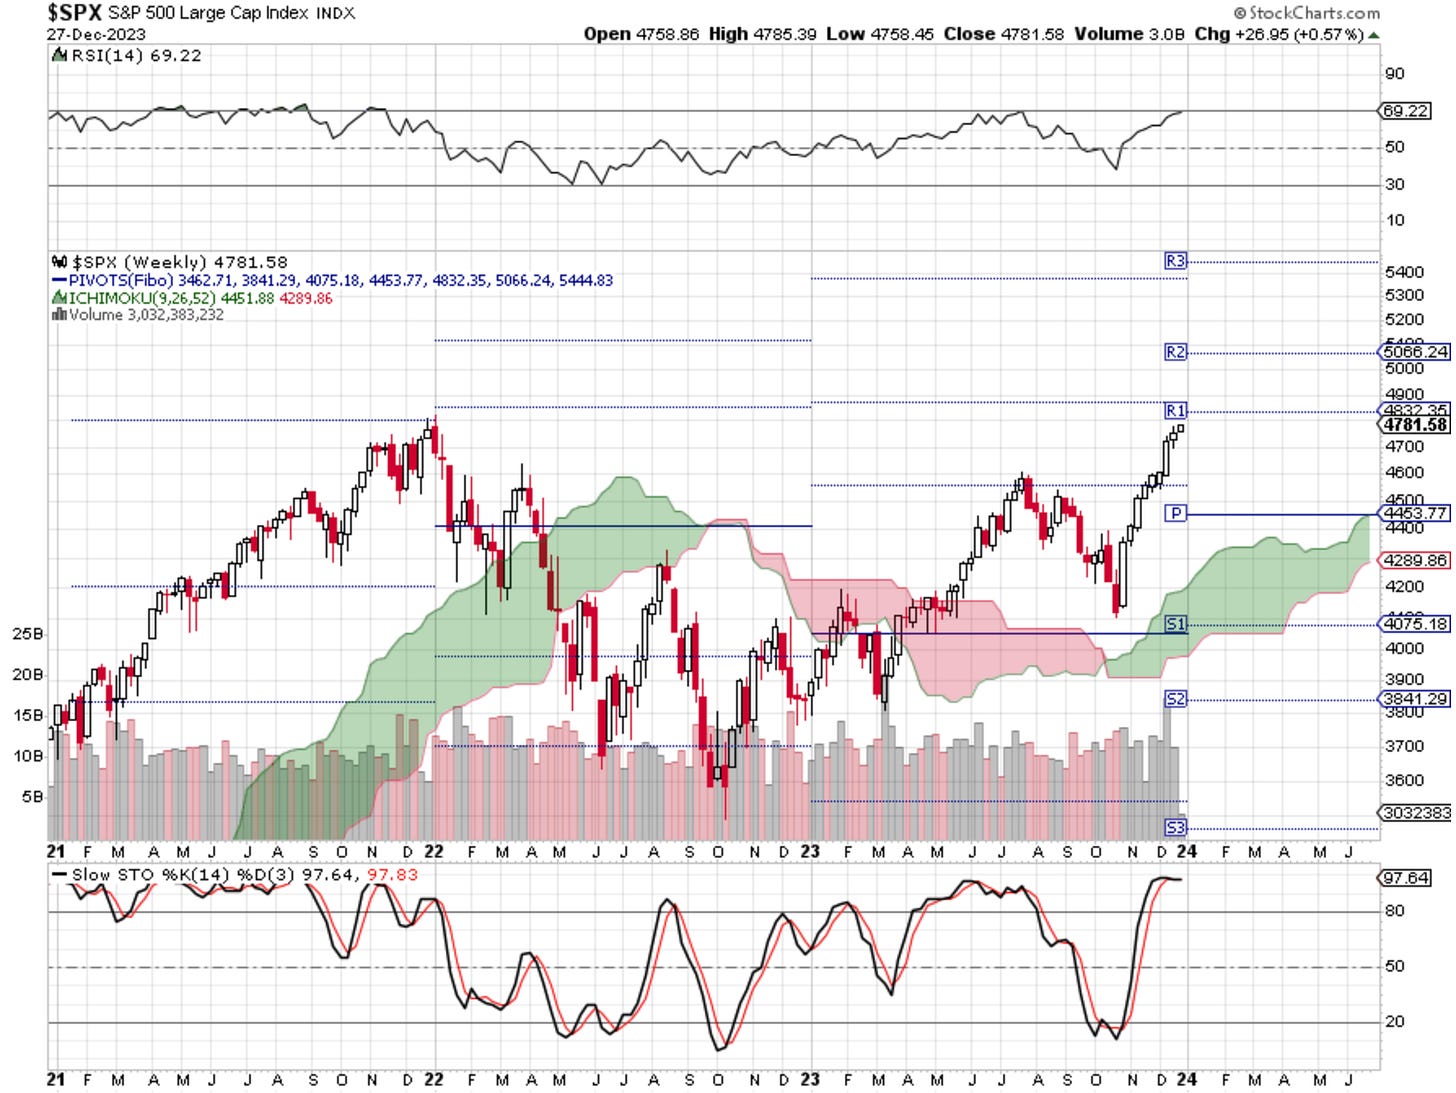
We have found that observing Fibonacci Pivot Points on the weekly chart of the S&P 500 is a way to identify the key levels for the year.
In 2023, the SPX chopped around the Pivot Point around $4,050 from January through May. Finally, at the end of May, it moved up to the Resistance 1 (R1) Fibonacci Pivot Point around $4,562. There it was reversed back down towards the Pivot Point once again but stopped short of touching it. The SPX is now on a year-end rally and may touch the Resistance 2 (R2) Fibonacci Pivot Point around $4,870. If you look at previous years on the chart below, you can also see the importance of these Fibonacci Pivot Points. The SPX ended 2021 kissing the Resistance 3 (R3) Pivot Point and in 2022 price ended the year hovering around the Support 1 (S1) Pivot Point.
For 2024, here are the Fibonacci Pivot Point and estimates of Forward P/E ratios:
Pivot Point = $4,454 (18.3x F P/E)
Resistance 1 = $4,832 (19.8x F P/E)
Resistance 2 = $5,066 (20.8x F P/E)
Resistance 3 = $5,444 (22.4x F P/E)
Support 1 = $4,075 (16.7x F P/E)
Support 2 = $3,841 (15.77x F P/E)
Support 3 = $3,363 (14.2x F P/E)
Now let’s combine these pivot points with Election Year Seasonality to paint a picture:
Between January to March 2024, a pullback to the Pivot Point at $4,454 (more likely) or the S1 Pivot Point at $4,075 (less likely) is possible.
Between April to September the SPX drives higher to the R1 Pivot Point at $4,832 or R2 Pivot Point at $5,066.
Starting September the SPX pulls back to the Pivot Point at $4,454.
After Election Day the SPX has a year-end rally to the R3 Pivot Point at $5,444.
We expect a lot of volatility, but it is possible that the market ends the year higher and the $5,444 target is only 11% to 12% higher than the current level, assuming that the SPX ends the year at the R2 Pivot Point at $4,870. This also coincides with the 11% earnings growth that is estimated.
Consensus Caution: When Everyone Agrees, The Opposite Could Happen
If you go on CNBC or look at 2024 Forecasts from the top Wall Street firms, it sounds like everyone agrees that 2024 will be a bull run year and the risk of recession is small, and if there is one it will be a soft landing. The way everyone sounds bullish reminds me of December 2022, when everyone was bearish.
When everyone agrees and the trade gets crowded, something happens…the market maker takes the opposite side of the trade to make a market. The market makers control prices, so in 2022 when everyone was short, the market makers were long and they made sure the market did not drop (they don’t want to lose money). They did pump the market higher and exited their long positions by the end of the July 2023 high. In 2024 let’s see what happens when everyone is long. Market makers may accumulate a large short position and drop the market to exit short positions at a profit. It’s possible that this does not happen. However, now that you are warned, you can plan for the case where things go against you and you can protect your capital.
Conclusion: A Hard-Fought Victory
We expect 2024 to be very volatile and trying, with many ups and downs. However, the market may end up higher by 11% to 13% by year-end. For an alpha edge, you can see which assets and sectors might have a relative strength edge in the First Quarter here. To look at our past analysis, click here. We hope you all have much success in 2024!
Disclaimer - All materials, information, and ideas from Cycles Edge are for educational purposes only and should not be considered Financial Advice. This blog may document actions done by the owners/writers of this blog, thus it should be assumed that positions are likely taken. If this is an issue, please discontinue reading. Cycles Edge takes no responsibility for possible losses, as markets can be volatile and unpredictable, leading to constantly changing opinions or forecasts.


