


A Contrarian Bet
It's SO Risk-Off That It Might Actually Be Risk-On!

2025 has been a crazy year (until now), even for seasoned investors.
The headline driven stock market has been quite unreliable… one big news headline (even if it’s not true) can cause a MASSIVE move up or down.
That’s the reality of today’s stock market unfortunately.
But, in such an uncertain environment, an effective approach is to zoom out a little and look at the bigger picture.
This helps position for the broader trend that’s likely to develop, instead of getting chopped around because of the short-term uncertainty and volatility.
That’s exactly what we’ll do in this article.
The 20% crash on the S&P 500 hit and found support in an extremely important zone around 4820 points.
This has confluence from:
Uptrend line from the 2020 lows
Resistance turned into support from late-2021 highs
0.5 Fibonacci retracement from the 2022 bear market lows to the Jan 2025 highs
So, even though the sell-off was aggressive, the broader bullish structure has still not been damaged yet.
Going forward, the 4820 support region is important to defend because a break below would put 4500 level into play (0.618 Fib retracement).

Even though the broader bullish structure is intact for now, the recent sell-off caused the Fear and Greed index to drop to 3!
This is among the lowest reading on this index ever recorded, indicating a LOT of fear and panic.
But where there is short-term extreme fear, there’s often a medium-term attractive opportunity…

Extreme Fear Caused Risk-Off Sentiment
This opportunity can be seen through the Risk On/Off indicator that fell to an extreme risk-off zone.
The red dots highlight those dates when this indicator’s 3-day MA closed below 5 for the first time in 3 months.
The most recent signal occurred on April 10th.

This signal was only the 7th such one since 2002.
The table below displays the S&P 500's performance up to 12 months following each previous signal, along with a summary of the overall results.
We can see that from the 1 month mark until the 12 months mark following the signal, the average and median returns look quite attractive.
So we can expect another month of chop (could be a little longer based on the indicators we cover next) before we enter a more favorable phase following this extreme risk-off state.

Positioning Confirms The Risk-Off Signal
We can also see signs of a bottom/near bottom (at least in the mid-term) on the VIX term structure.
For this indicator, we're comparing the 1-month VIX futures to the 3-month VIX futures (where futures traders think the VIX will be priced in 3 months), a way of looking at what is called "term structure."
The spread will be high if futures traders think volatility will spike in the near term and the opposite also holds true.
It's rare to see VIX futures contracts that don't expire for a while lower-priced than the near-term futures.
When futures traders are pricing in much higher volatility levels (i.e., the blue indicator goes above the green dotted line), then it means that traders are panicking and pricing in high amounts of near-term volatility.
It usually doesn't play out that way though because stocks often bottom soon after the ratio reaches 1.0 or 1.2 in times of actual panic.
The chart below highlights all dates when the VIX Term Structure crossed above 1.25 (extreme panic) with the returns (up to 12 months) after the signal.
In most cases, stocks struggled up to 2 months, but after that they saw quite attractive returns, especially looking out 6 months and 12 months.

Investors Scared Of A Bear Market Following A Death Cross
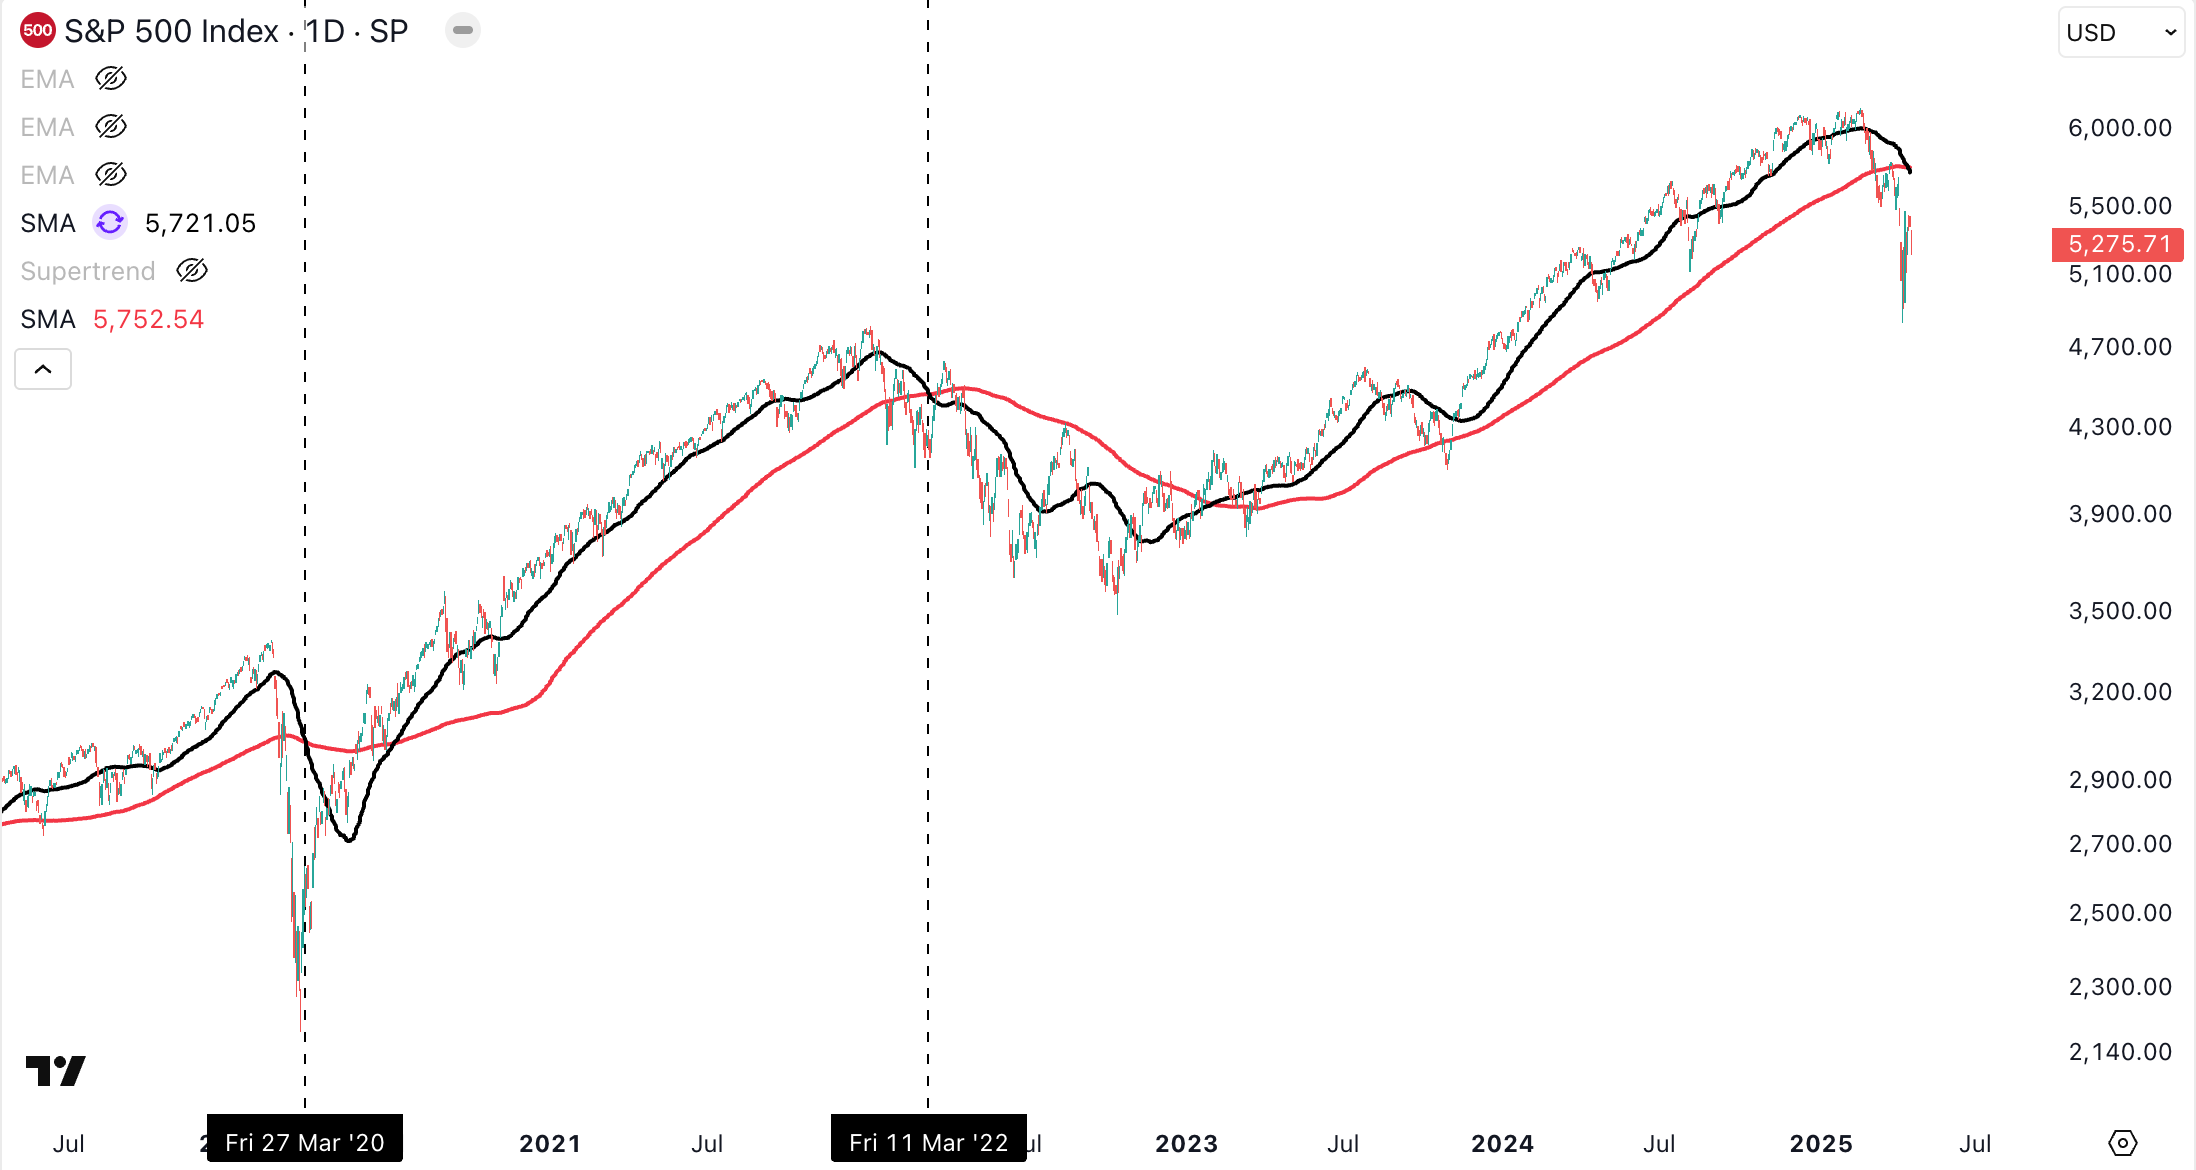
Now, to add to the existing panic, the S&P 500 death cross narrative has also begun circulating, given the S&P 500 death cross that happened this week.
A death cross happens when the 50-day MA crosses below the 200-day MA, indicating strong downward momentum.
For example, in March 2022, the S&P 500 saw a death cross.
This was followed by a big bounce that rolled over and saw the rest of the bear market unfold.
But it doesn’t always play out that way of course, especially during aggressive panic sell-offs.
For example, in March 2020, the S&P 500 also saw a death cross.
This in fact marked the bottom of the downtrend before the market reversed and moved higher.
So, how can we tell which death cross outcome is likely to play out this time around?
That’s exactly what we’ll cover in the next section!
We’ll also look at an indicator that anticipated this stock market volatility and see what it points to next.
Then, we’ll address the tariff based recession concerns that have been on the rise and see if an economic downturn is imminent right now.
We will also dive into the liquidity picture today because at the end of the day, the markets require liquidity to move higher.
Lastly, we’ll give you a run-down on 16 different indicators (like put/call ratio, dumb money confidence, SPY liquidity premium, etc) to see what they are saying comes next for the US stock market.
NOTE: We are considering raising prices on all our membership tiers. We’ll share more details on this in the coming week.
Find our membership cost/benefits below. If you’re serious about Making Money (our primary goal at Cycles Edge), then the Premium Sections are key for you!
