Last Thursday Fed Chair Powell opened his mouth and the market dropped. The next day new buyers swarmed the market to buy the dip. A higher-high vs. the October 17th high was formed, which is seen as confirmation that we are in a bona fide uptrend. Additionally, the Powell-driven drop retested the downtrend channel break for the S&P 500. Traders often say that the break of a channel or trendline is like the changing of an idea. A new mindset. It is possible that the market is now overlooking the fear of bad economics and focusing on the fear of missing out (FOMO) on the year-end rally. The McClellan Summation index hints that the rally is just beginning.
So are we going to have a lockout rally (the market keeps going up and doesn’t pull back to let people enter), or do we get a pullback? Let’s use Player Analysis, Seasonality, Technical Analysis, and Cycles to figure this out.
Player Analysis:
The market has many different groups, and we find that understanding their behavior and motivations is quite an edge. We call this “Player Analysis”.
What is retail doing? Retail or Dumb Money quickly locked in profits, while Smart Money is holding its equity exposure, anticipating a pullback to buy more.
Not only does retail not believe in the rally, but they are still quite bearish, evidenced by their continuous buying of puts to short the market. When they finally throw in the towel, another short squeeze could occur.
The Fear and Greed Model confirms that there is still an overall bearish sentiment in the market. The market usually goes up when most people doubt it and it usually goes down when everyone is bullish.
Financial Advisors and Professional Portfolio Managers are raising equity exposure to adjust to the new risk-on environment. From their point of view, they fear sitting out of a possible year-end rally. If your Financial Advisor took your cash and hid in the corner while the market roared higher, would you fire them? RIAs often collect orders from clients and trade in blocks at the end of the trading day. If you use a 1 minute chart you could see buying spikes from 3:50 to 3:59 pm EST over the past few trading days. This is them playing catchup for their clients. The chart below shows NAAIM Exposure rising, documenting this dynamic.
Margin debt is still quite low which means two things:
1) The risk of a waterfall selloff is low
2) If investors increase their use of margin debt that could be fuel for a rally
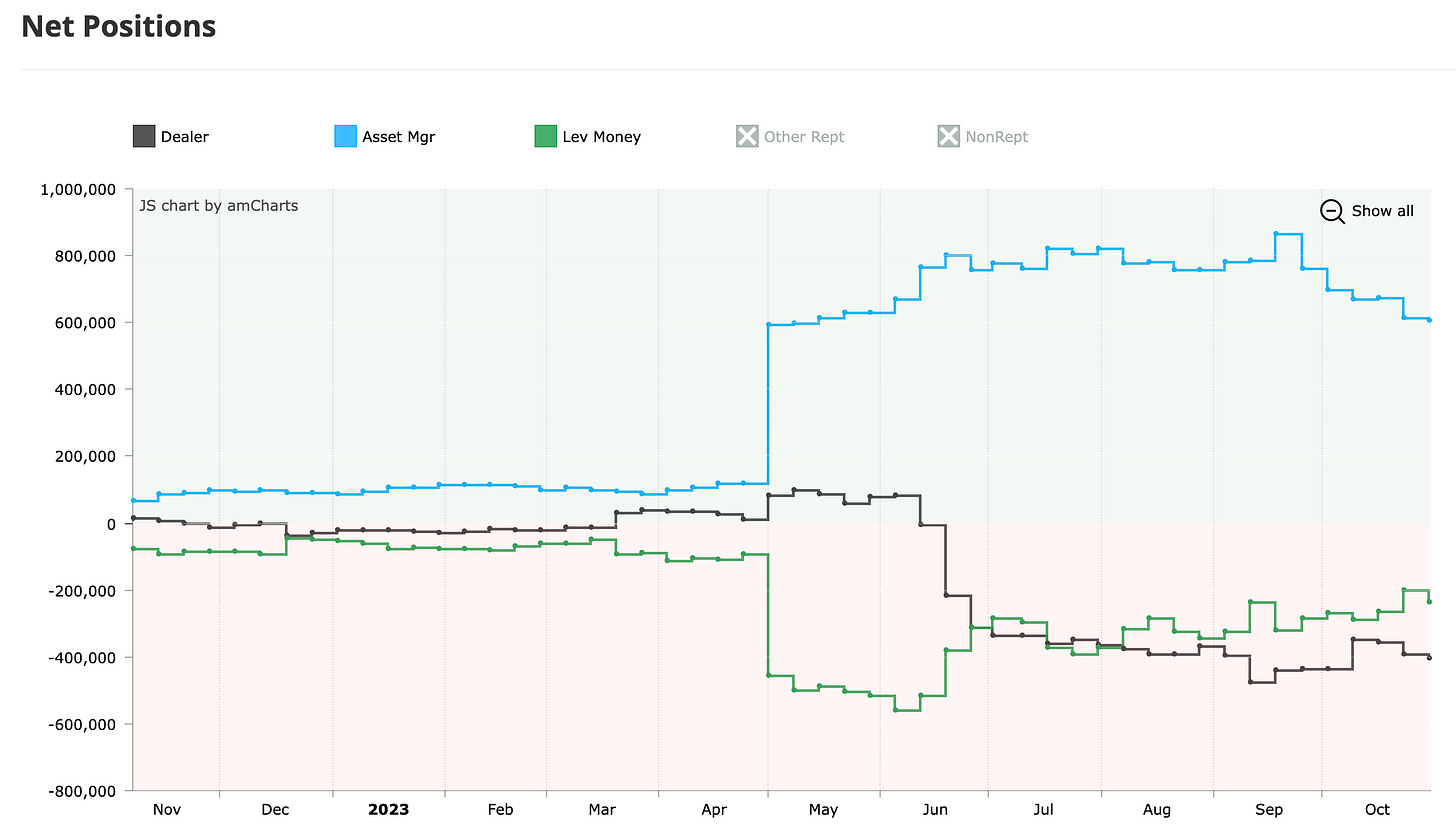
Looking at the S&P 500 Commitment of Traders (COT) Report we can see that Asset Managers, Market Makers (Dealer), and Hedge Funds (Lev Money) are reducing their equity exposure.
Going more in-depth, we could see that Asset Managers and Market Makers are holding their long positions (fits with the Smart Money/Dumb Money indicator), while Hedge Funds are slightly reducing their equity exposure.
On the short side, Asset Managers, Market Makers, and Hedge Funds are all slightly increasing their short positions. This weighs in favor of an upcoming pullback for the S&P 500.
The Nasdaq 100 COT Report shows something different. Although net positions were pretty unchanged…
…we can see that Market Makers and Hedge Funds (to a lesser degree) have been accumulating long positions in the Nasdaq 100, as Asset Managers took some profit into strength. Market Makers buy to sell at higher levels later providing a hint that Nasdaq 100 stocks will have relative strength and an upward trajectory in the foreseeable future.
As for short positions, Asset Managers hedged their portfolios, while Market Makers and Hedge Funds reduced short positions. Are they doing that because they know prices will go up in the future?
The Russell 2000 net positions show little change.
But under the surface, we can see that Hedge Funds began accumulating long positions for Small Caps on 9/25. Asset Managers and Market Makers joined in on 10/23 almost a month later.
Looking at short positions Asset Managers have rapidly increased short positions in the Russell 2000. Market Makers are also adding short positions, albeit at a slower pace, as Hedge Funds seem to be holding but not adding to their short positions. It seems like more weakness is possible for small-cap stocks in the next few days/weeks, but Hedge Funds are betting on a year-end rally.
Seasonality
Seasonality may be a huge part of the puzzle. Using 30 years of data, the S&P 500 seems to peak on 11/13, and go through a pullback until it’s ready to run for the Thanksgiving rally. According to this seasonality chart, preparing to buy around the 19th and 20th of November could be a viable pullback strategy.
Here is another seasonality chart for SPY. The vertical black line shows that we could be on the verge of a pullback, followed by a Thanksgiving rally and then a Christmas rally. Remember, the market can do whatever it wants and does not have to follow seasonality.
The QQQ Seasonality Chart also suggests a pullback, which could be an opportunity for Market Makers to add to their positions. Note that December is a weaker month for QQQ. Perhaps an early-December profit-taking could occur.
The IWM Seasonality Chart shows a sharp pullback in mid-November, followed by a strong December. Small-caps lagged large growth stocks in the Summer rally by a month. Perhaps we are setting up for the same. Hedge Funds may be betting on a late November drop as an opportunity to exit their short positions, and then a bull run for small caps in December.
Technical Analysis & Cycles
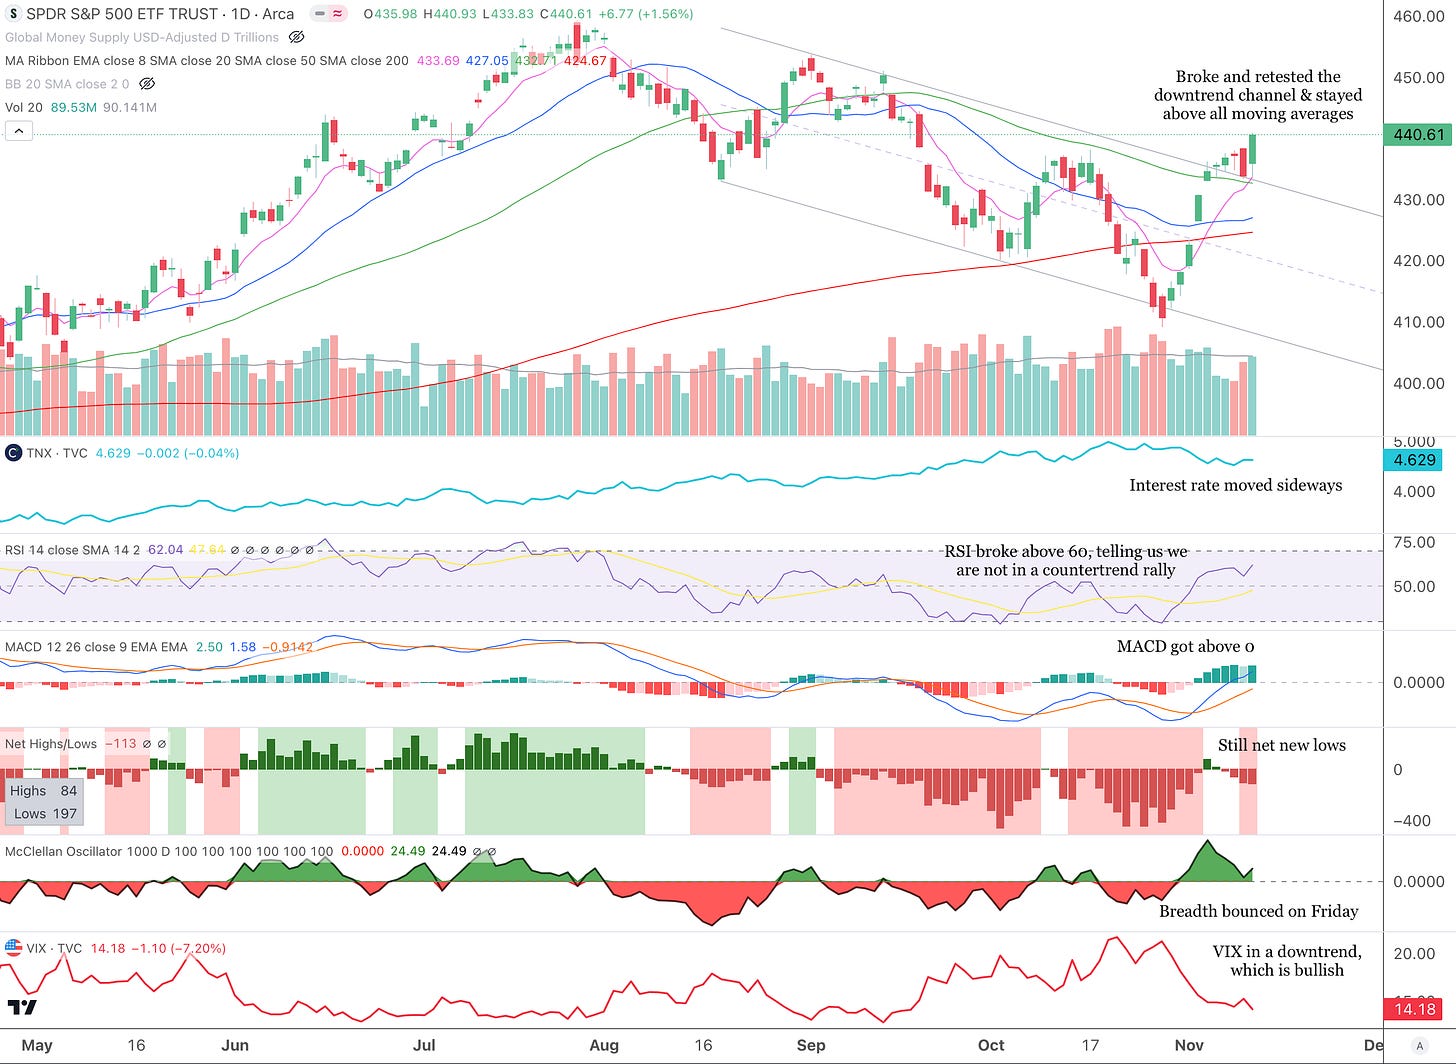
Looking at the chart below we could see how the S&P 500 broke and retested the downtrend channel. It also held above the 50 SMA (green line) which is a show of strength. The 10-year Treasury rate stayed sideways, making this rally possible. The RSI indicator broke above the 60 level and this makes the statement that we are in a new uptrend and not a countertrend rally. MACD climbed above 0, and from our experience, when that happens, larger upside moves tend to happen. There are still net new lows, which does take away from the bullish thesis. Right now the Magnificent 7 are driving the rally and a broad-based rally has not started yet. Nonetheless, the McClellan Oscillator bounced on Friday showing that breadth is increasing. Lastly, the VIX continues lower, which is positive for stocks. Overall the technicals and market internals are supportive of a continued rally.
So are we in a Swing Trader’s Market? Not fully yet. The Nasdaq 100 is in an uptrend above the 21 EMA and the MACD is above 0. Net new highs are still missing though. There is definitely the opportunity to make money in QQQ, the Magnificent 7, and other leading stocks, however, the rally doesn’t seem broad yet. The Russell 2000 Growth (IWO) is still below the 21 EMA, with MACD below 0. Small-cap growth stocks are not really participating yet. IWO may be late, but we should keep an eye on it to see when it wakes up and joins the Thanksgiving rally party.
The cycles chart for QQQ points to a top around 11/13, followed by a buyable low around 11/18. Given the strength of the Nasdaq 100, adding exposure to QQQ or Magnificent 7 stocks on every dip could be a viable accumulation strategy to profit from the Thanksgiving rally.
The cycles chart for IWO actually looks more bullish with a consolidation between 11/16 to 11/19, and the latter date being the buy point before the rally.
Conclusion
Here are the key takeaways from this Player Analysis:
Retail doesn’t believe in the rally and continues to short the market = fuel for the rally to continue.
Financial Advisors are rushing to add equity exposure for their clients, hoping not to miss out = fuel for the rally to continue.
Margin Debt is low and if investors utilize margin debt to increase their investments = possible fuel for the rally to continue.
Asset Managers are holding but hedging S&P 500 positions; trimming and hedging Nasdaq 100 positions and adding to yet hedging Russell 2000 positions = whatever.
Market Makers are trimming exposure to the S&P 500; rapidly accumulating positions in the Nasdaq 100 and are pretty flat on the Russell 2000 = supports bullish action for the Nasdaq 100 and not much of a pullback in November.
Hedge Funds are flat on the S&P 500, accumulating long positions in the Nasdaq 100 and speculating on a Russell 2000 rally in December = supports bullish action in the Nasdaq 100 and Russell 2000.
Our analysis points to a continued rally into year-end. A pullback or consolidation is possible and investors willing to take the risk should consider adding equity exposure on every dip, especially in the Nasdaq 100 (not much of a pullback expected due to market maker support) and Magnificent 7 stocks. The S&P 500 could have more of a pullback, but has a buy point before Thanksgiving. Hedge Funds are betting on a Russell 2000 rally that would probably start during the Thanksgiving rally and could strengthen in December. This timing could coincide with the Russell 2000 Growth Index achieving a Swing Trader’s Market, and if that happens, scanning for leading “bagger” stocks (small-cap growth stocks with a catalyst, story, or stellar revenue growth) could be lucrative. Best of luck and always manage your own risk.
Disclaimer - All materials, information, and ideas from Cycles Edge are for educational purposes only and should not be considered Financial Advice. This blog may document actions done by the owners/writers of this blog, thus it should be assumed that positions are likely taken. If this is an issue, please discontinue reading. Cycles Edge takes no responsibility for possible losses, as markets can be volatile and unpredictable, leading to constantly changing opinions or forecasts.


