

A Rotation that Refreshes
Premium Section: Our Top ETF Picks for 2026

Our Annual 2026 Cycle Forecasts that can be found here.
This is a key piece of our strategy to stay on the right side of the market!
Here’s a quick rundown of what to expect:
1 PDF deck covering 20 different key assets
Each Forecast includes 3 key Cycles - Cycles Composite (our “Secret Sauce”), Energy Cycle (estimates the Power behind a move) and Seasonal Cycle
Access to our team to ask any additional questions anytime of the day or night, including weekends!
Founding Members get the added benefit of requesting us for the Cycle Forecasts for ANY asset.
Please note that we’ve updated the composition of our Cycles Composite (our “Secret Sauce”) in order to increase its accuracy. These modifications are made based on the current market conditions and the backtesting results.
2026 is off to a bullish start. According to The Stock Trader’s Almanac, when the first five trading days of January are positive, the S&P 500 finishes the year higher 84% of the time, with an average gain of 14.2%. As of the January 8 close, the first five trading days were up 1.1%, setting a constructive tone for the year ahead.
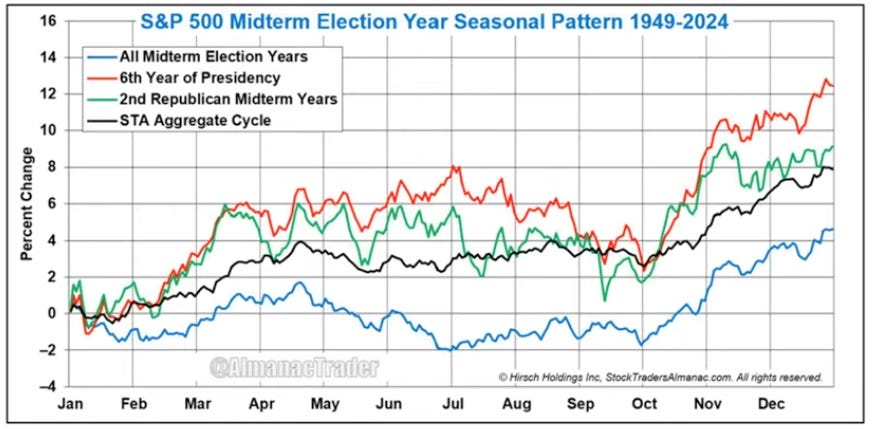
Here is the forecast for Midterm Election Years, courtesy of The Stock Trader’s Almanac. The most important lines are the 6th Year Presidency in red and the 2nd Year Republican Midterm Years in green. So what do we see:
A constructive January with minimal downside
An uptrend that lasts until an early July top
A pullback from July until early October
A “Thank God It’s Over” rally starting in October.
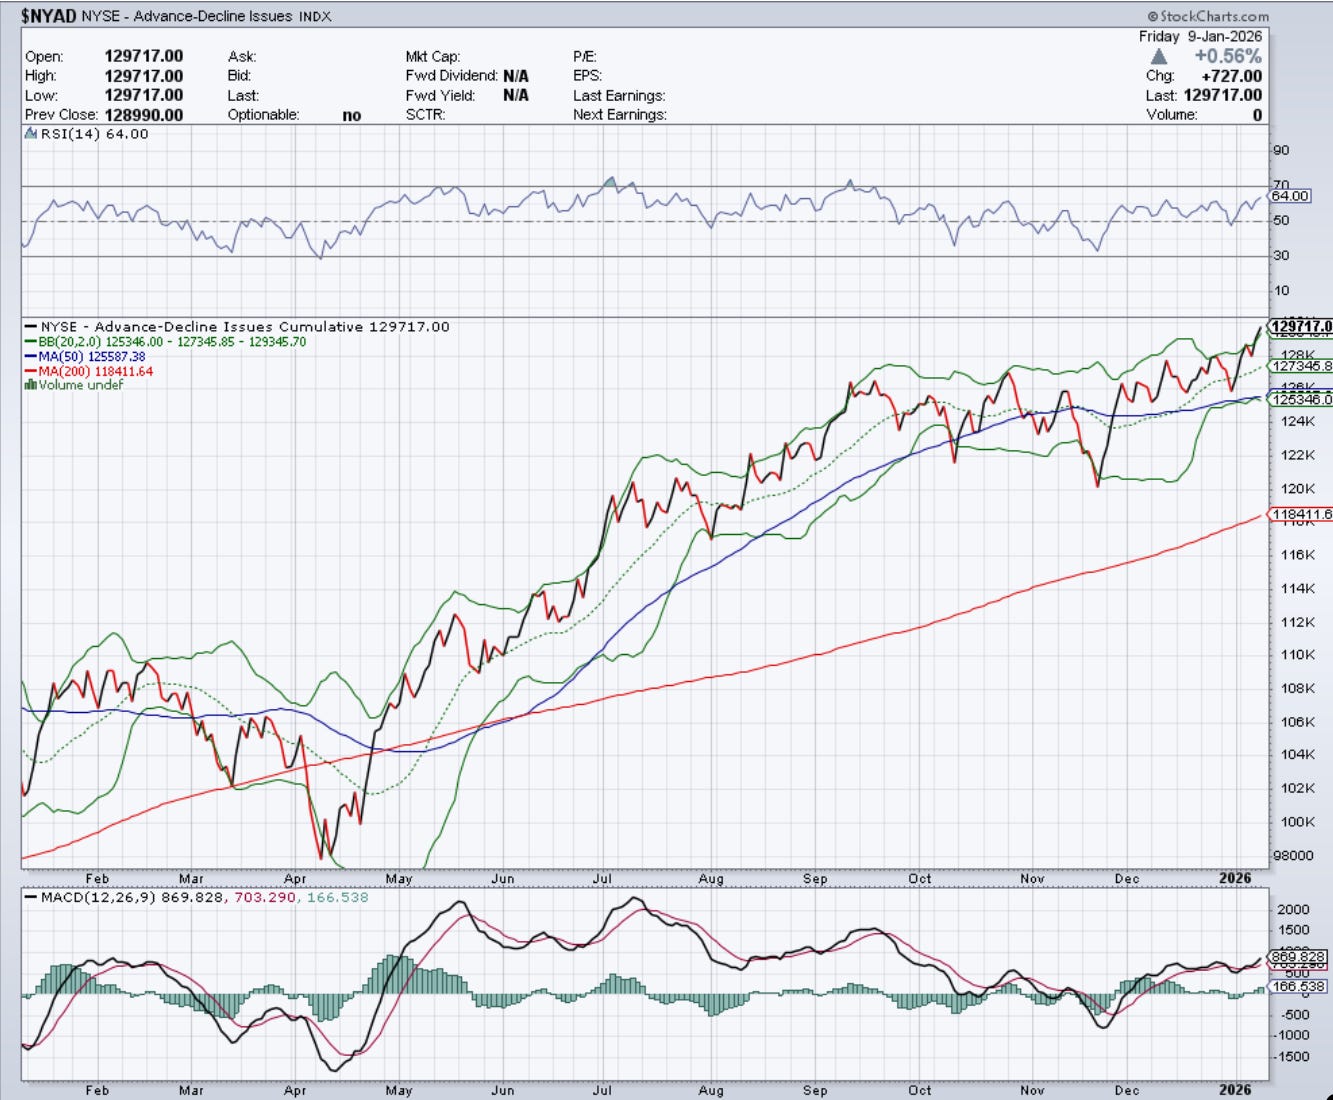
Breadth is breaking out to the upside. You can see that the NYSE Advance/Decline Line ($NYAD) is clearly breaking out of a multi-month range now. This bodes well for a broad-based rally.
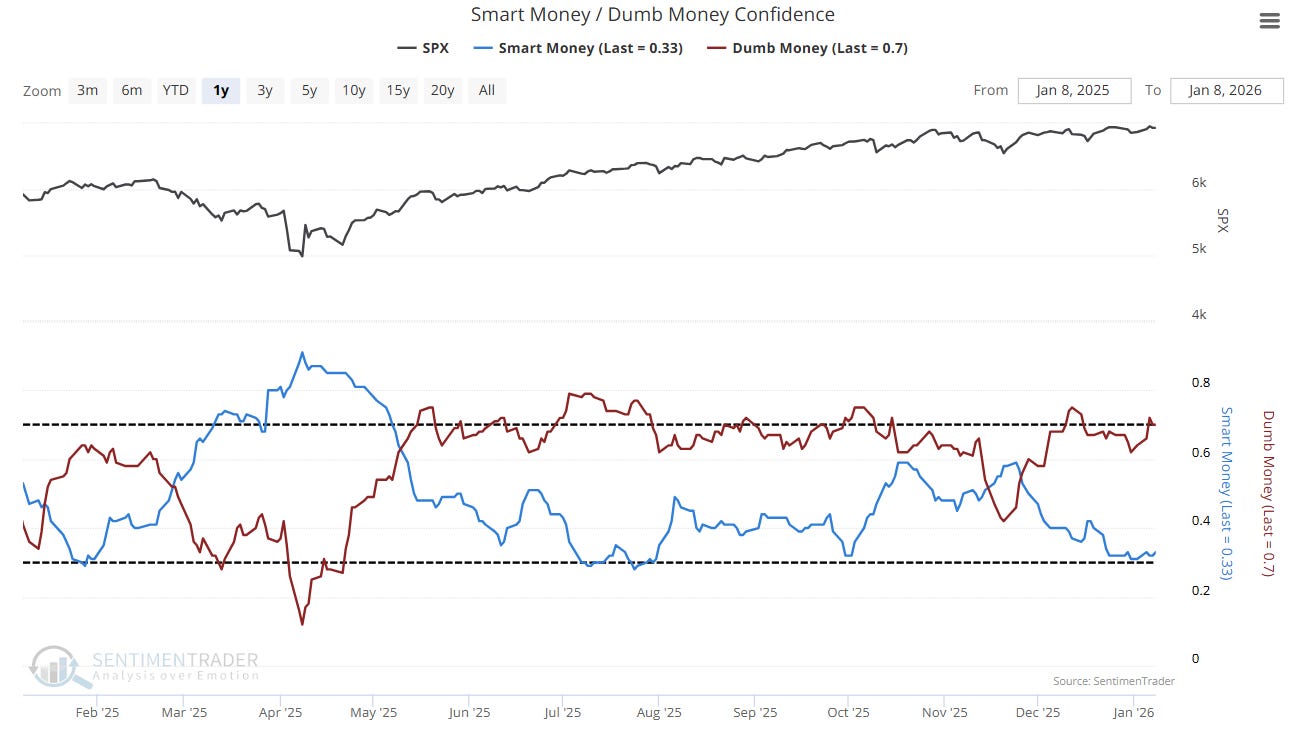
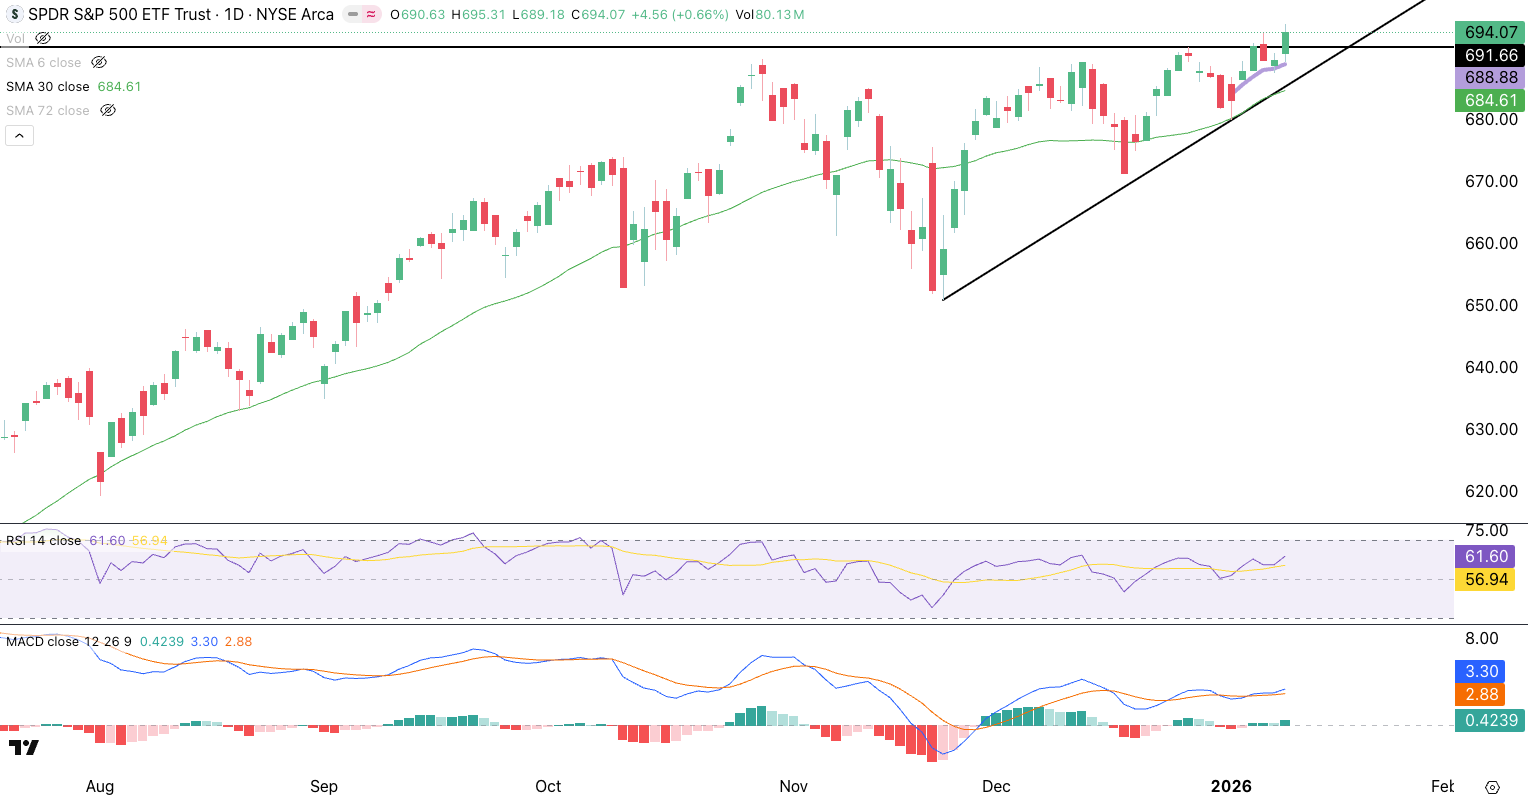
The S&P 500 is currently breaking above and holding above the 12/26/25 high. If this continues higher, then the Smart Money will have to buy back in, which could potentially create a powerful upthrust.
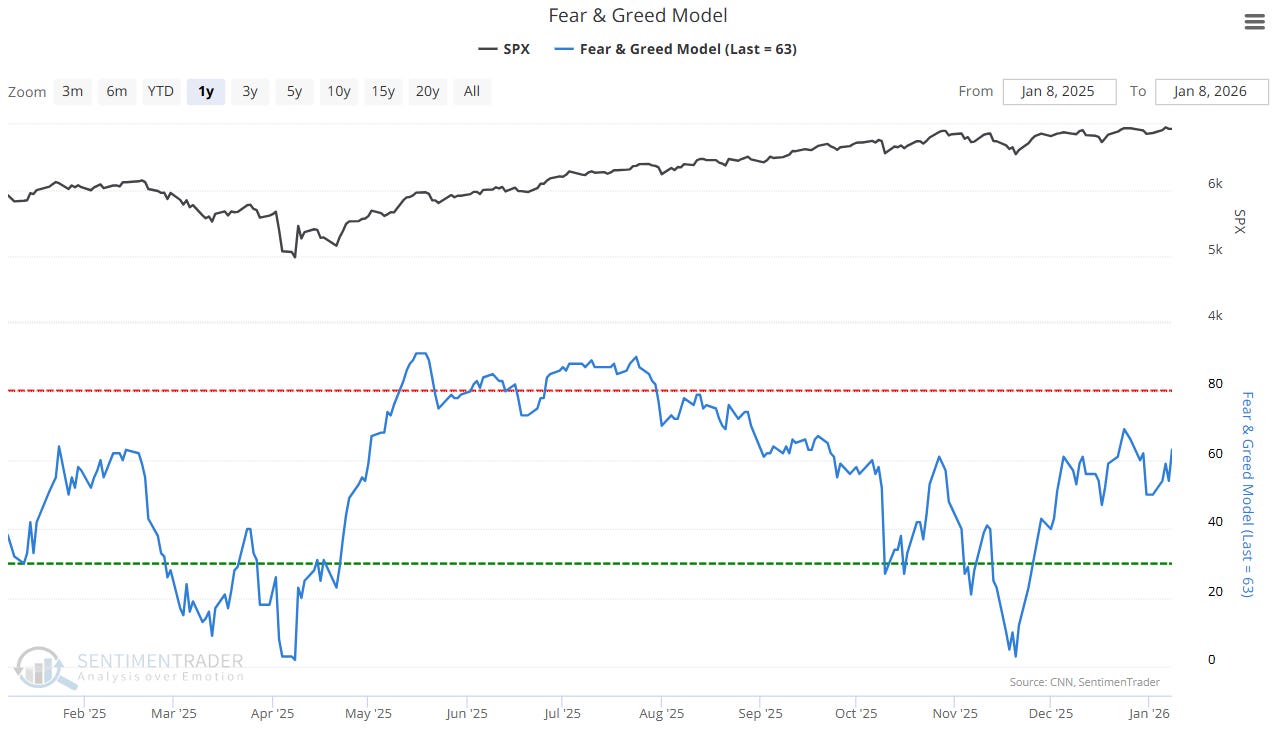
The Fear and Greed Model shows that sentiment is not overly bullish, so there is plenty of room to run.
The chart below shows the S&P 500 breaking out above the 12/26/25 high. As long as the SPY holds above the 30 SMA (green), the Year-to-Date Anchored Volume Weighted Average Price (AVWAP) in purple and the black uptrend line, we expect the breakout to continue. RSI is not yet overbought and the MACD shows improving bullish momentum.
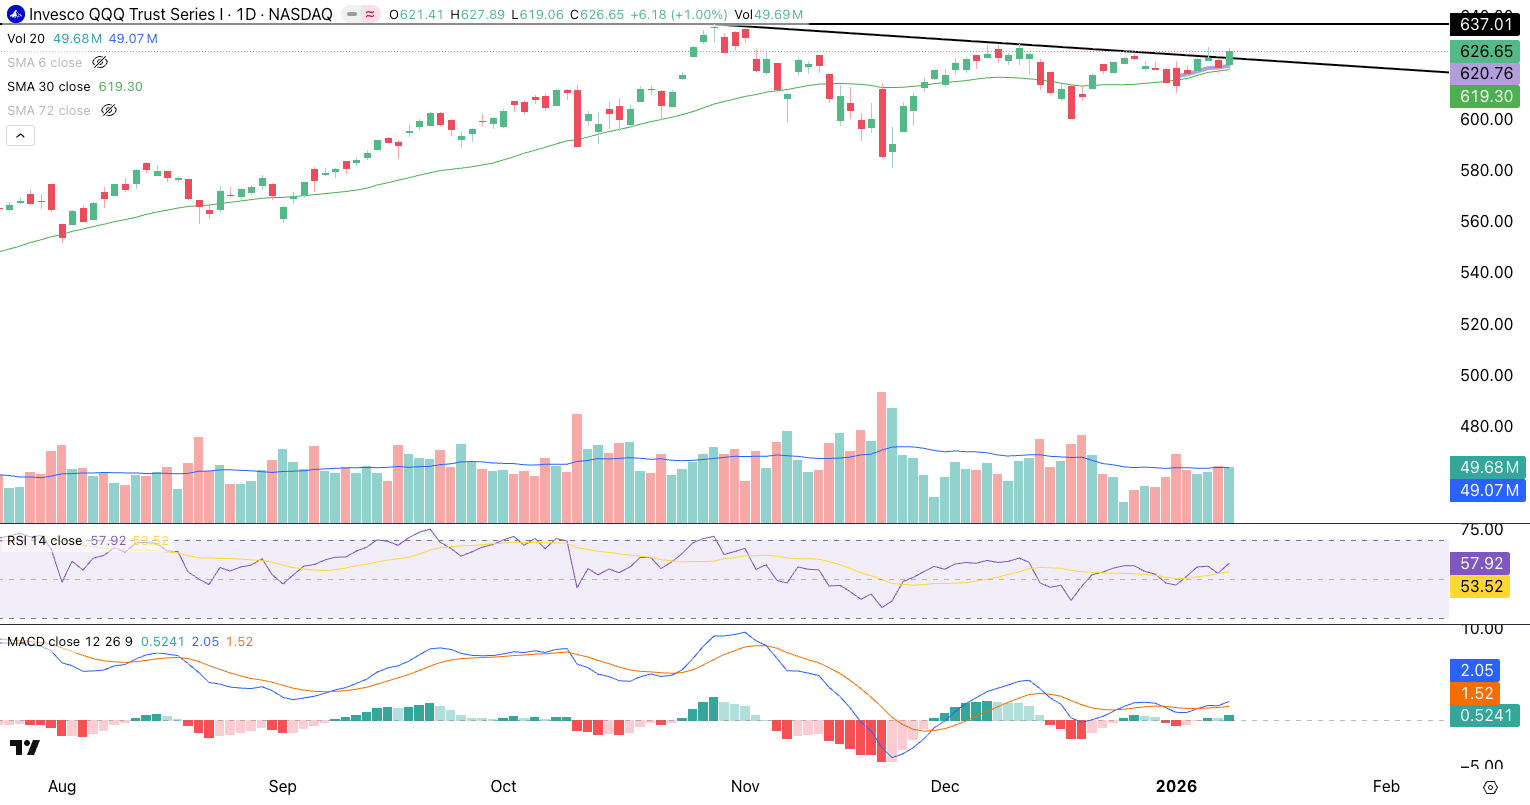
The Nasdaq 100 (QQQ) is definitely lagging and displaying relative weakness vs. the greater market. However that does not mean it cannot play catch-up. The close above the downtrend line on Friday was a positive sign that buyers are beginning to come back, especially after the high volume red candle on Thursday, which held the 30 SMA (green). Price is still above the purple YTD AVWAP so let’s see if buying continues over the next few days. If it can break the 10/29/25 high at $637.01, it would be a very positive sign. The bullish RSI divergence puts the odds in favor of more bullish price action.
The Russell 2000 (IWM) is breaking out above it’s December high and appears to be forming a new upward channel. If this is correct, then it may hit the $271 mark over the next few days. The MACD indicator shows significant strength.

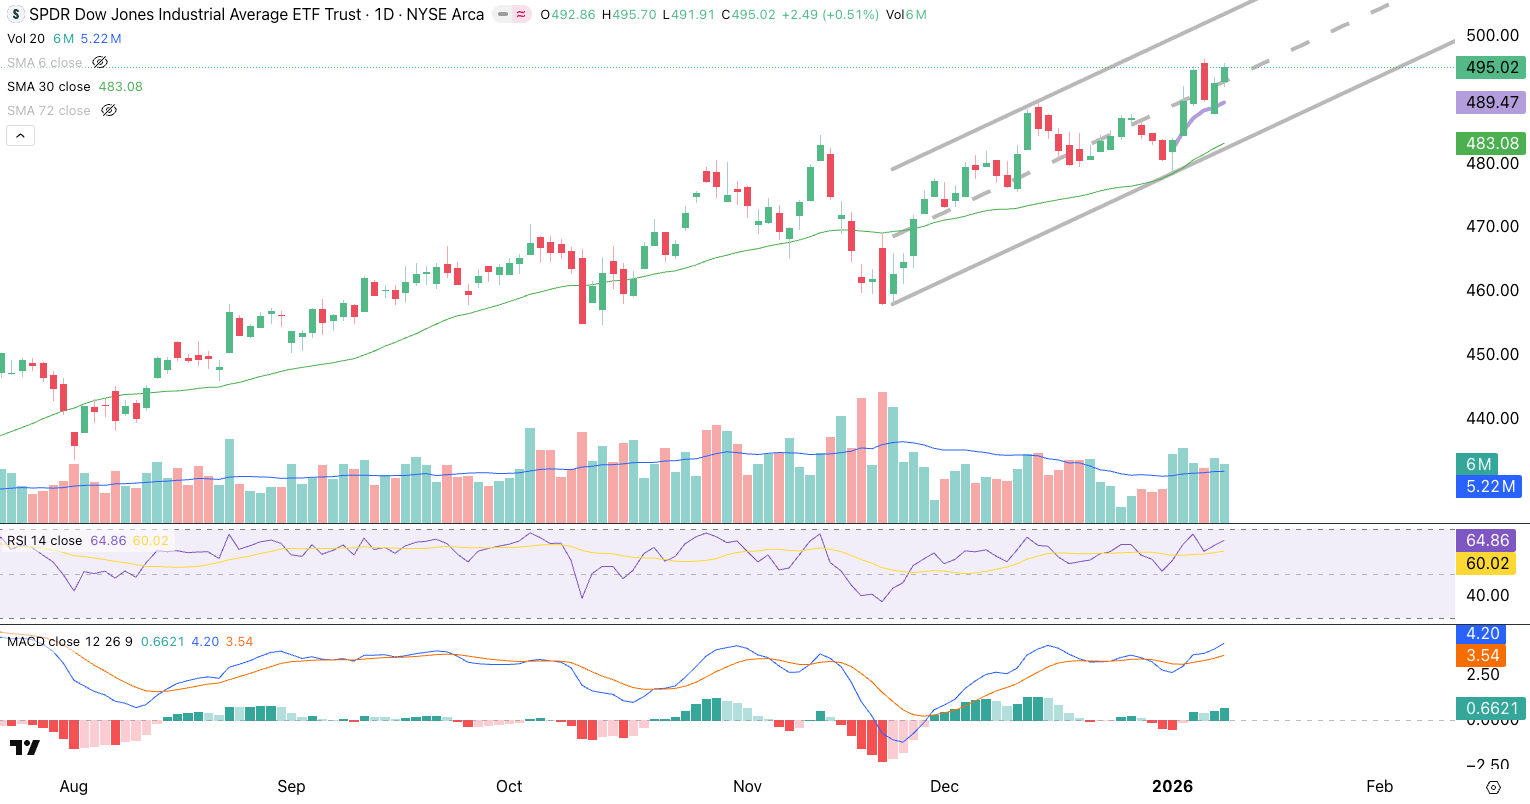
The Dow Jones Industrial Average (DIA) is also forming a new upward channel, and if this is correct, then it may even hit $505 in the next few days. Recent buying spikes in volume provides confirmation that investors are rotating into value, which is very different from 2025, when tech and the Nasdaq 100 led.
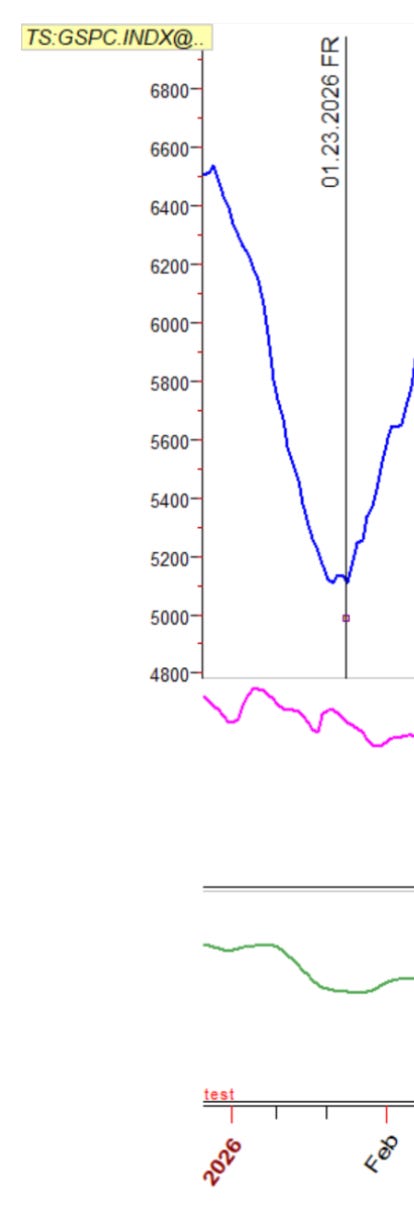
Our Cycles point to some choppiness possible after 1/10/26, which can be used to accumulate equity positions in the upcoming trading days. This choppiness could end around 1/23/26 and a more solid uptrend could occur. For our full-year 2026 Cycle Forecasts visit us here.
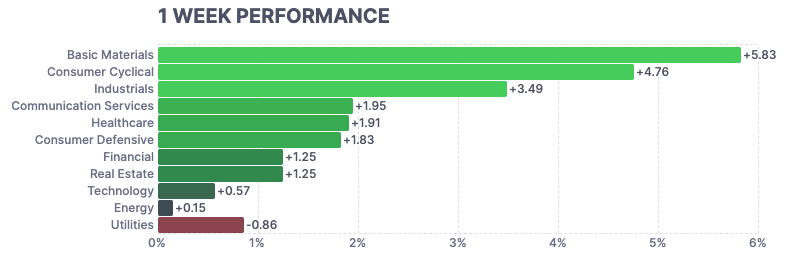
We are noticing some significant rotations in the past week’s performances, telling us that 2026 could be vastly different from 2025. This rotation is very healthy for the stock market and could allow the uptrend to lengthen. However it is crucial to be knowledgeable of these rotations to optimize your portfolio’s return.
In the Premium Section we’ll go over our top ETF rotation picks for 2026.
Disclaimer - All materials, information, and ideas from Cycles Edge are for educational purposes only and should not be considered Financial Advice. This blog may document actions done by the owners/writers of this blog, thus it should be assumed that positions are likely taken. If this is an issue, please discontinue reading. Cycles Edge takes no responsibility for possible losses, as markets can be volatile and unpredictable, leading to constantly changing opinions or forecasts.