

A Tipping Point
Premium Section: Can Geopolitical Events be Anticipated?

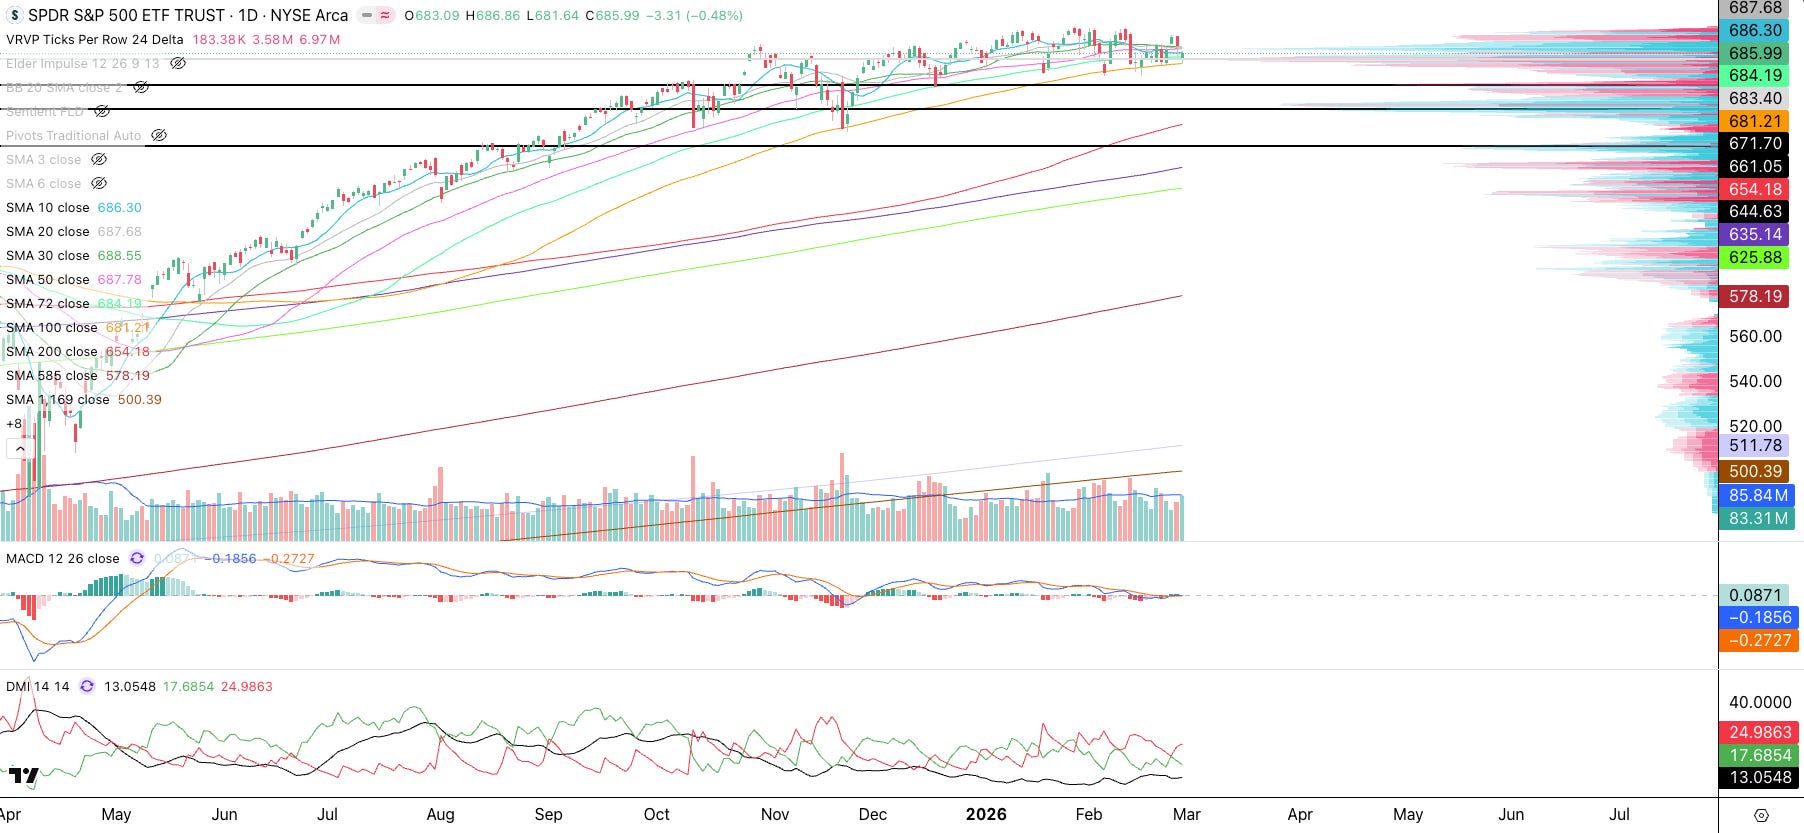
Let’s analyze the market using the Cycles SMA system and Volume Profile. The S&P 500 (SPY) closed the week just above the 100 SMA (orange) and the Volume Profile Point of Control (“POC,” where most shares traded). The 100 SMA has served as support, with the market bouncing off it since November 2025. We know the US attacked Iran this weekend, and this geopolitical exogenous event may be the tipping point that pushes the market into a pullback. Technically, traders who have been buying the dips to the 100 SMA could get stopped out, potentially triggering a rush of sell orders that pushes the market lower at Monday’s open. The market will likely gap down Monday morning. Here are the next support levels:
$671 is a high volume node on the Volume Profile where support can come in. It also coincides with the Anchored Volume Weighted Average Price (AVWAP, not shown) from 8/1/25. This is a 2% pullback.
$661 is another high volume node that can provide strong support. This is a 3.6% pullback.
$654 is the 200 SMA, which is a natural support level after the 100 SMA is lost. This represents about a 4.6% pullback.
$644 to $642 is a confluence support zone from a high volume node and the AVWAP from the April 2025 bottom. This represents about a 6.1% pullback. I believe that this level holds.
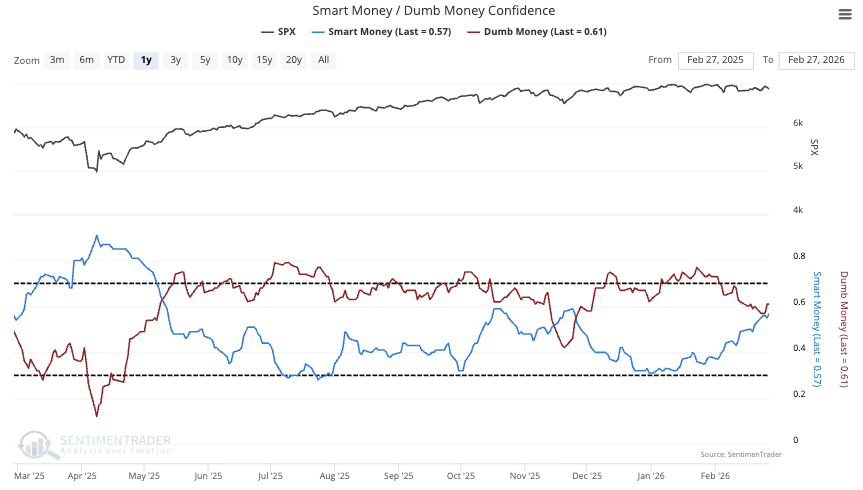
The biggest reason why dips should get bought is because Smart Money has been buying on every dip recently. Dumb Money just started to buy once again as well.
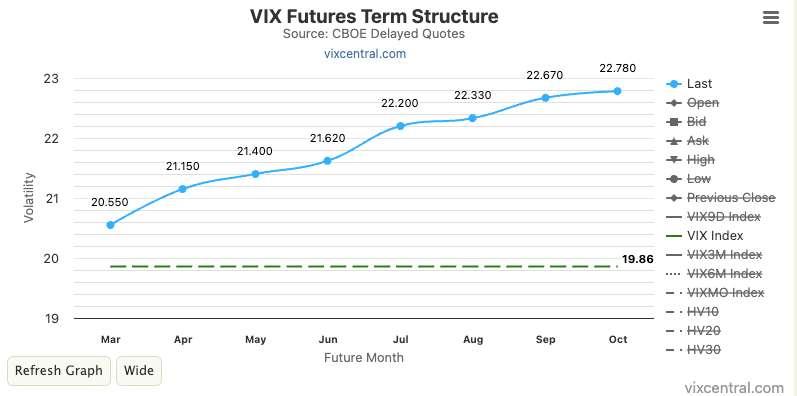
The VIX Term Structure is still upward sloping so no black swans are indicated yet. It’s possible that the attack on Iran is less impactful than we expect.
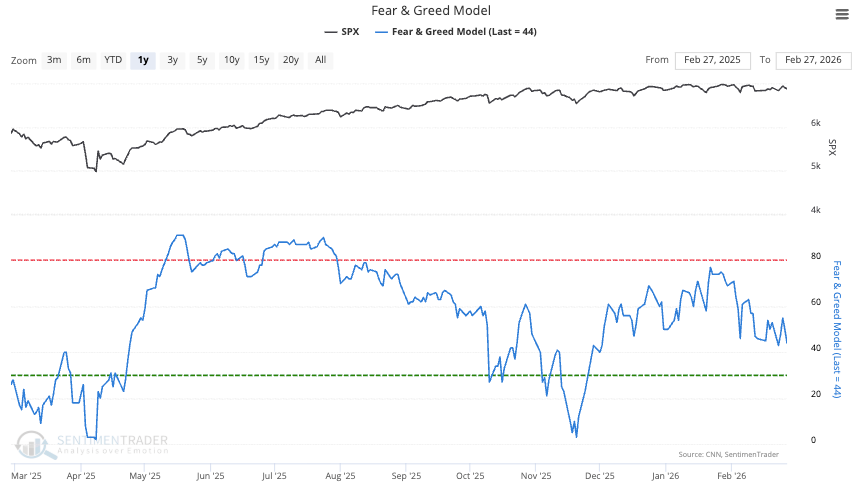
The Fear and Greed Model is still chopping in the middle of the range, displaying indecisiveness.
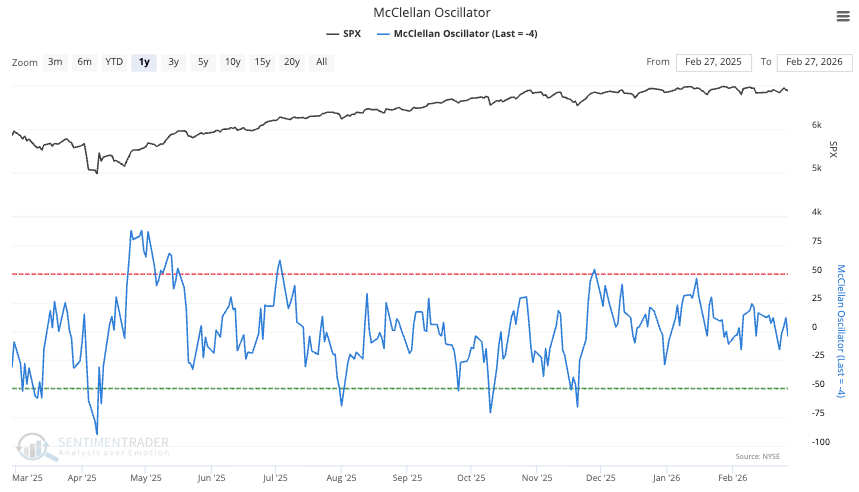
The McClellan Oscillator is similarly chopping in the middle of the range…
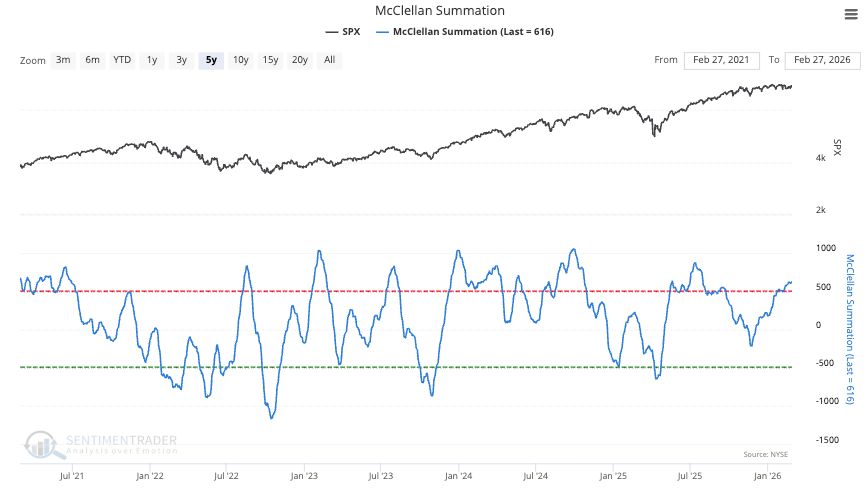
…however the McClellan Summation Index (longer-term breadth momentum indicator) is still up-trending. It is in the “overbought” area, but so long as it trends upwards, breadth is supportive of the market.
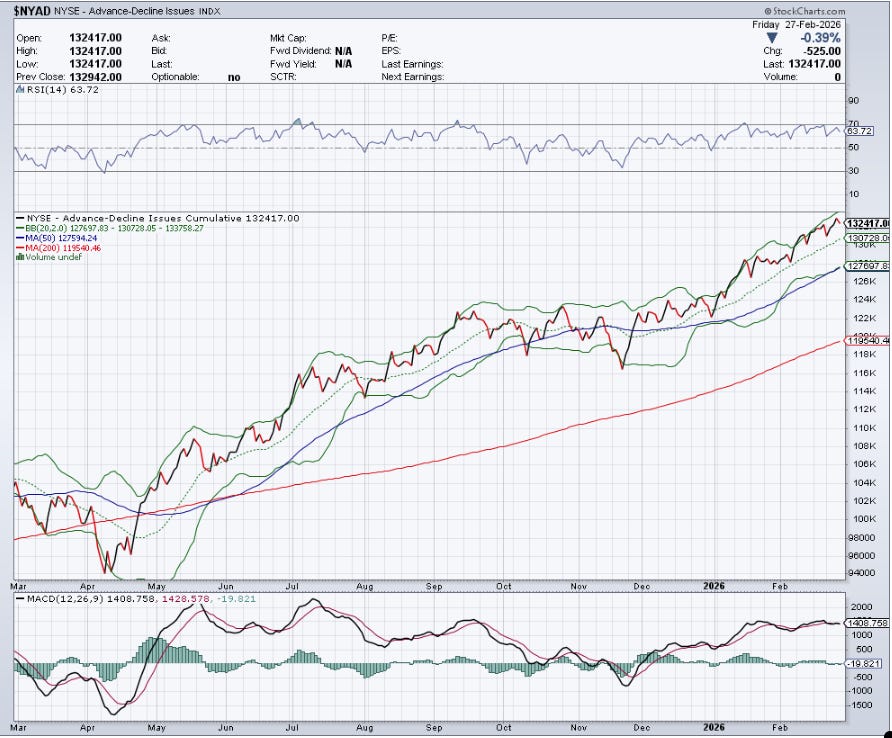
The NYSE Advance/Decline Line ($NYAD) is heading higher on the 20 SMA and is providing support to the broadening out rally thesis.
Geo-Political Drama Winners
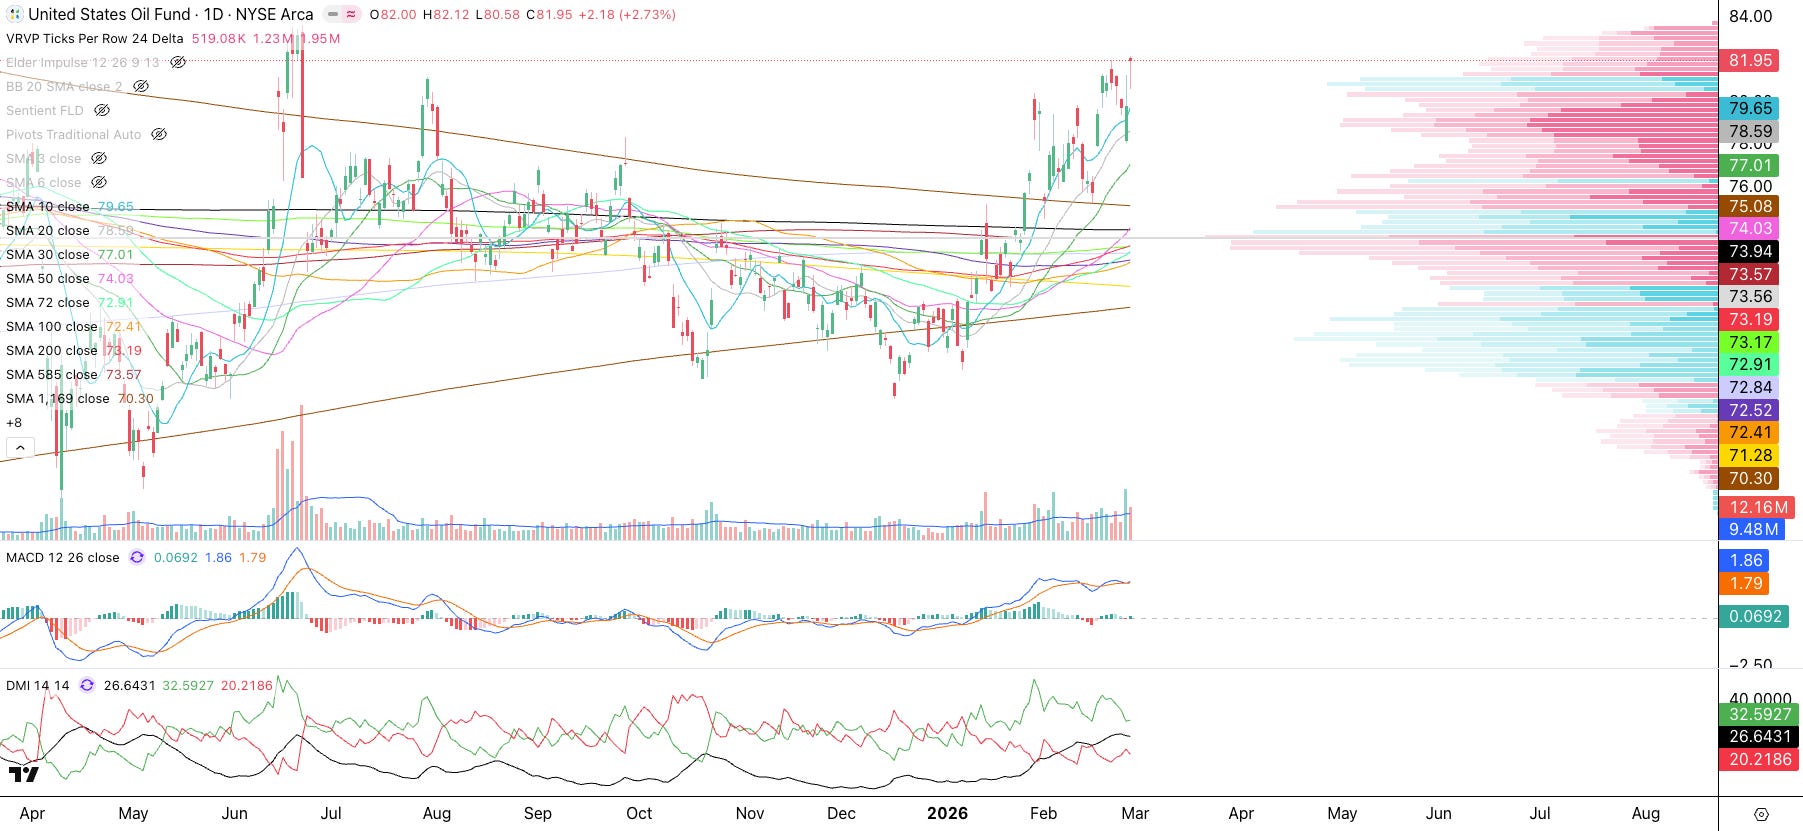
Oil (USO): Exogenous events in the Middle East are a positive catalyst for oil. Oil is above all moving averages, telling us it is in a bona-fide uptrend. It will probably spike on Monday morning.
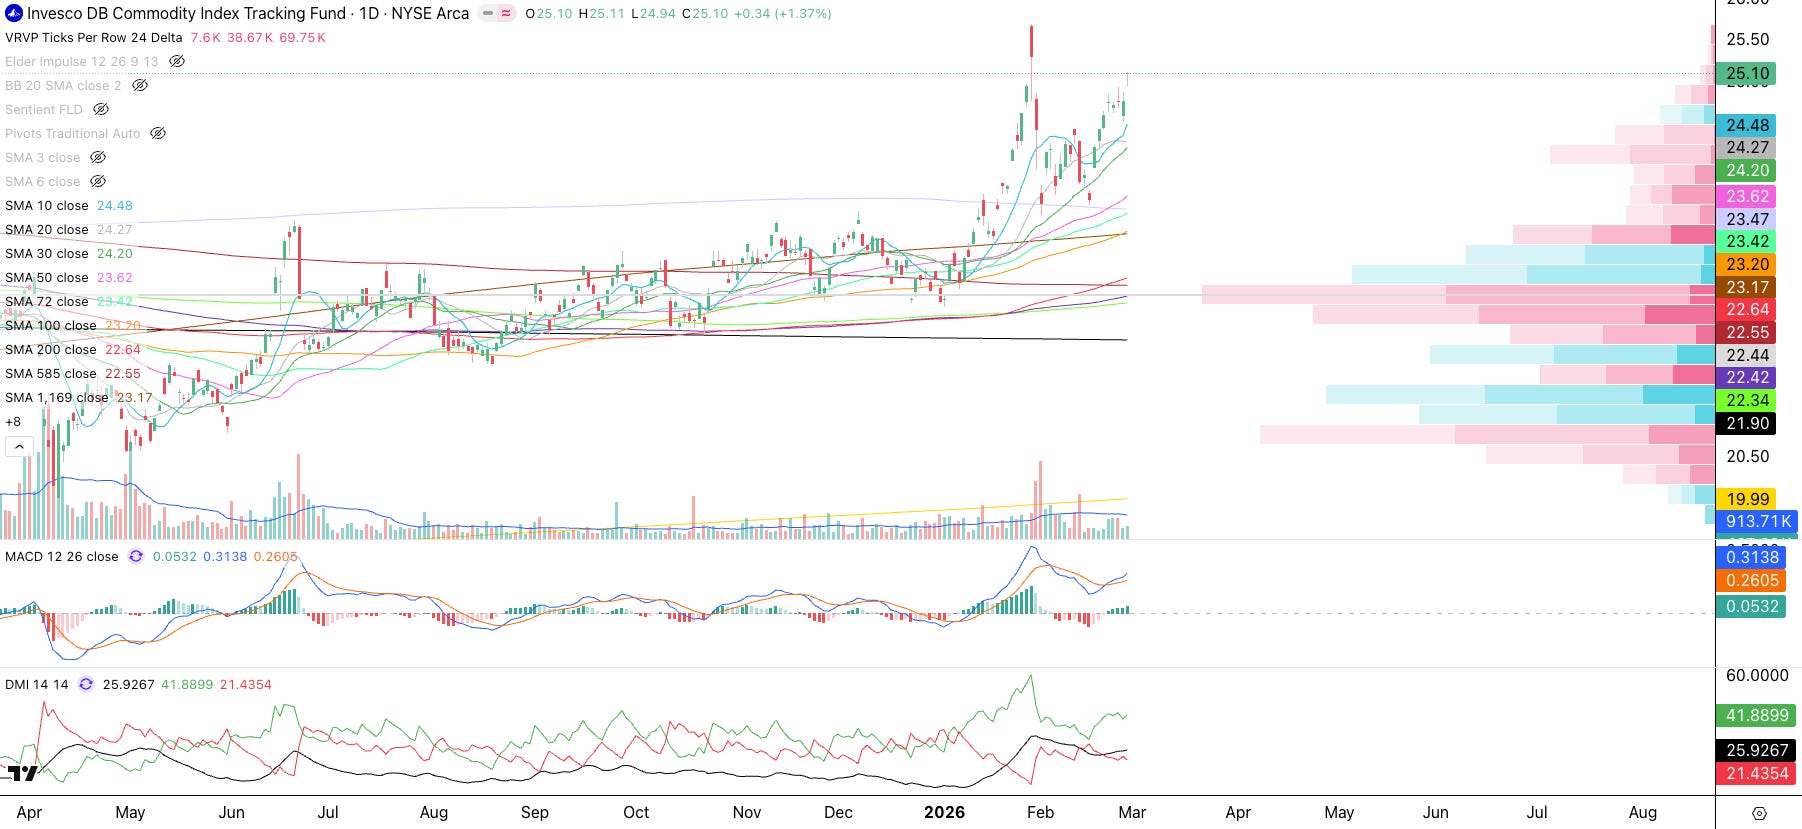
Commodities (DBC): The commodities index has a similar look, trending above all moving averages.
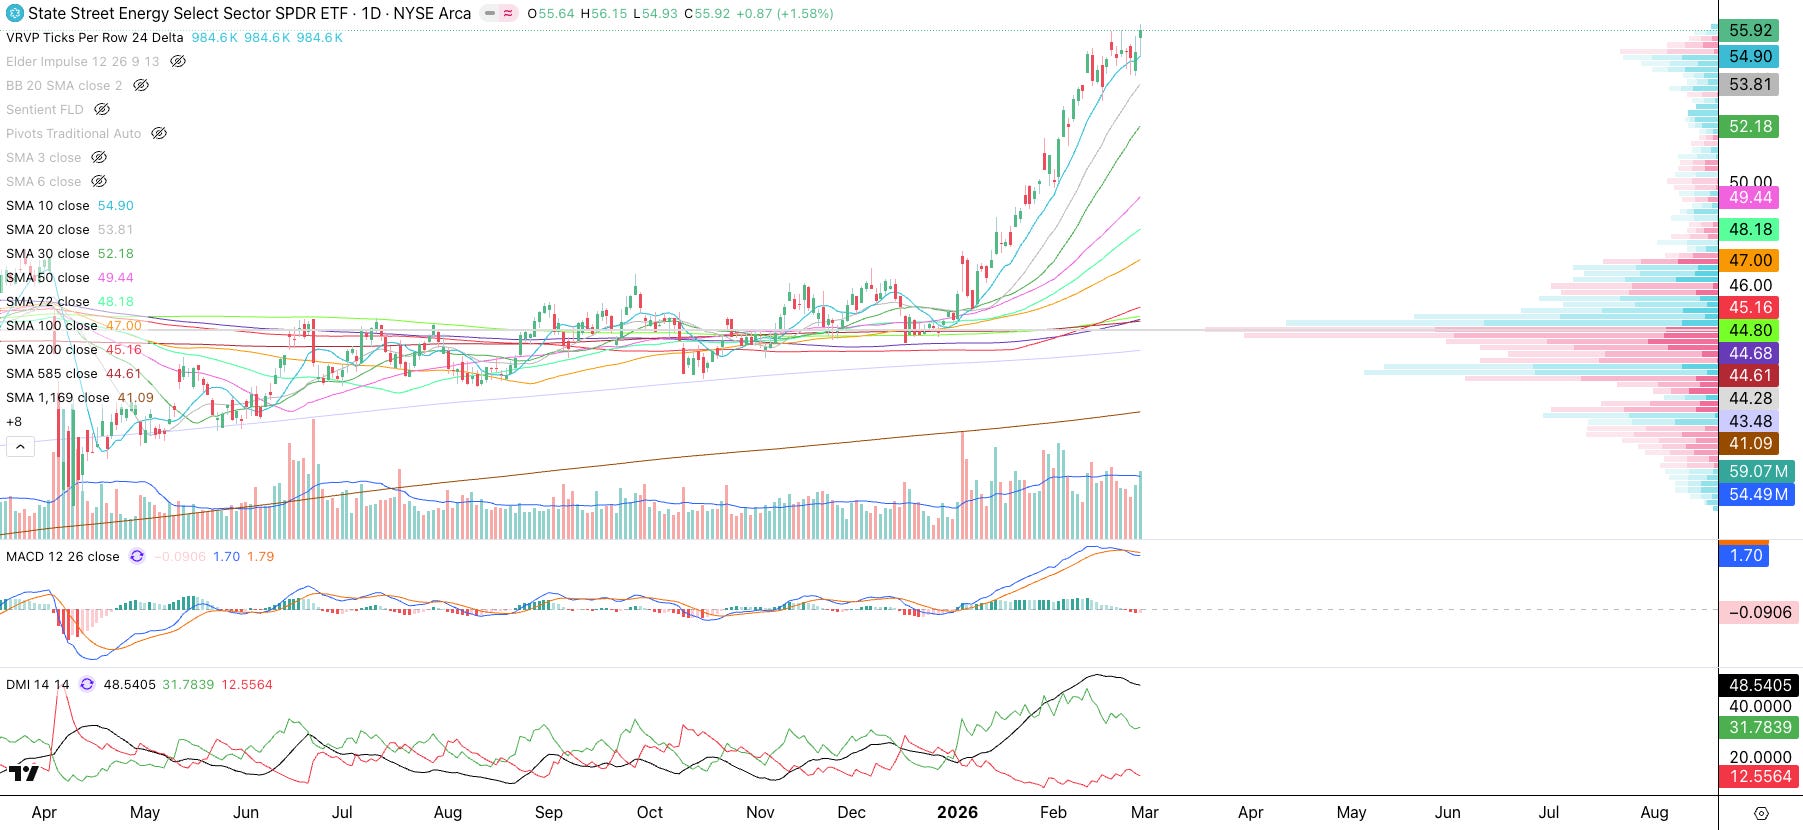
Energy (XLE): Energy is taking off above all moving averages. Notice how it was accumulated all of last year near the POC around $44. Wall Street is really in a profitable situation with this ETF.
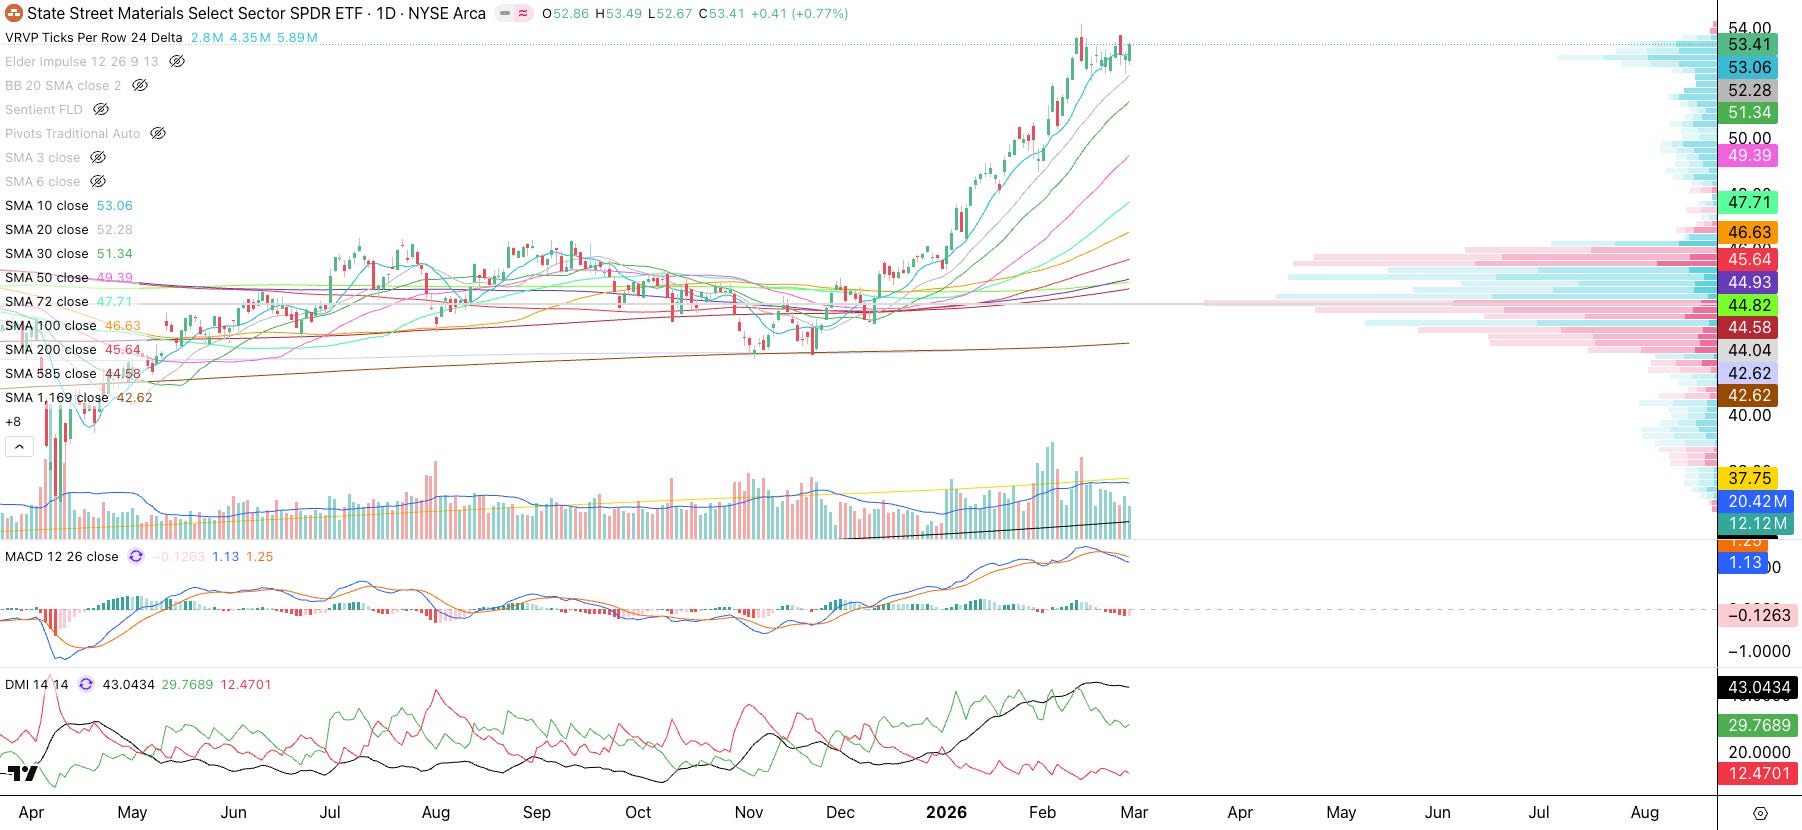
Materials (XLB): This is a similar look to XLE. Also notice how Wall Street accumulated XLB around the POC at $44 and is now in significant profits.
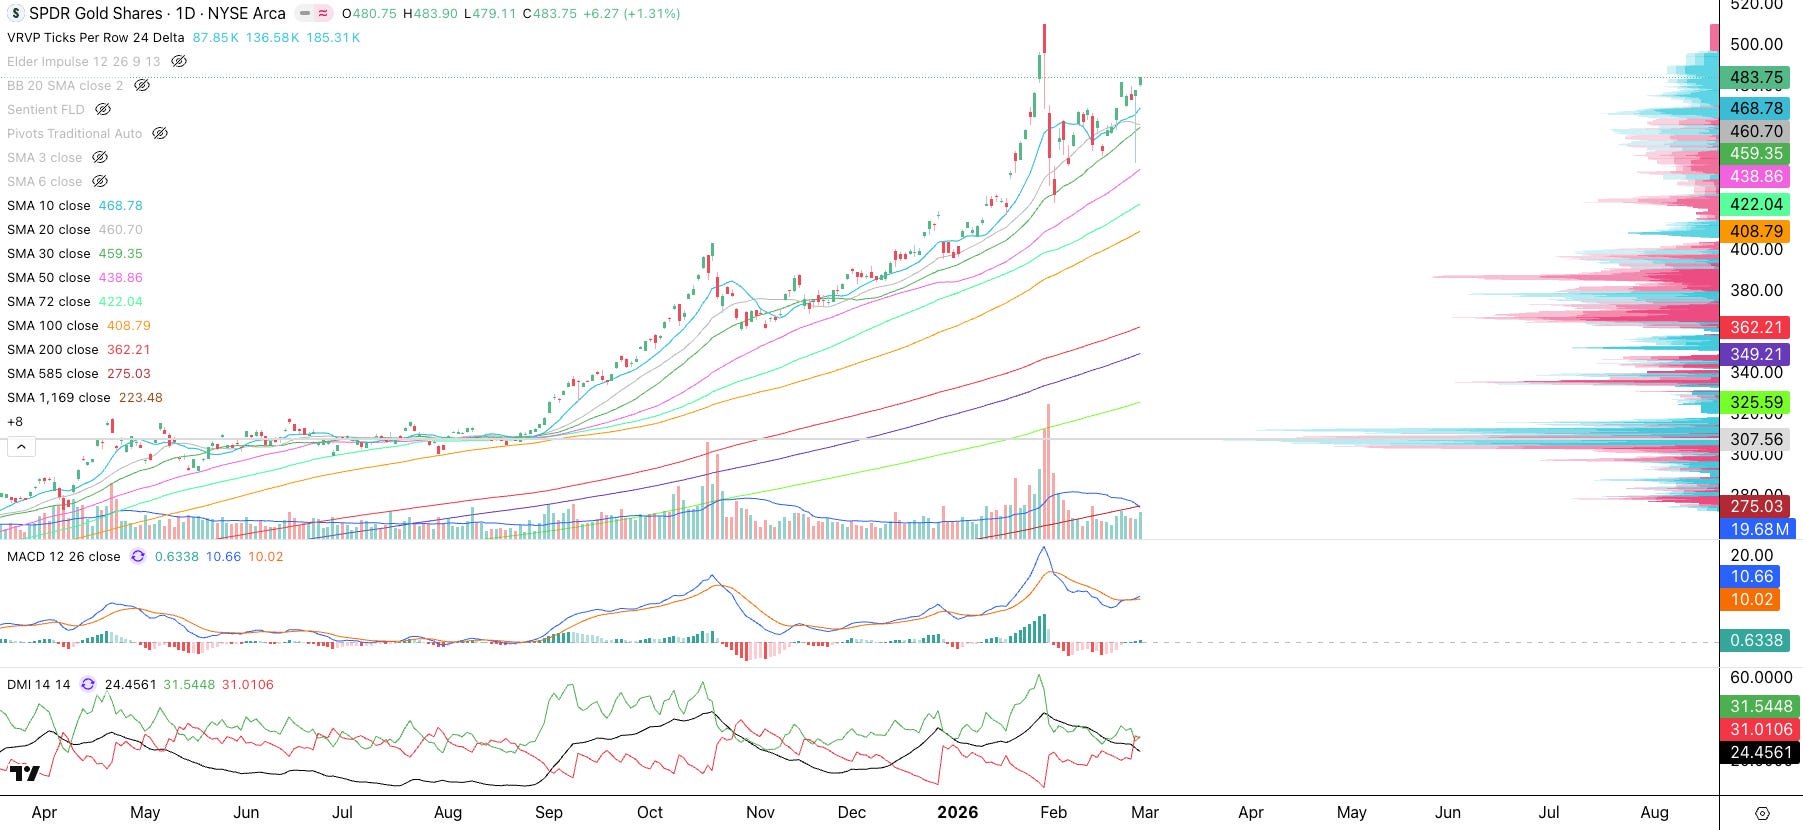
Gold (GLD): GLD continues to be in an uptrend, despite two recent pullbacks to the 30 SMA (green). The Iran event should push gold to test or exceed the highs.
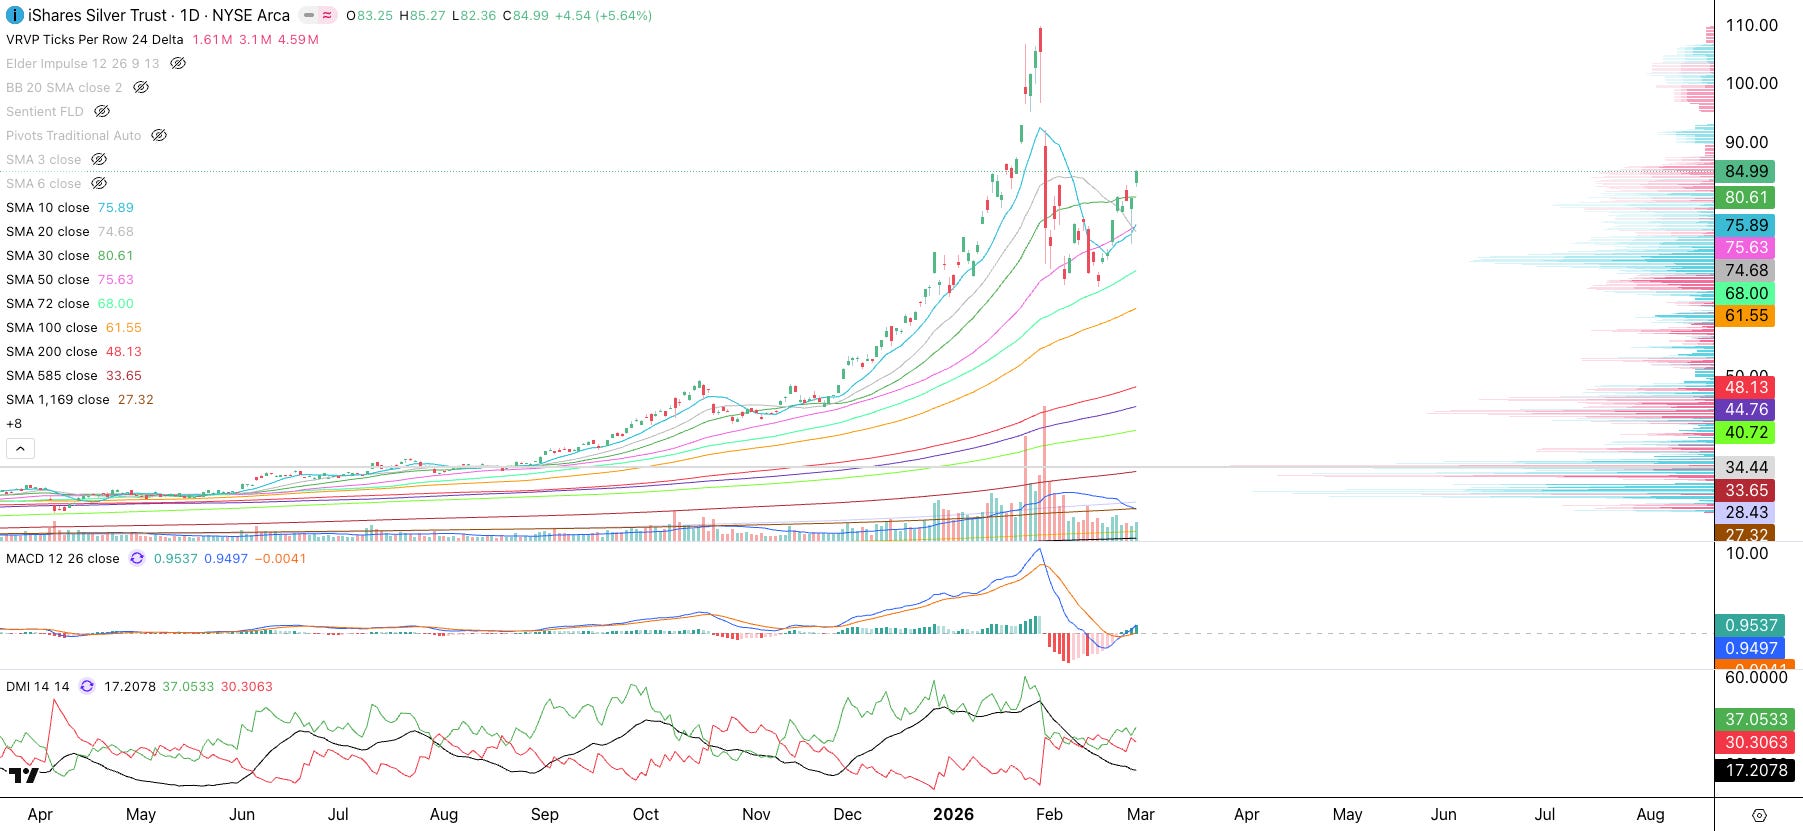
Silver (SLV): Silver had a deeper pullback as it tested the 72 SMA (mint). Nonetheless, it appears ready to test or break recent highs.
Disclaimer - All materials, information, and ideas from Cycles Edge are for educational purposes only and should not be considered Financial Advice. This blog may document actions done by the owners/writers of this blog, thus it should be assumed that positions are likely taken. If this is an issue, please discontinue reading. Cycles Edge takes no responsibility for possible losses, as markets can be volatile and unpredictable, leading to constantly changing opinions or forecasts.