

A Volatility Refresh
Premium Section: An Urgent Macro Warning

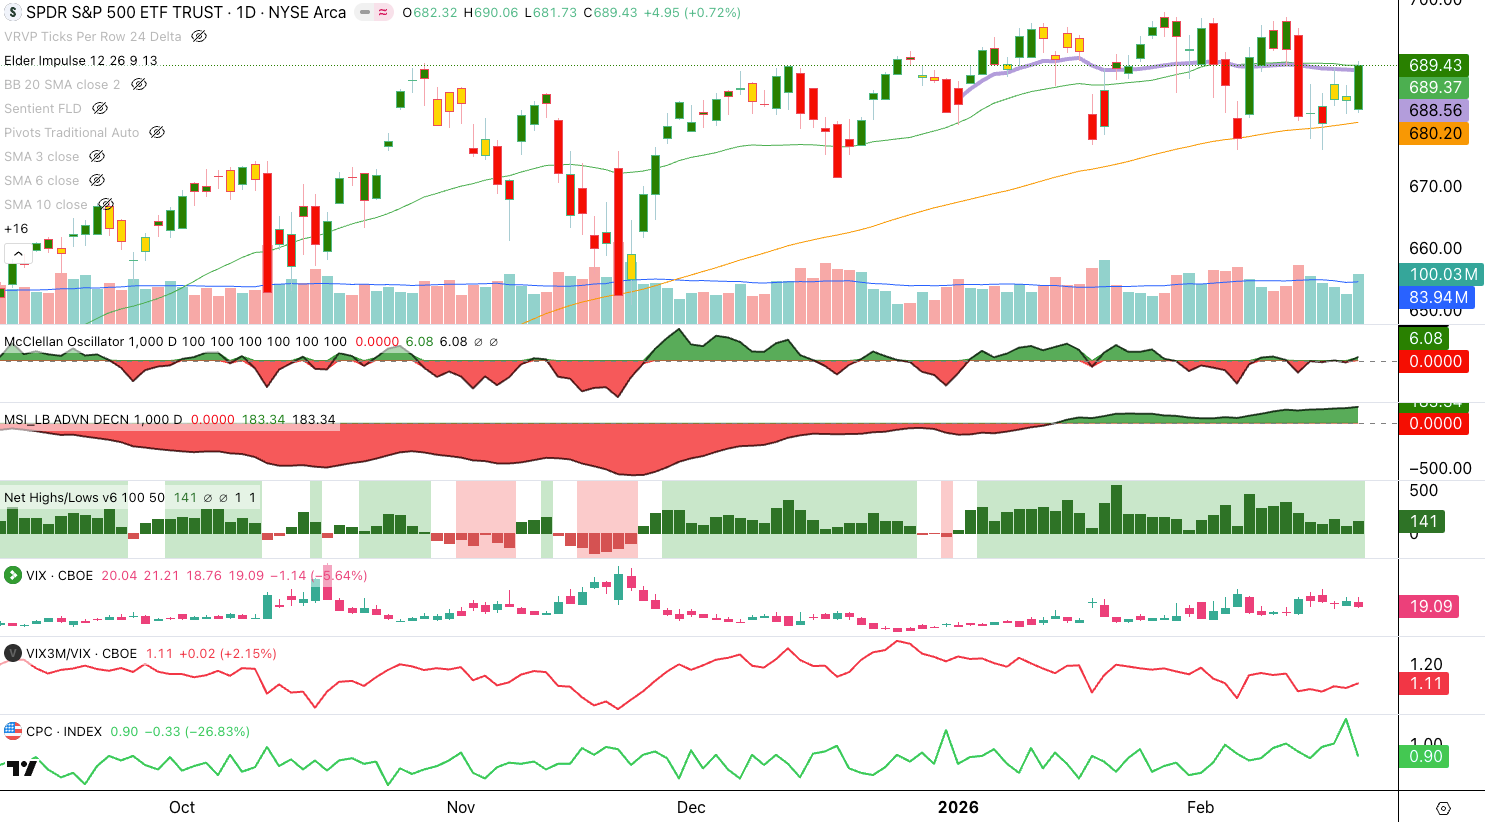
Last week the market feared the GDP Report, the Core PCE Report and the Supreme Court ruling on trump’s Tariffs, as the Volatility Index (VIX) stayed above the 20 mark for a few days. And after all that hoopla, the uptrend continues. The Volatility Index (VIX) may have just provided the Technical Fuel for a new leg higher.
Looking at the chart of the S&P 500 (SPY) below, we can see that as the VIX rolled over and closed below 20, SPY rallied on high volume and completed another successful bounce on the 100 SMA (orange). It closed above the YTD AVWAP (purple) but just below the 30 SMA (green), and a close above the 30 SMA would signal additional strength. The McClellan Oscillator and McClellan Summation Index both show that breadth is strong at the moment, and with Net New Highs remaining persistent, this continues to be a favorable environment for stock traders. The VIX Curve (VXV/VIX) is now in the oversold area, completing a bearish oscillation, and what likely comes next is another uptrend if the VIX Curve continues to trend higher. Finally, the Put/Call Ratio once again shows that when investors crowd into put options, the market often moves in the opposite direction. Overall, this technical picture points to the potential for a new leg higher.
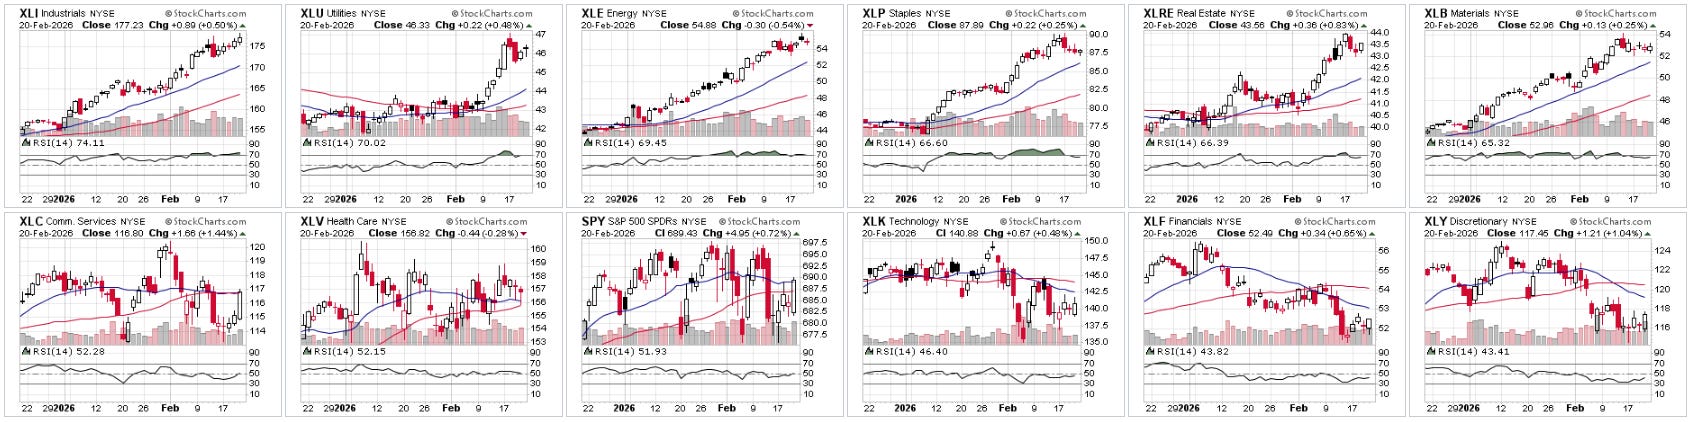
The StockCharts Sector CandleGlance page shows that Industrials (XLI), Utilities (XLU), Energy (XLE), Consumer Staples (XLP), Real Estate (XLRE), and Materials (XLB) are still leading. We are also seeing some new strength in Communications (XLC) and a possible setup in Healthcare (XLV), as price held the 20 SMA (blue) and 50 SMA (red).
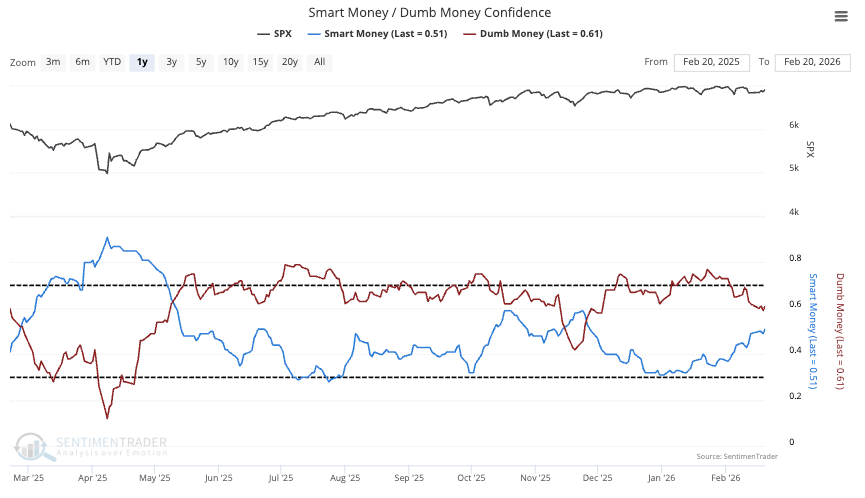
As expected, Smart Money bought the dip, and their buy limit orders provided a cushion for the downside price action that occurred this past week. As usual, Smart Money buys as Dumb Money sells. When Dumb Money joins Smart Money and resumes buying, the market will have much more fuel to move higher.
The Fear and Greed Model shows that a good amount of fear entered the market last week. With the aforementioned events now behind us, greed may reenter the market and push it higher.
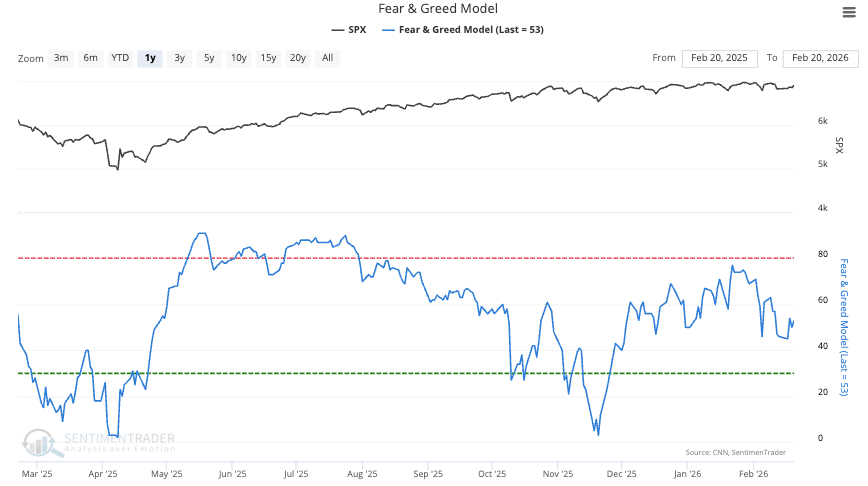
Similarly, with many money managers overly bearish and underinvested, it may bode well for the bulls.
Insight From the Cloud
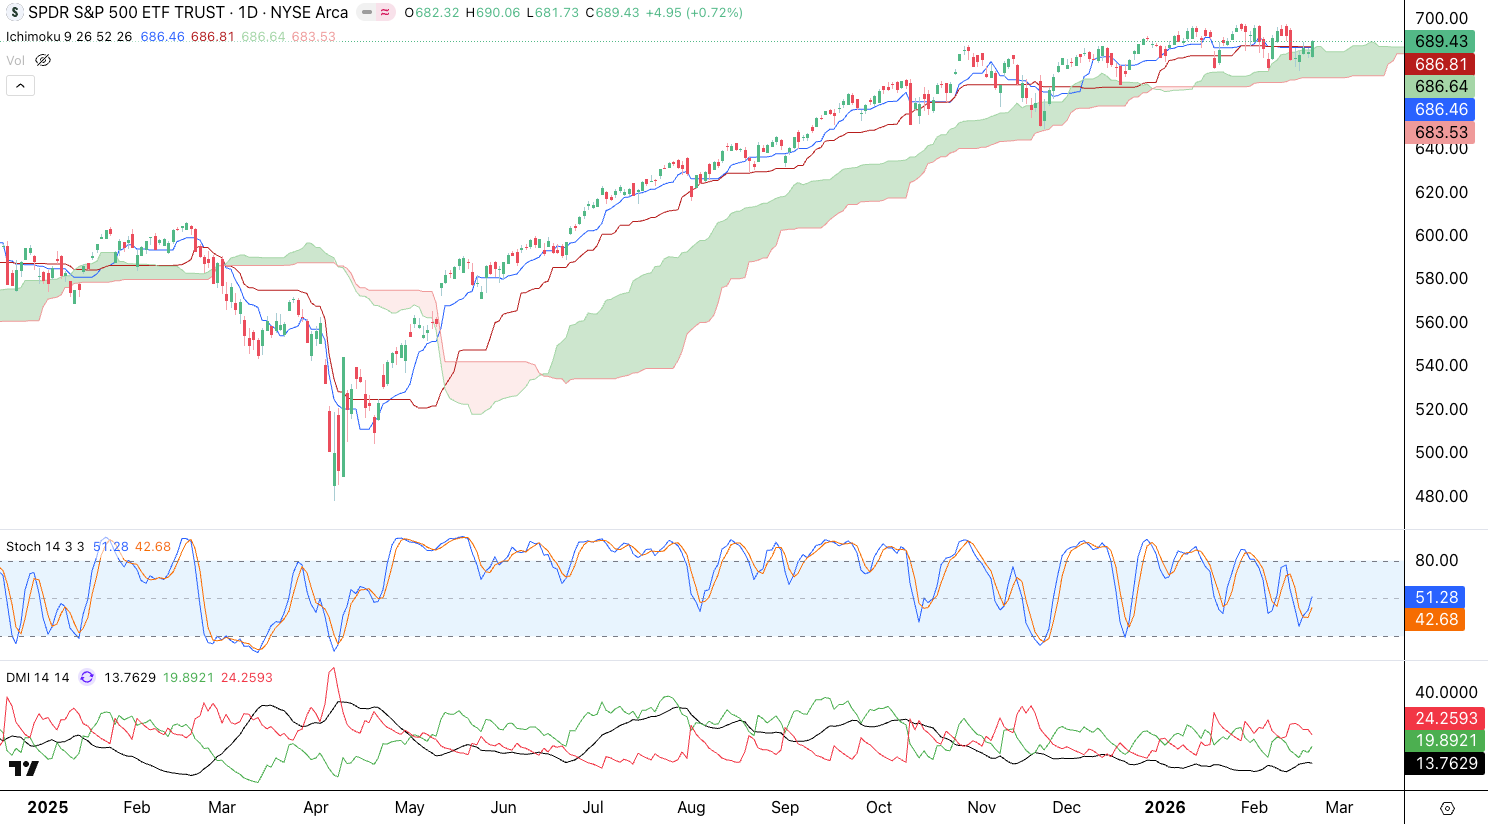
Now, I want to revisit the Ichimoku Cloud, which is an excellent tool for riding trends.
Instructions: The Ichimoku Cloud is a trend framework that shows direction, momentum, and key support or resistance in one view. The conversion line (blue) reflects short-term momentum, while the base line (red) tracks the medium-term trend and often acts as dynamic support or resistance. The Cloud (green/red) defines the broader trend regime and provides forward-looking support and resistance. Price above the Cloud signals bullish conditions, below signals bearish conditions, and inside suggests consolidation. Focus on price versus the Cloud for trend direction, the base line for trend health, and the conversion line for short-term momentum. We are also pairing this analysis with the Directional Movement Index or “DMI (https://www.investopedia.com/terms/d/dmi.asp).
The SPY keeps bouncing off the cloud and refuses to break down right now. Notice how it broke below the cloud in late February 2025 and trended below the base line (red) until the correction was over. Throughout May to October 2025 it held above the base line telling us the medium term trend was strong, however in November 2025 it began breaking the base line, telling us this uptrend is weakening and aging. For now, with the Stochastics making a bullish crossover, expect some upside, however the DMI is still showing a bearish trend, so it has work to do before confirming a new uptrend.
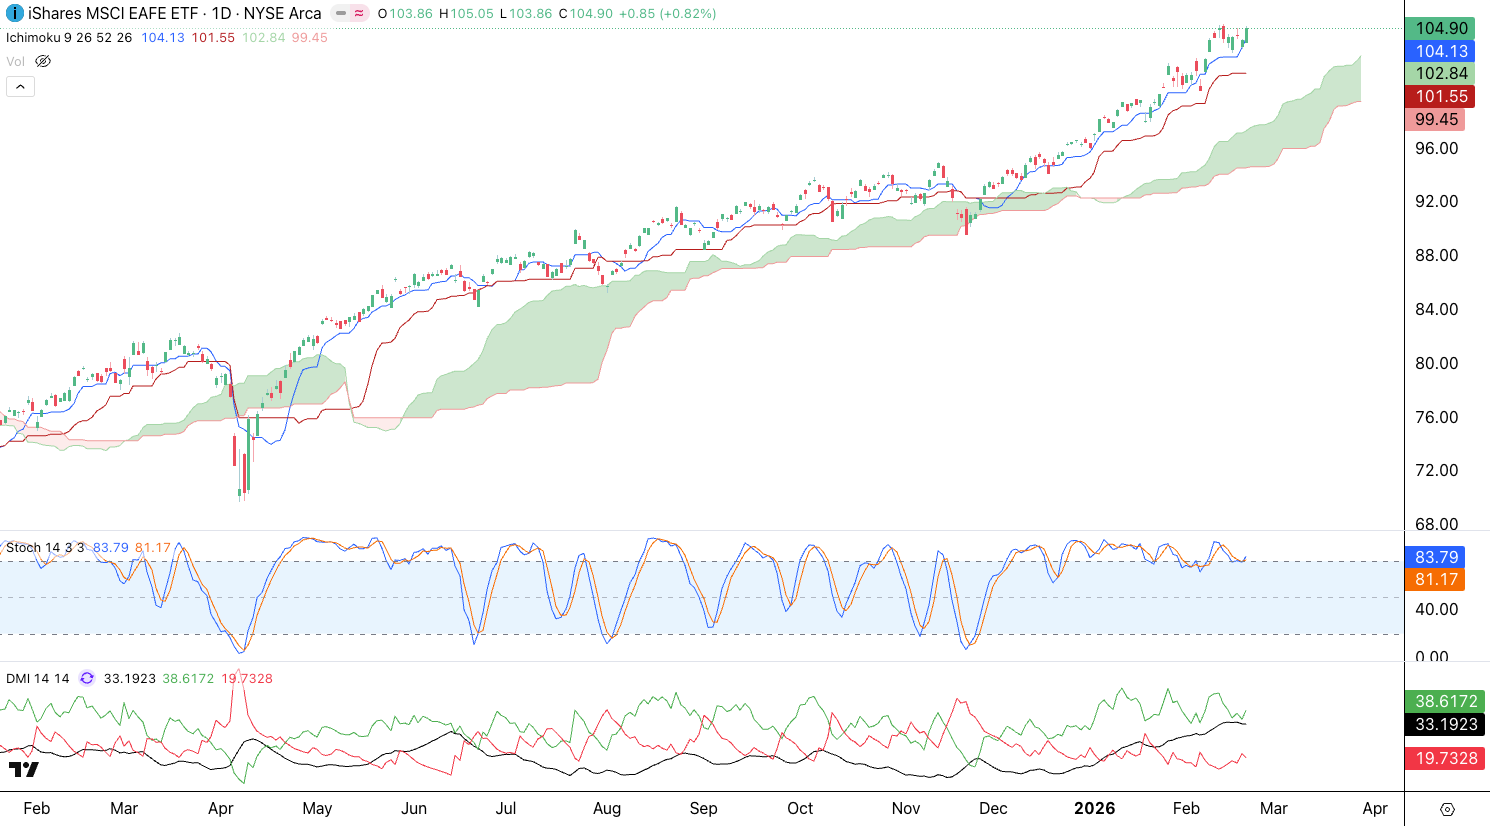
International Developed Markets (EFA), by comparison, is much more bullish. Instead of bouncing off the Cloud, it is extending from the conversion line. This is a winner an investor wants to own. Notice how the DMI is confirming a strong uptrend.
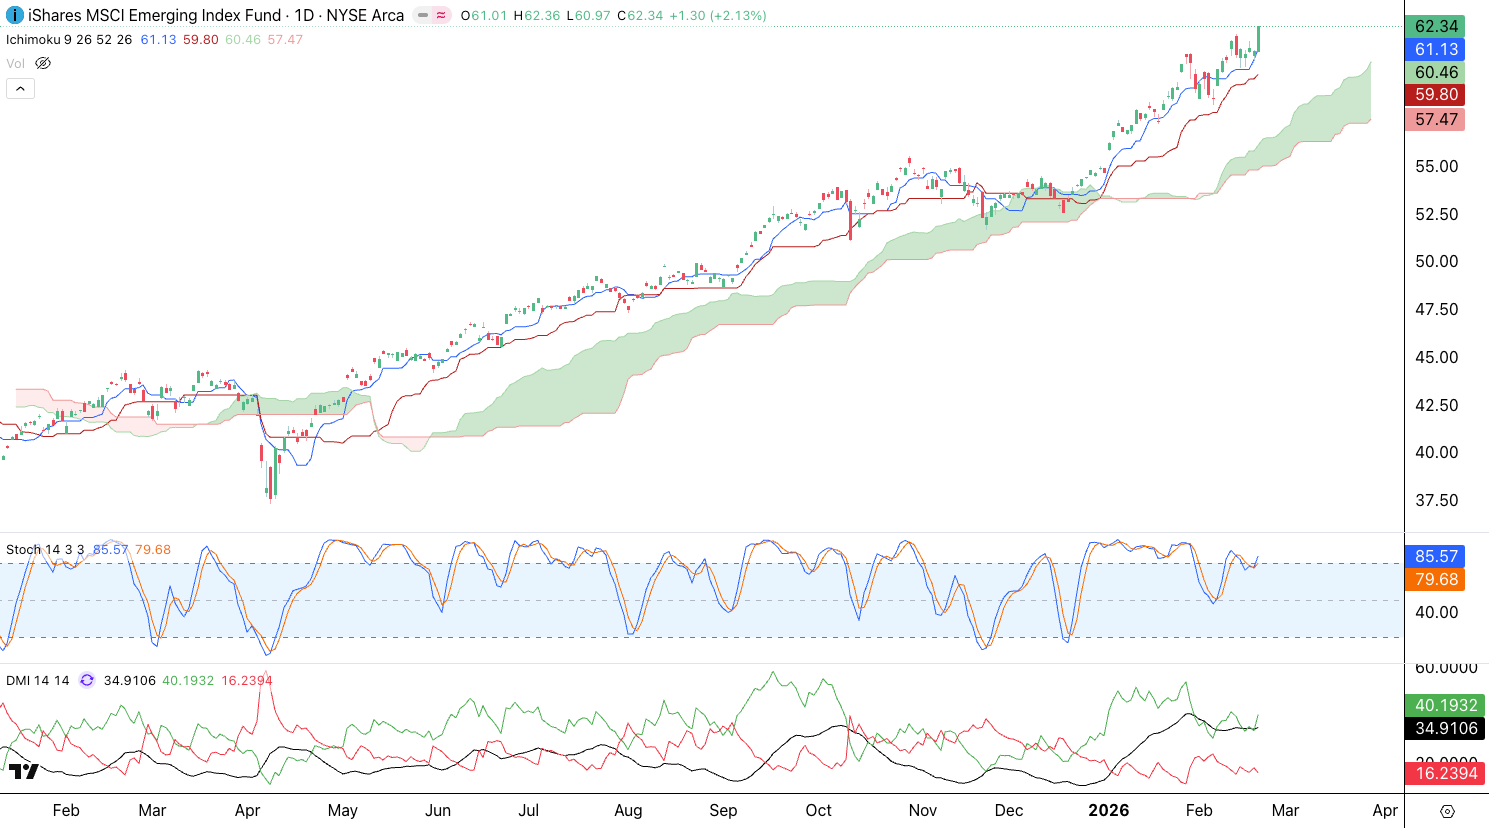
Emerging Markets (EEM) look just as strong. DMI is confirming the uptrend.
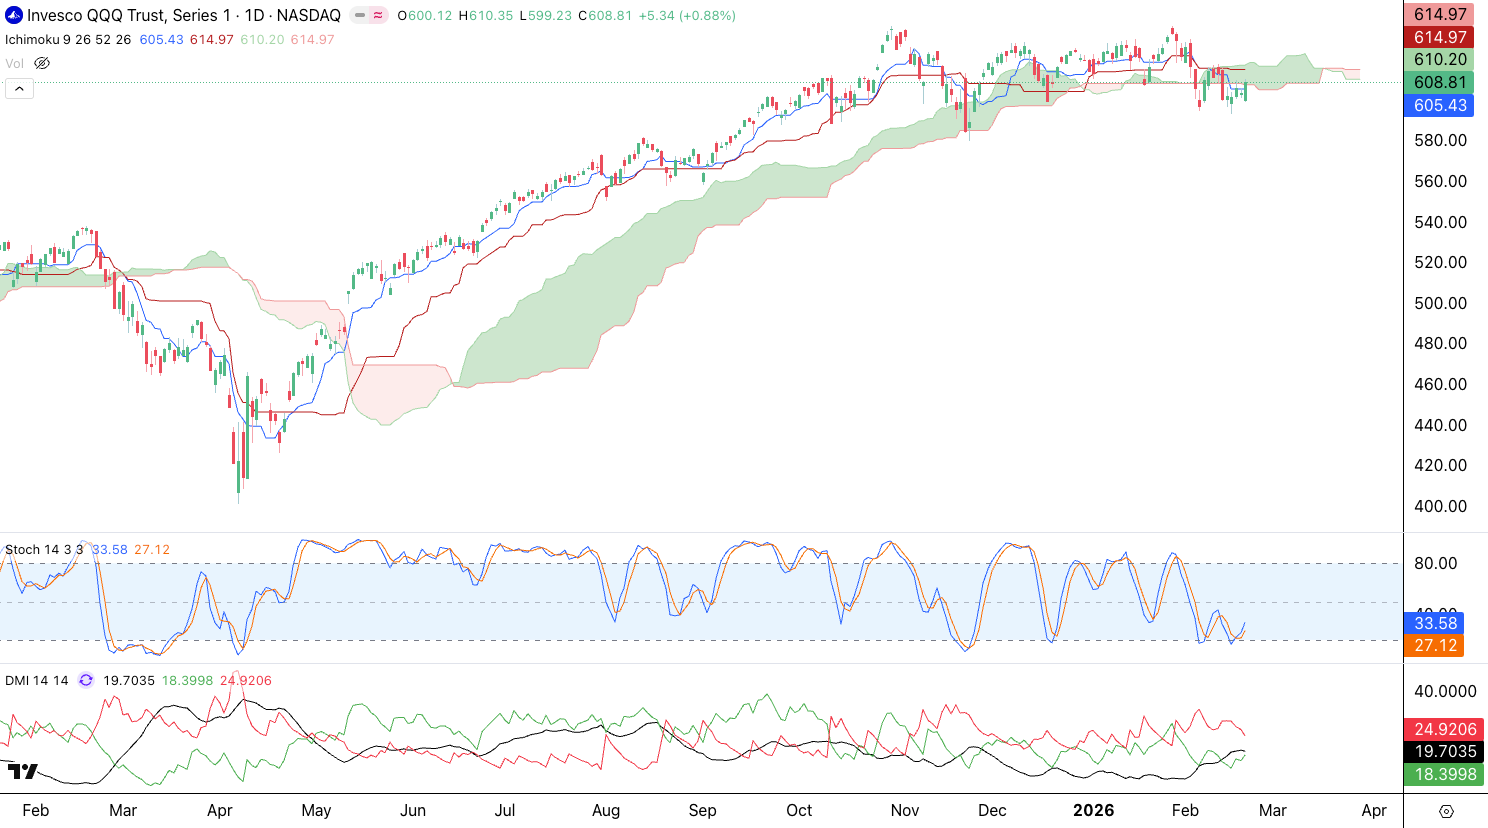
The Nasdaq 100 (QQQ) is showing relative weakness as it is trading below the cloud and the base line (red). QQQ is facing an uphill battle to reclaim the uptrend. Notice how the DMI is still in a downtrend.
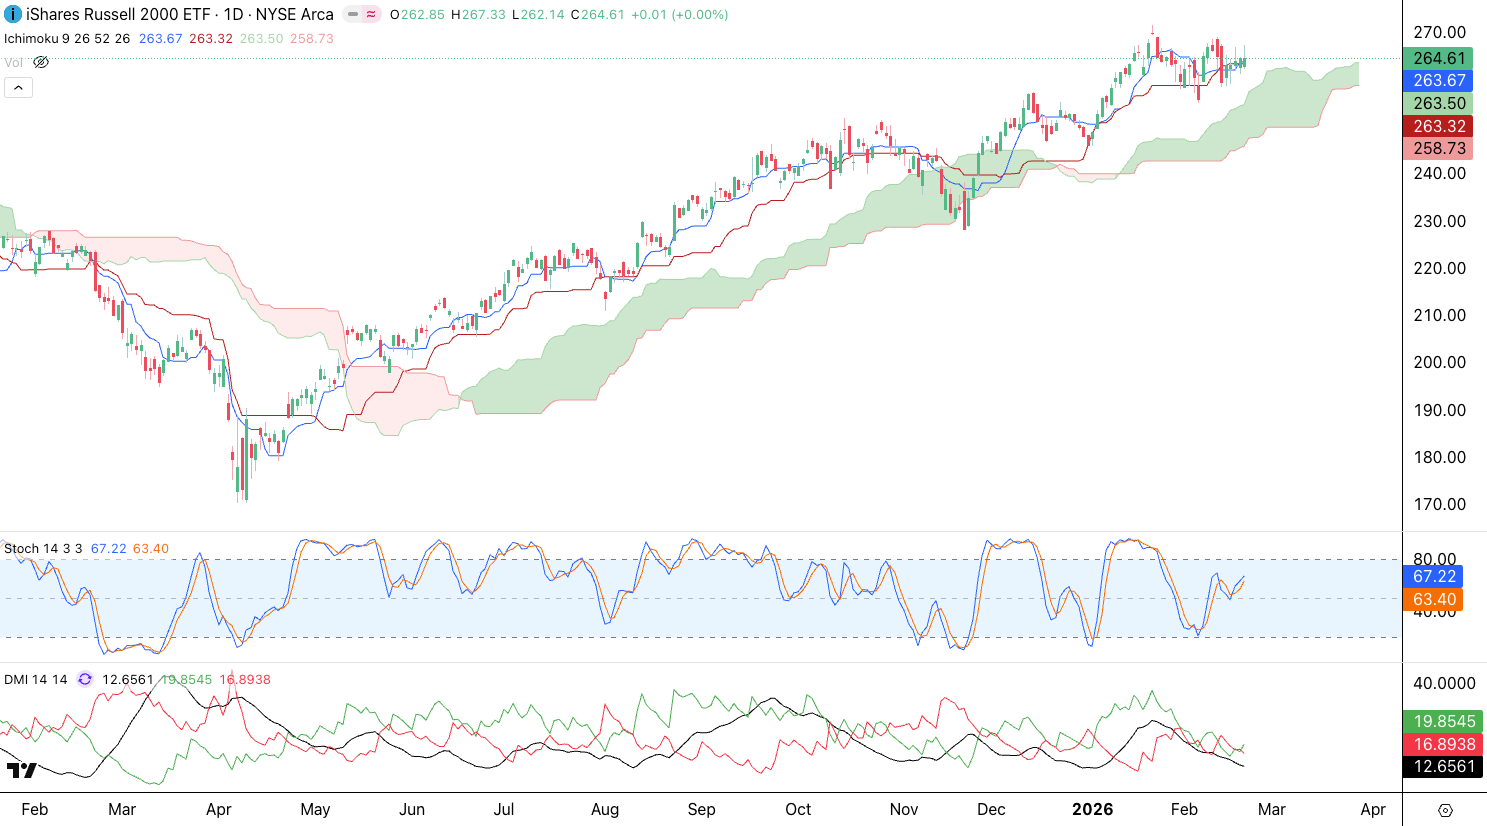
The Russell 2000 (IWM) is looking more bullish as its trading above the cloud, conversion line and base line. It looks ready for a pop next week. The DMI looks weak and confused, but leaning bullish.
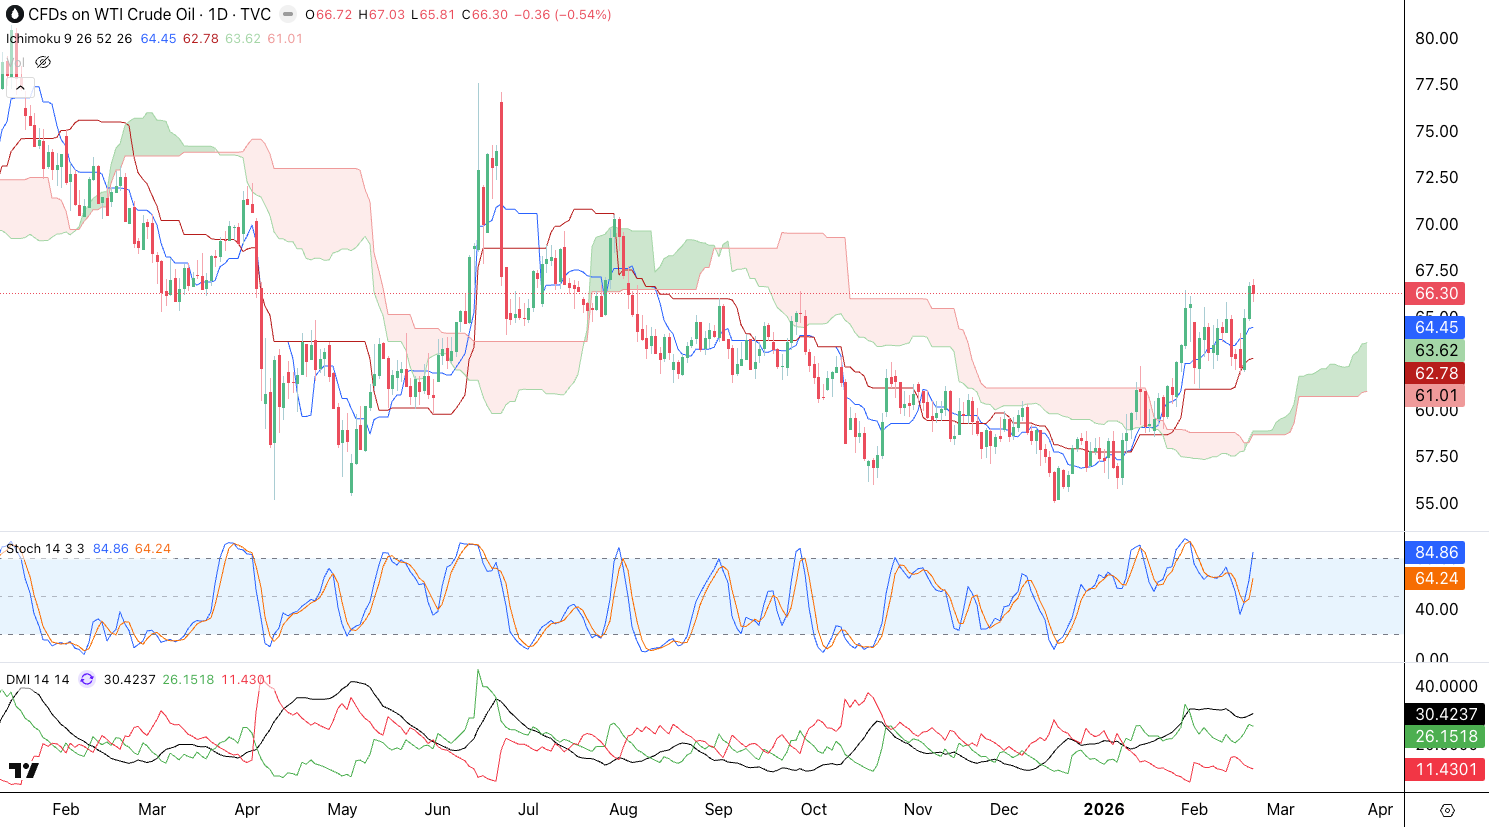
Oil appears to be starting a new uptrend as it broke above above and held above the cloud. It is currently above the conversion line and base line, leading us to believe that this trend is about to take-off. DMI is confirming an uptrend since early January.
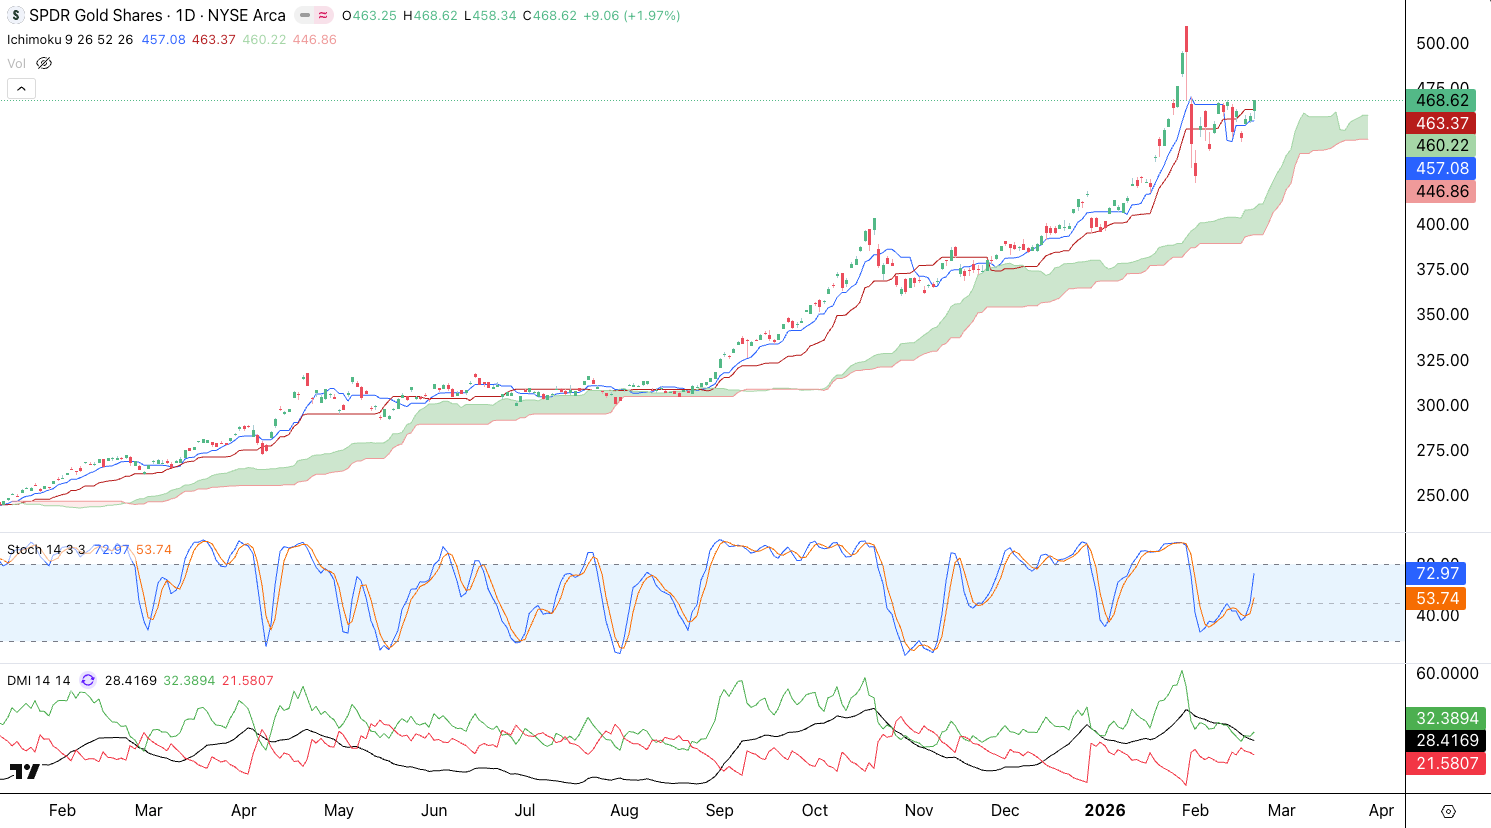
Gold (GLD) remains in an uptrend above the cloud. As it closed above the conversion line and base line, it may be ready for a new leg up. The DMI hints at a pullback within an uptrend.
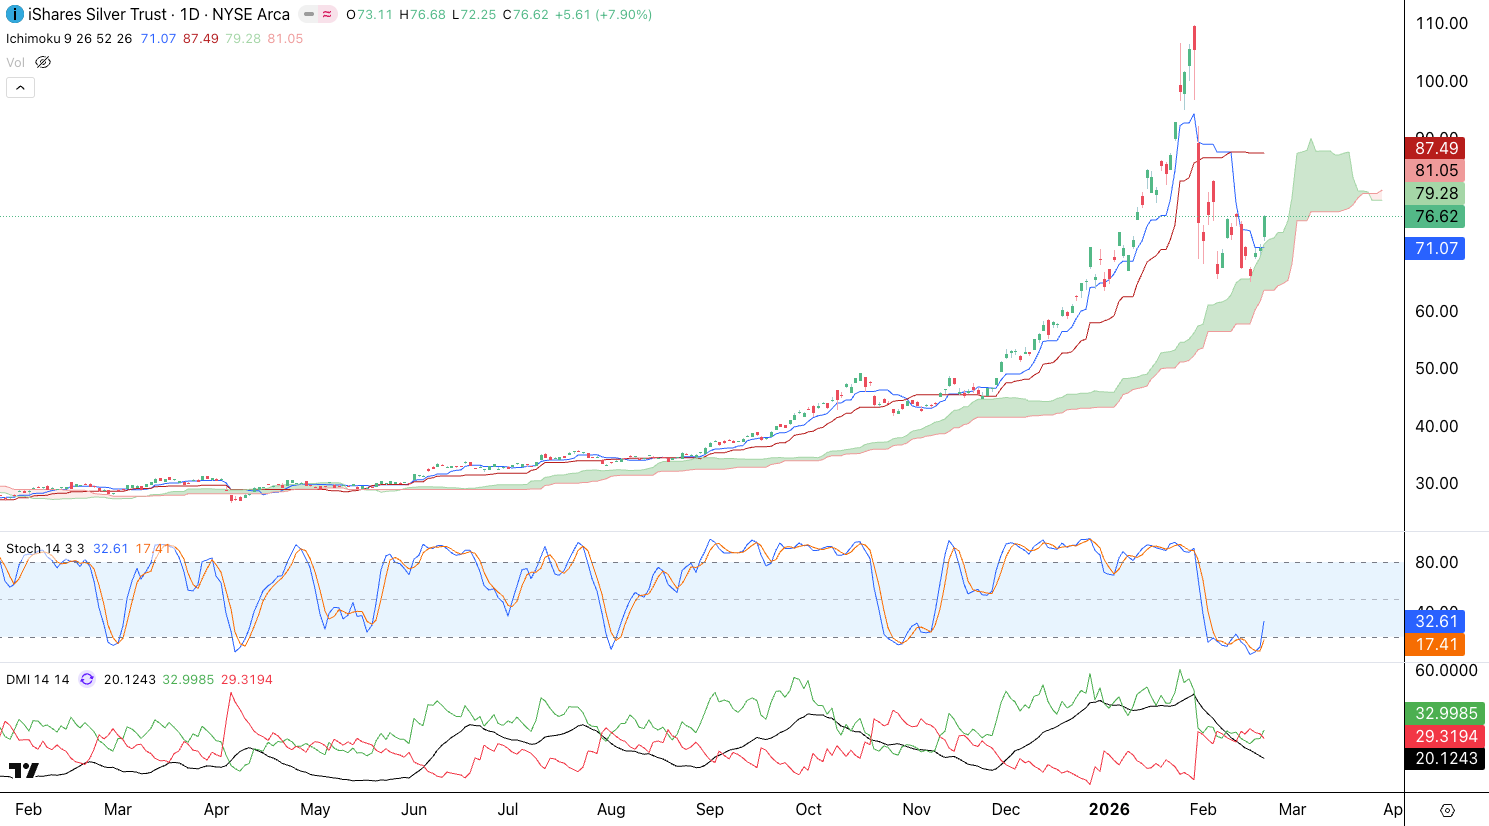
Silver (SLV) bounced off the cloud. The next resistance level is the base line around $87.49. The DMI tells us that the uptrend wants to restart.
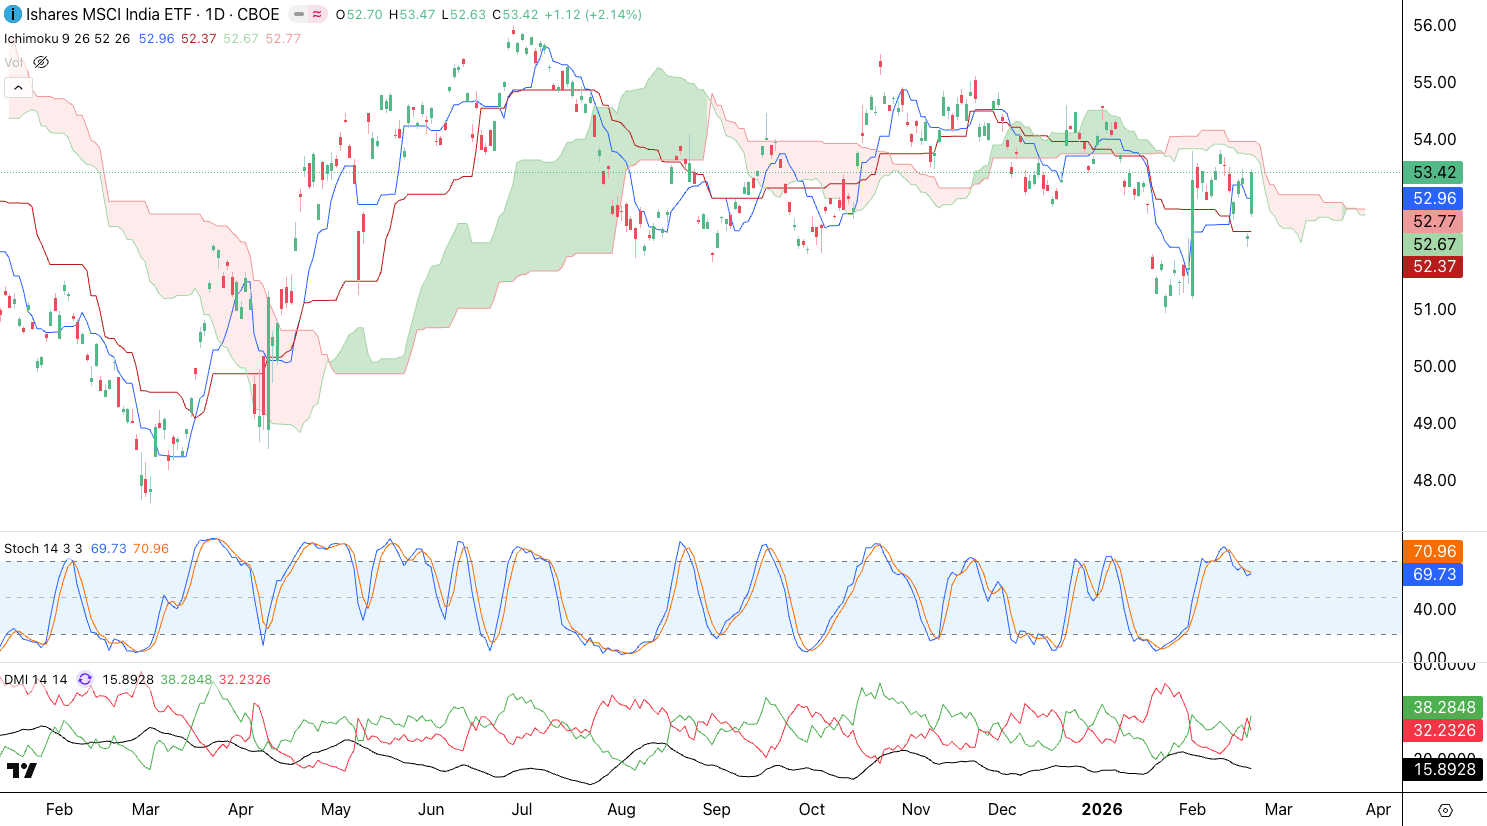
India (INDA) is below the cloud, but recent movement off the lows look very bullish. If it can get above and stay above the cloud, a new uptrend may be in store for INDA. DMI needs to confirm an uptrend.
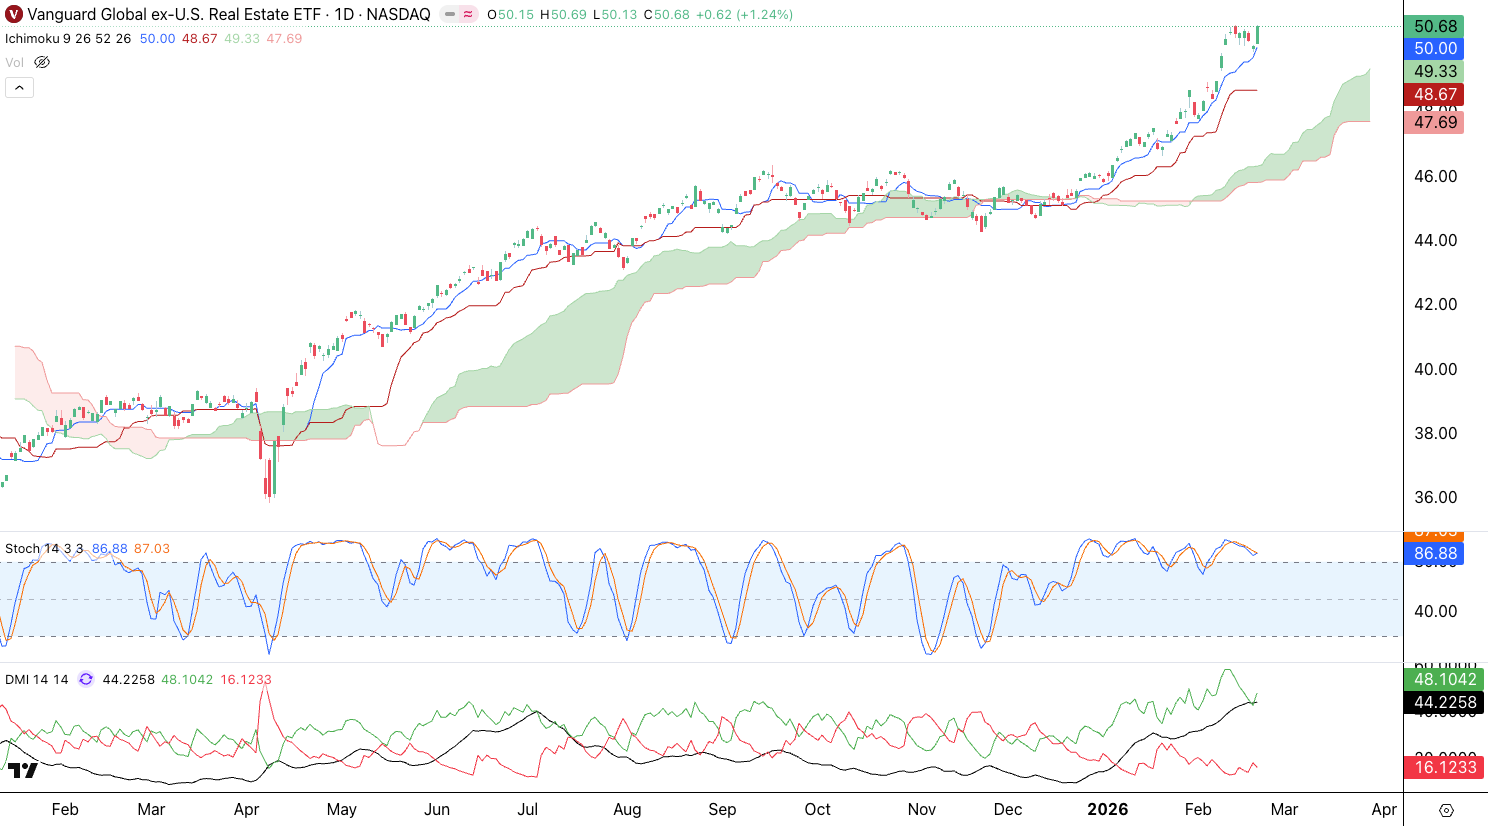
Global Real Estate (VNQI) is on a tear. The DMI tells us this is in a strong uptrend.
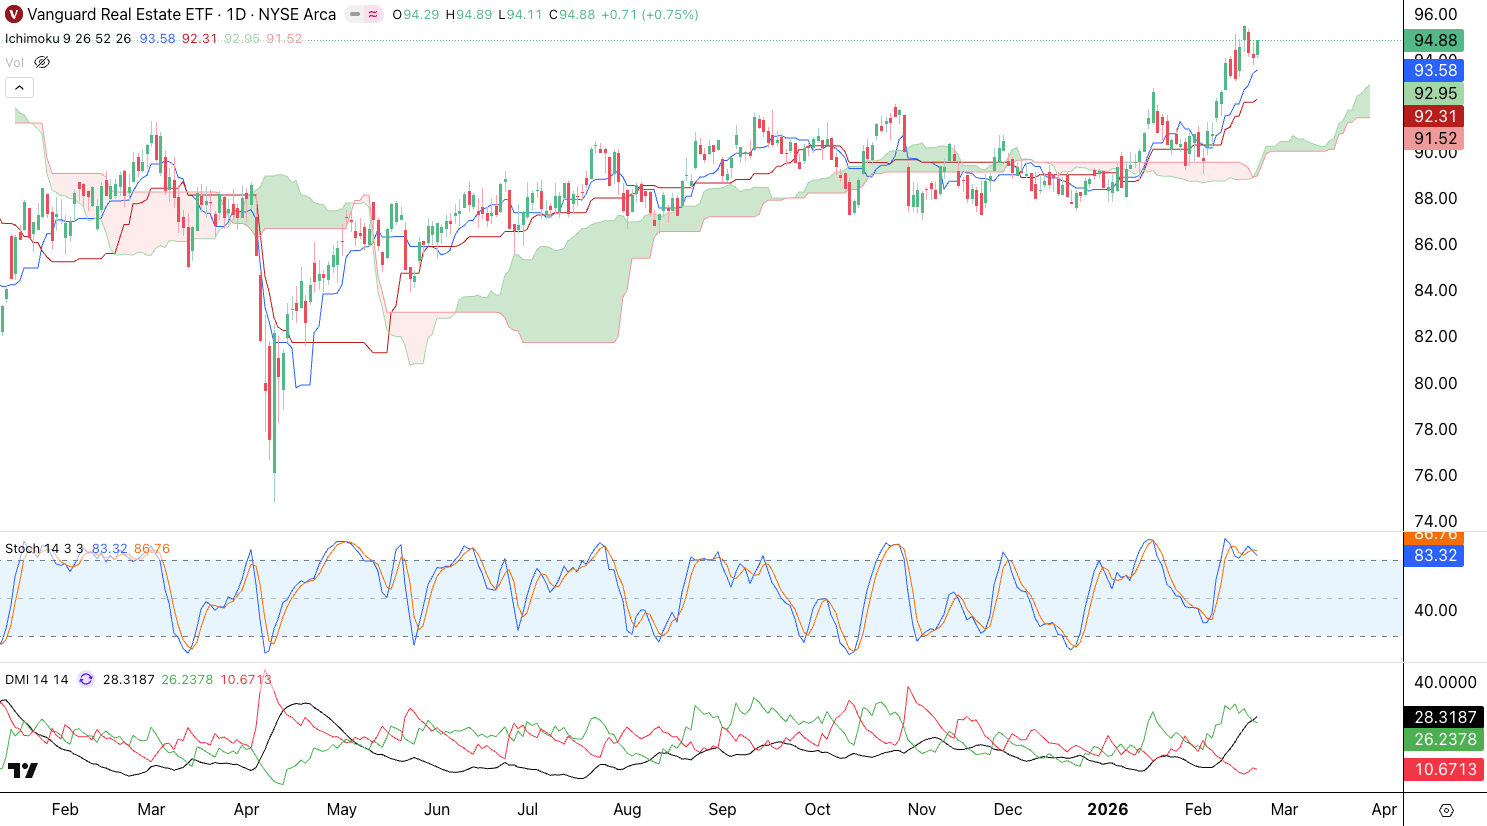
US Real Estate (VNQ) appears to be following suit with a new uptrend. DMI is confirming the uptrend.
We encourage you to use the Ichimoku Cloud to guide your investing, as it remains both effective and easy to apply. We expect leadership in the winning sectors and regions to continue. However, a notable macro warning emerged last week, which we will review in the Premium Section.
Disclaimer - All materials, information, and ideas from Cycles Edge are for educational purposes only and should not be considered Financial Advice. This blog may document actions done by the owners/writers of this blog, thus it should be assumed that positions are likely taken. If this is an issue, please discontinue reading. Cycles Edge takes no responsibility for possible losses, as markets can be volatile and unpredictable, leading to constantly changing opinions or forecasts.