Artificial Intelligence Leads the Market Higher
AI Provides the Fundamental Fuel for a Breakout
Last week the market looked like it was topping and ready to go lower. On Tuesday and Wednesday, it did go about 1.67% lower but hit support at the 26 Exponential Moving Average (EMA), and from there the S&P 500 hit new all-time highs. Despite all the negative signals in the market — divergences, seasonality, weak breadth, overly bullish sentiment — buyers stepped into the market on positive Artificial Intelligence (AI) news and lifted the stock market to higher levels. This is a good reminder that ONLY PRICE PAYS.
Referring to the chart above, the SPY uptick on Friday had many components. It was driven by positive news on AI-related stocks (we’ll discuss this in the next section). There were elements of a short squeeze, as bears assumed a double-top pattern would bring the market lower. Global Liquidity increased, providing a tailwind for risk assets. Net New Highs, which have been lacking recently, finally returned. The McClellan Oscillator, a short-term breadth oscillator, was oversold and reversed last week. The VIX dropped, while the VIX Curve reversed higher, signaling that an up move was coming. Sentiment did become overly bullish quickly, as the put/call ratio (CPC) indicates a flood of call buying. It appears that the uptrend is poised to continue, however a pullback is possible to work off overly bullish sentiment.
Macro vs. Fundamentals: Economics vs. Excitement
Last Monday, January 8th, Federal Reserve Governor Michelle Bowman indicated that interest rate hikes are likely over, but she said she’s not ready to start cutting yet.
On Tuesday, January 16th, Fed Gov. Christopher Waller, said that the Fed should cut rates methodically and carefully and should not rush the process.
On Wednesday, January 17th, Atlanta Fed President Raphael Bostic said he sees rate cuts starting in the third quarter — quite different than a March 20th cut that Wall Street is expecting.
The probability of a rate cut in the March 20th FOMC meeting dropped from 77% a week ago to 46% now. This concern that rate cut expectations were overblown dropped the market on Tuesday and Wednesday.
On Thursday, January 18th, Taiwan Semiconductor Manufacturing Company (TSMC) issued an upbeat annual forecast, saying that the AI boom will provide healthy growth this year. This challenges the assumed refutes the expectation of a rough year for chipmakers driven by adverse global macroeconomic conditions and an inventory adjustment cycle. Daniel Newman, Analyst from Futurum Research said on CNBC that there is an insatiable appetite for low-power, high-performing chips that are going to enable AI on devices.
On Friday, January 19th, META indicated that they are spending billions on Nvidia’s AI semiconductor chips to invest in META’s own AI plans. He noted the company’s AI infrastructure will include 350,000 H100 graphics cards from Nvidia by year-end.
And that sums up what’s on the Market’s Mind. On one hand, there are economic concerns that interest rate cut assumptions have been too optimistic and on the other hand there is massive excitement that the Artificial Intelligence boom is heating up, providing Fundamental Fuel for the markets. Right now the excitement is winning!
Technical Analysis: Breakouts Galore!
The S&P 500 (SPY) is breaking out, but there is a chance for a “Holy Grail” play, which is to buy on the retest of the breakout point. One could buy on a retest of the daily breakout level of $477.55 (upper chart) or the weekly breakout level of $479 (lower chart). A reasonable stop loss level would be the 12 EMA at $475. An initial target is the weekly chart’s R1 Pivot Point at $505.19.
The S&P 500 usually does have positive seasonality starting at the end of January until the middle of February.
The Nasdaq 100 (QQQ) is also breaking out and one could also buy on a retest of the breakout point on the daily chart of $413. Given the relative strength of technology, a pullback to the weekly breakout point of $409 is less likely. One could buy and set a stop loss order below the 12 EMA around $409. A reasonable target is the R2 Pivot Point on the weekly chart at $455.
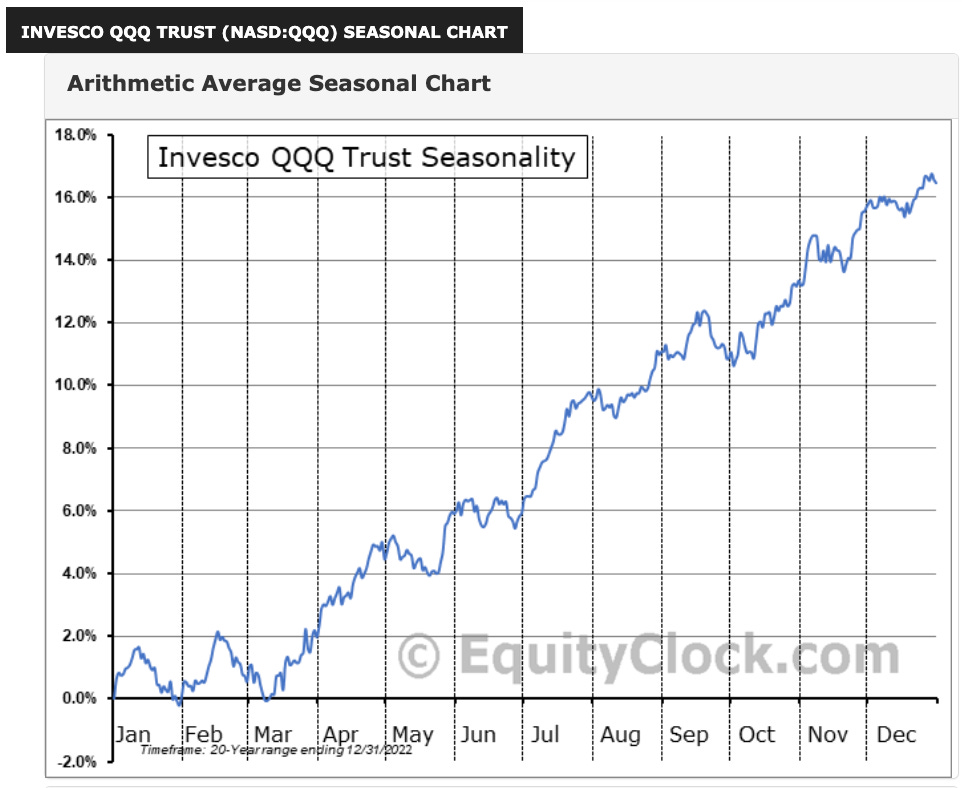
QQQ also has positive seasonality from the end of January to the middle of February. Note that this probably came early due to the positive technology news. Furthermore, positive industry trends could continue and could override any weak seasonality. We’ll have to keep an eye on this.
Semiconductors (SMH) are the leading industry right now and if the trend continues, SMH will have significant relative strength. A pullback to the breakout point is not probable. A pullback close to Friday’s low around $181.42 may be the best entry we get. A stop loss order set under the 12 EMA around $176 is suggested. A reasonable price target is the R2 Pivot Point on the weekly chart at $198.
Similar to QQQ, SMH has positive seasonality from the end of January until the middle of February, however recent news seems to have accelerated this timeline. Fundamental fuel from AI, a budding new growth industry, could power this ETF higher even in the face of weak seasonality.
Technology (XLK) is also a viable ETF investment at the moment and similar to SMH, buying on a pullback to Friday’s low around $196.51 could be a good entry point. A stop-loss order could be set under the 12 EMA at around $192. A reasonable near-term price target is the R2 Pivot Point on the weekly chart at $214.
Seasonality for XLK also turns positive from the end of January until the middle of February. Strong industry dynamics could power this ETF forward, even during weak seasonal times.
Market Internals: A Narrow Rally
The McClellan Oscillator, a shorter-term breadth oscillator, did give hints that the market was oversold. According to this indicator, the uptrend that re-started on Thursday could last for a while.
However, the McClellan Summation Index, a longer-term breadth indicator, is showing that breadth is on a downward trajectory. This provides a warning that although the current move is up, a down move could be brewing.
The Bullish Percentage of S&P 500 Stocks is still in a downtrend.
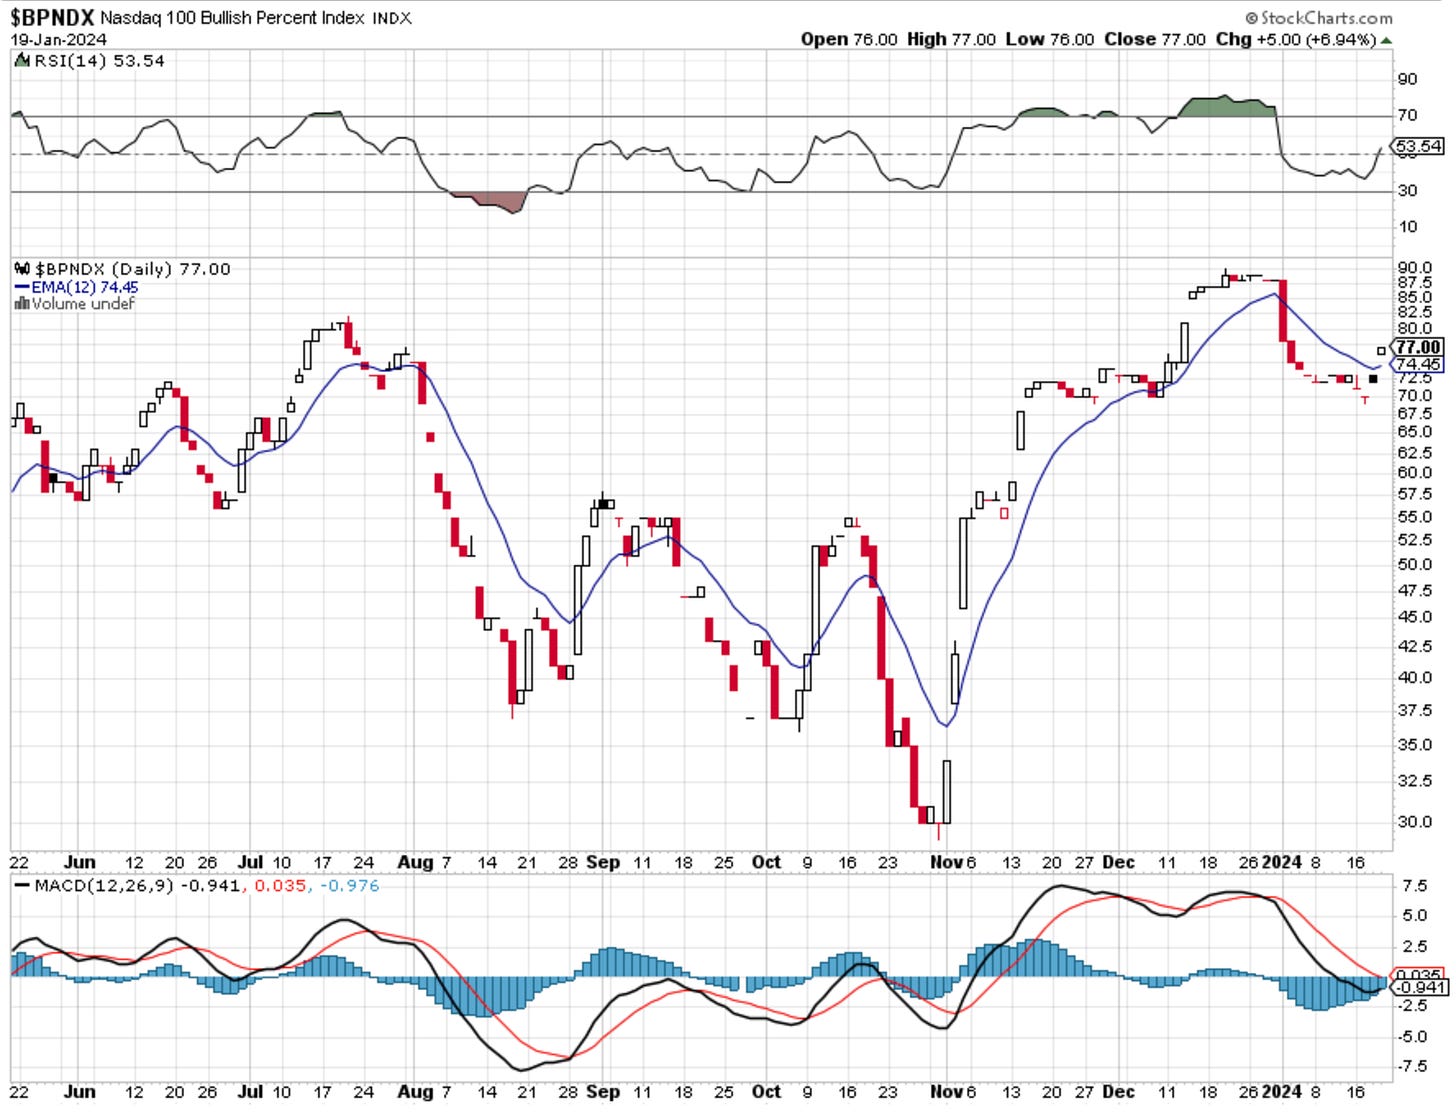
However, the Bullish Percentage of Nasdaq 100 Stocks reversed into an uptrend on Friday. This rally appears to be narrow and led by technology stocks.
Looking at YTD performance, this rally seems to be driven only by Technology and Communication Services. Healthcare participated as well to a lesser degree. Real-economy stocks are negative for the year and may be pricing in future global economic weakness. Basic materials are the worst performer due to China’s economic slowdown.
Cycles: Reversal or Inversion?
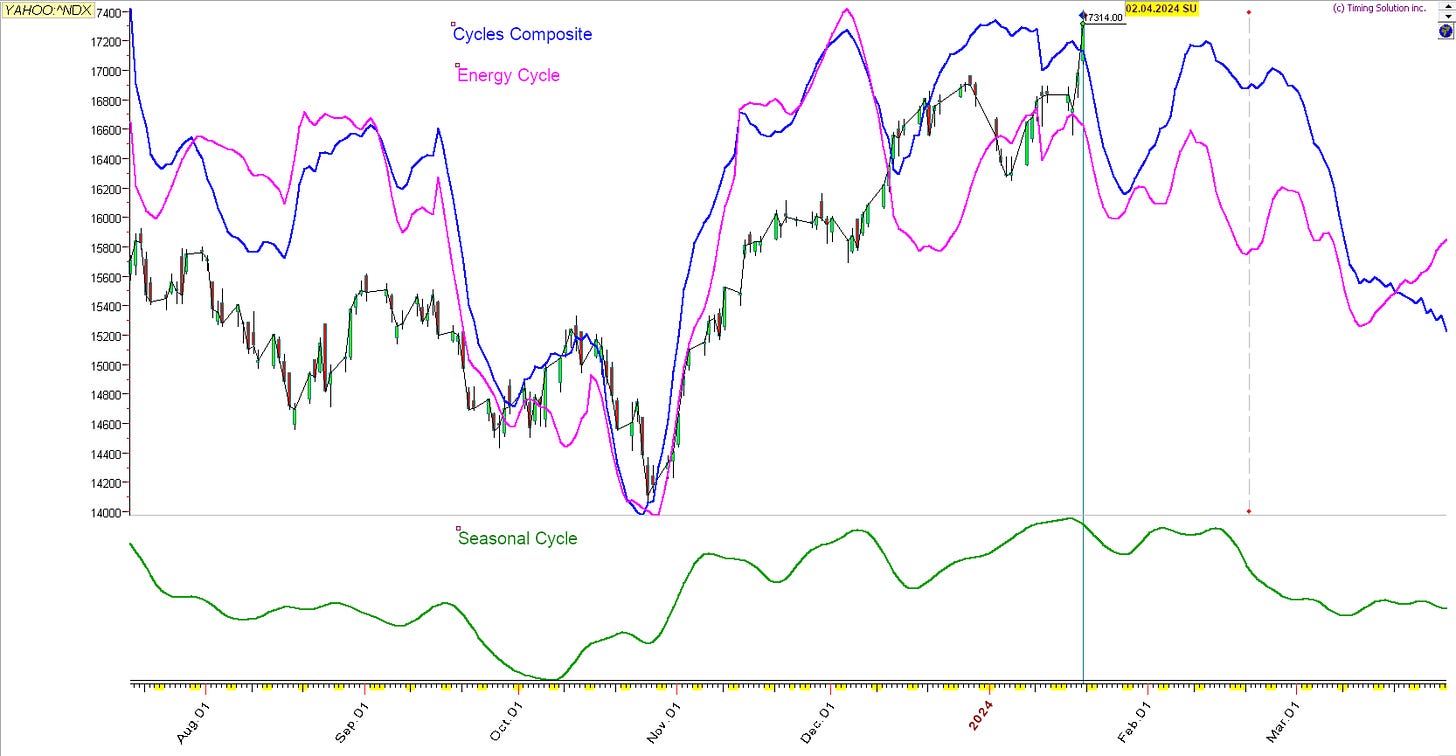
Our updated cycles show that we are on the precipice of either a reversal or an inversion. Looking at the cycle chart for the S&P 500 below, the Cycles Composite (blue line), Energy Cycle (pink line), and Seasonal Cycle (green line) all point to some upcoming downside. If this is correct, then Friday’s uptick could have been a mini-blowoff top before a drop. If the uptrend continues, then it may be a cycle inversion, where an expected down-cycle becomes an up-cycle. Cycle analysts know that cycle inversions are common, thus trading the technical chart and managing risk are always of the utmost importance.
The Nasdaq 100 (NDX) does appear to be more bullish than the S&P 500 in terms of cycles. The cycle chart below shows the NDX having a slight pullback to a 1/24 to 1/27 buy point. A strong rally may occur and last until 2/9 to 2/15.
Conclusion: Get It While It’s Hot
As market participants, we must take what the market gives us. Right now we are given a narrow rally of tech companies involved in AI. This has the potential to be a runaway uptrend as the growth of AI is not easy to calculate, similar to other introductory growth dynamics. When this happens, speculation tends to take over, similar to the internet boom of the late 1990s. The S&P 500 will tag along for the ride as Technology and Communications Services comprise 38% of the index. Of course, there is always the possibility of a profit-taking on tech. The drag of the real economy (slower interest rate cuts, slowing global growth) may not be strong enough to stop the runaway train called Artificial Intelligence. Anything can happen in 2024 so keep an open mind, take calculated risks and always manage your risk.
For our Paid Subscribers, we’ll go over AI-related stocks.
Disclaimer - All materials, information, and ideas from Cycles Edge are for educational purposes only and should not be considered Financial Advice. This blog may document actions done by the owners/writers of this blog, thus it should be assumed that positions are likely taken. If this is an issue, please discontinue reading. Cycles Edge takes no responsibility for possible losses, as markets can be volatile and unpredictable, leading to constantly changing opinions or forecasts.


