In our previous Crypto Piece titled “It’s Time” from 20th October, we highlighted that Bitcoin has been closely following the timing of the 2014 to 2016 fractal since the top in 2021. Based on this blueprint, Bitcoin was ready for a break above the $30k resistance level.
This is what happened in a week’s time:
This Move Has More Legs:
A lot of people missed this move in anticipation of prices below $25k, but our subscribers made money if they followed the levels mentioned in our earlier Crypto Pieces. For those that didn’t, don’t worry! This move is NOT over yet, and still has more upside on the table. Let’s play this level-to-level so that you can mark it on your chart/notes and follow along throughout.
The break above $30.5k has opened the doorway to significant upside and converted previous resistance to support. While a retest of the $30.5k - $32k region is possible, we wouldn’t count on it being the next move. Mainly because a lot of people are sitting on the sidelines waiting for this retest, so max pain right now would be some sideways movement followed by continuation of the uptrend. A sensible stop-loss for any trade would be below the $30.5k - $32k region because a close below that region would make the current move a deviation.
There are 3 overhead resistance levels to remember:
Resistance 1 - $35.2k
Resistance 2 - $37.5k
Resistance 3 - $41.2k
A break above all 3 resistances would open the road to deep 40k levels, but we’ll address that IF we see Bitcoin closing in on resistance 3.
On a higher time frame (5-Day chart), our “Secret Sauce” indicator has just spiked up, indicating that volatility is returning. Remember, this does NOT speak to direction of the move, just the potential size of it. Simultaneously, the MACD just crossed bullish and is above the 0 line, indicating bullish momentum. Putting our “Secret Sauce” and MACD together, we expect high volatility towards the upside in the coming weeks.
What About Ethereum?
ETH has also started showing some promising signs, with multiple bullish developments in the works on the weekly time frame:
1. This week’s candle is on track to close above the 9, 21 and 55 EMAs (still awaiting confirmation of the candle though)
2. Bullish RSI divergence with price making a lower low, but RSI making a higher low
3. MACD curling up to potentially have a bullish crossover
While these developments are bullish, confirmation is key, and IF you plan to front-run it then make sure to have a tight stop-loss (suggestion: below the 9-EMA on the weekly chart, which currently is at $1681 at the time of writing).
ETH/BTC Ratio:
The ETH to BTC ratio is now in the value zone, which is where a bounce is very likely i.e., Ethereum outperforming Bitcoin. A bullish RSI divergence adds further confluence to the possibility of a bounce. This shouldn’t be confused with a reversal in this ratio though. In case we spot signs of a reversal, we’ll be sure to cover it here in a future Crypto Piece.
Bitcoin Dominance Confirms The ETH/BTC Ratio Chart:
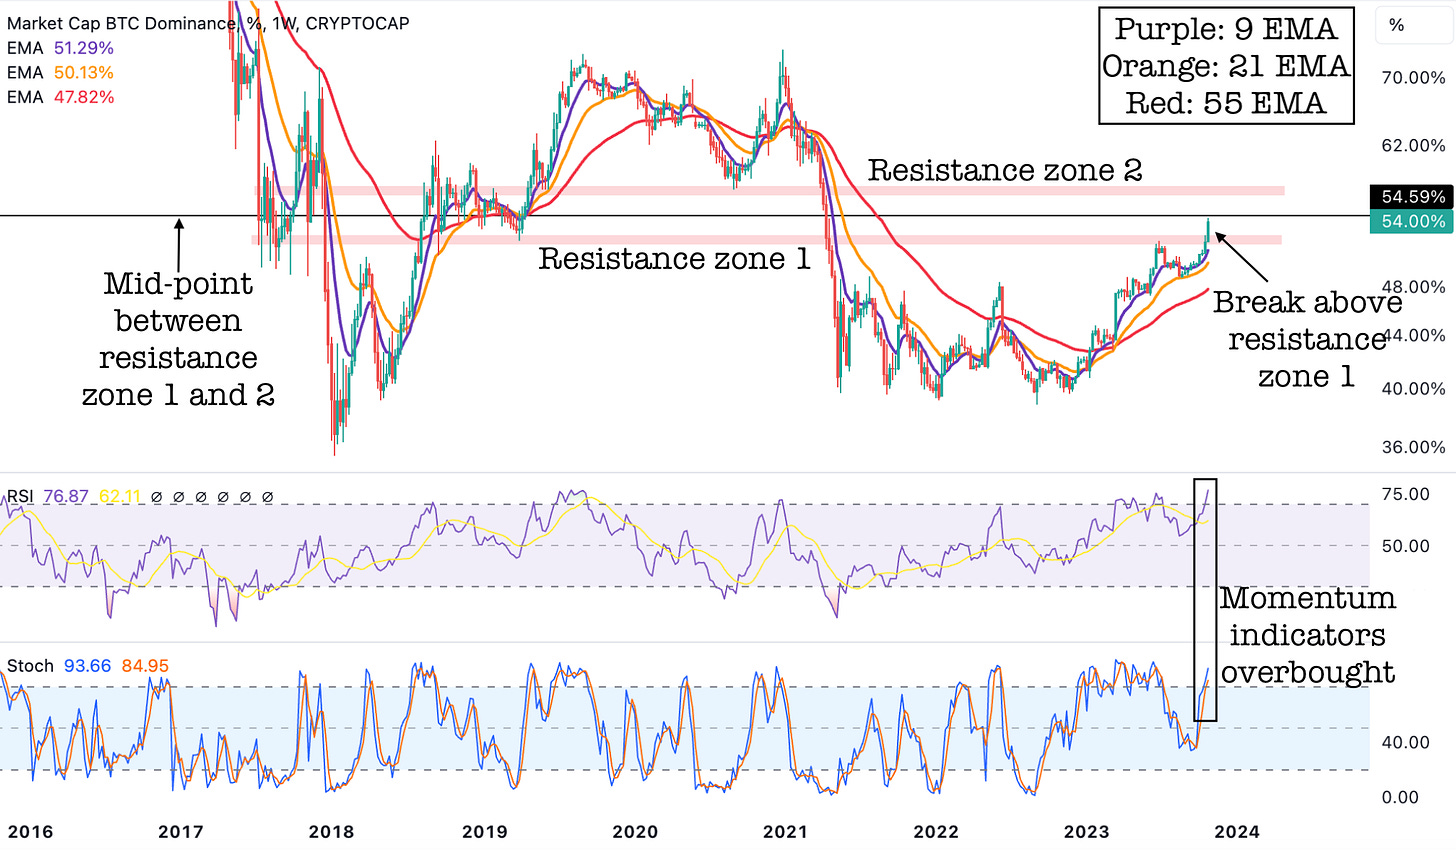
The Bitcoin dominance chart has broken above the resistance zone 1 (between 51.75% to 52.75%) and is facing slight resistance at the 54.6% region. Momentum indicators like RSI and Stochastic oscillator are currently very oversold, pointing to a pullback soon. This would allow Ethereum (and altcoins) to outperform Bitcoin for a short period of time as indicated in the earlier chart as well. However, the overall structure of the Bitcoin dominance chart looks bullish for now, with the 9, 21 and 55 EMAs on the weekly all curling up. A break above the 54.6% level would then bring in resistance zone 2 into play (between 56.5% to 57.5%). This should act as a major resistance area.
Crypto Cheat Sheet:
Here is a cheat sheet for our subscribers that can be referred to understand how Bitcoin dominance + Bitcoin price action affects altcoin prices.
Feedback is much appreciated in the comments below. Until next time!
Disclaimer - All materials, information, and ideas from Cycles Edge are for educational purposes only and should not be considered Financial Advice. This blog may document actions done by the owners/writers of this blog, thus it should be assumed that positions are likely taken. If this is an issue, please discontinue reading. Cycles Edge takes no responsibility for possible losses, as markets can be volatile and unpredictable, leading to constantly changing opinions or forecasts.


