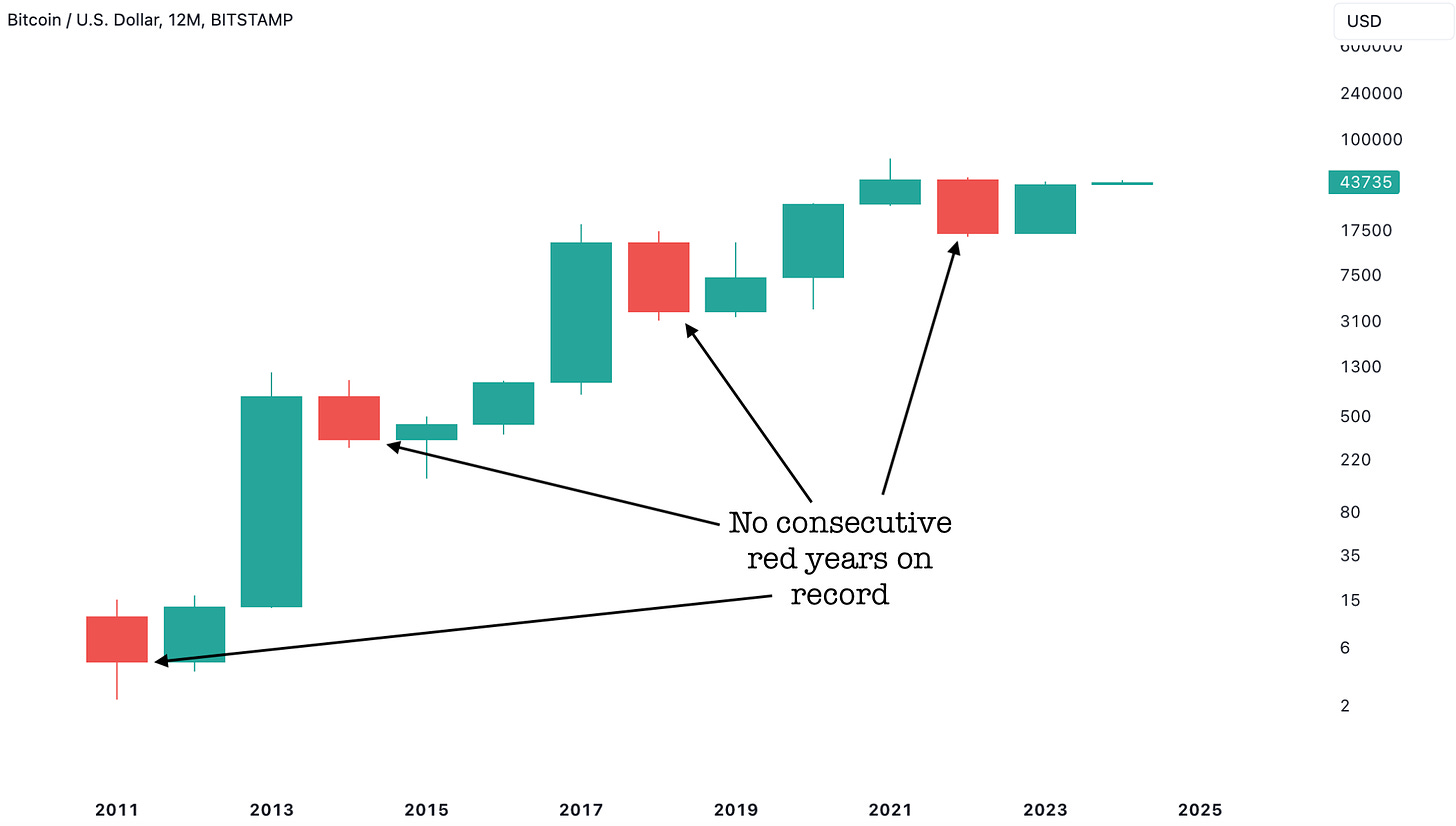
Bitcoin closed 2023 with a strong green yearly candle, maintaining its track record of not having any back-to-back red candles since inception. However, it seems like the bears have started stepping in frequently as soon as 2024 kicked off
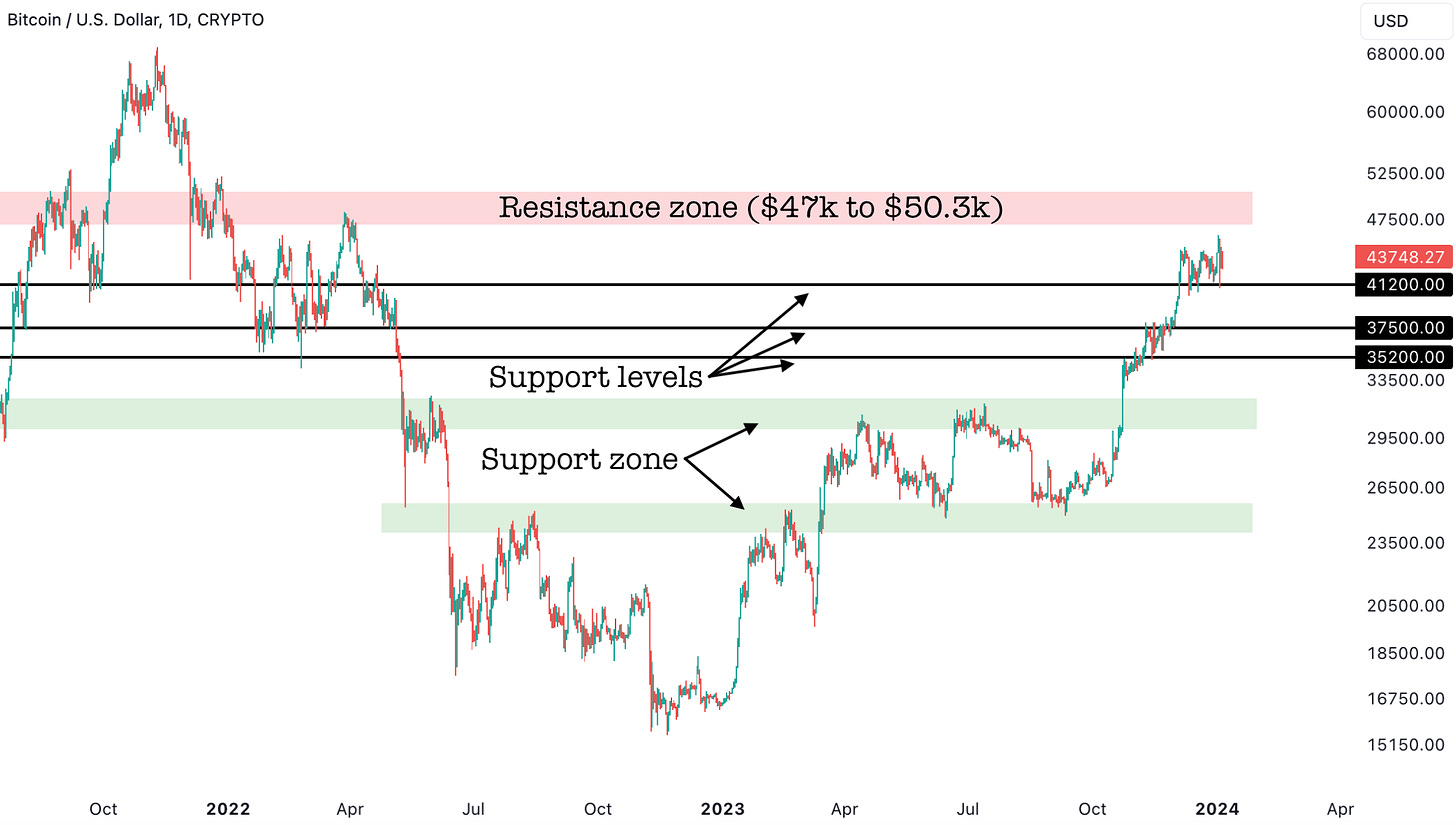
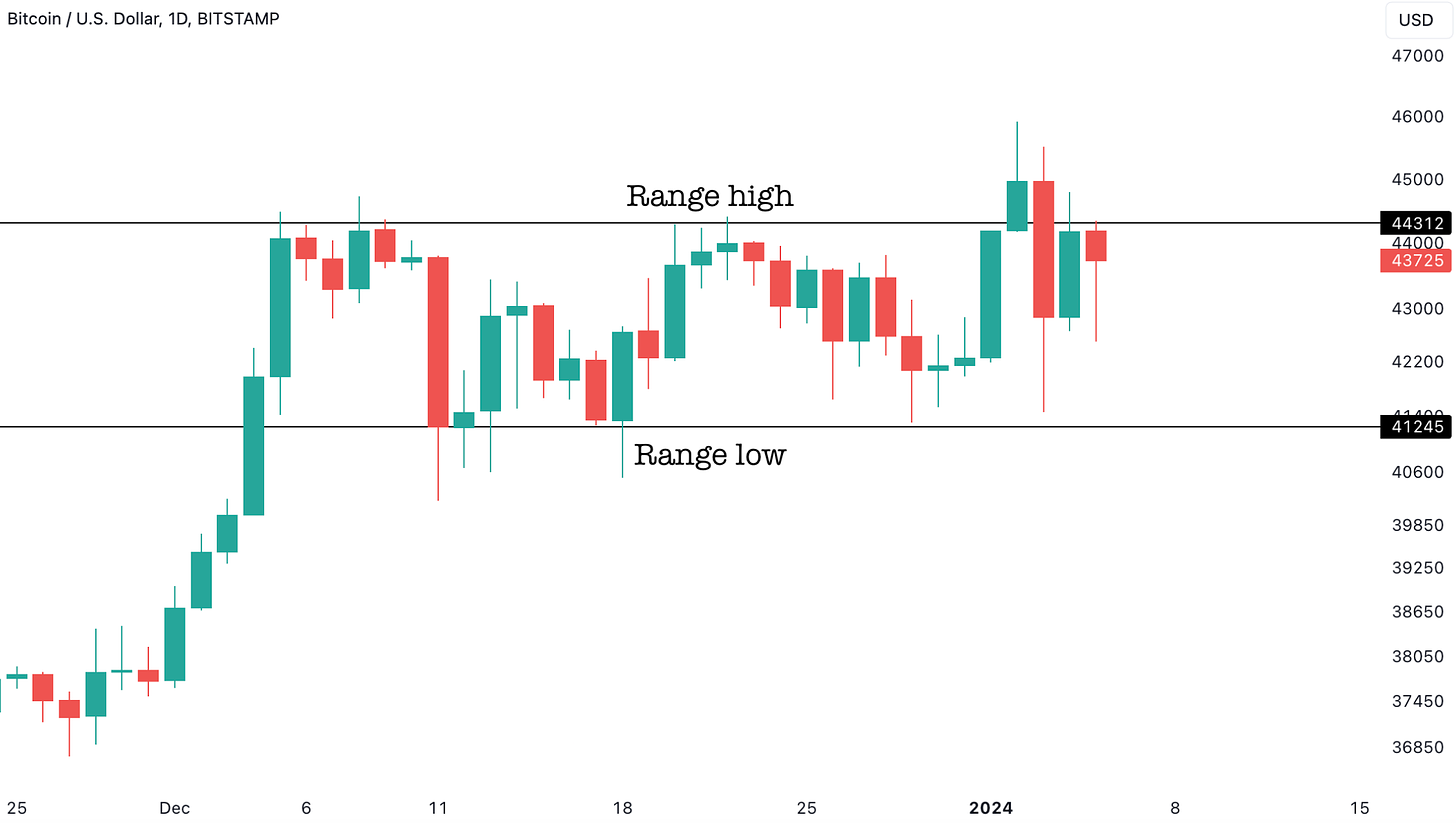
Bitcoin is still maintaining the key $41.2k level, despite a wick below it during the liquidation event earlier this week. As far as the $41.k region holds, $47k is still on the table, but a break below $41.2k would open the doors for a much deeper correction to at least $35.2k region. Price action has been getting very volatile as we near the Bitcoin ETF decision. We’re still of the opinion that this is very likely to be a sell the news event, albeit with a potential initial pump that gets sold-off quickly.
Currently, Bitcoin is in a trading range with a failed attempt to breakout of it. While Bitcoin reached $45.9k last Tuesday, it didn’t have enough fuel to make it to our $47k target yet. However, we believe that a Bitcoin ETF could provide it enough fuel to hit out target before the deeper correction begins. While there have been a couple of liquidation events in the past few days, both times the dips got bought up relatively quickly, indicating that buyers are still stepping in. This makes us believe that one more push higher before the sharper drawdown is the likely outcome here. However, all upside bets are off with a confirmed close below $41.2k.
Intermarket Analysis
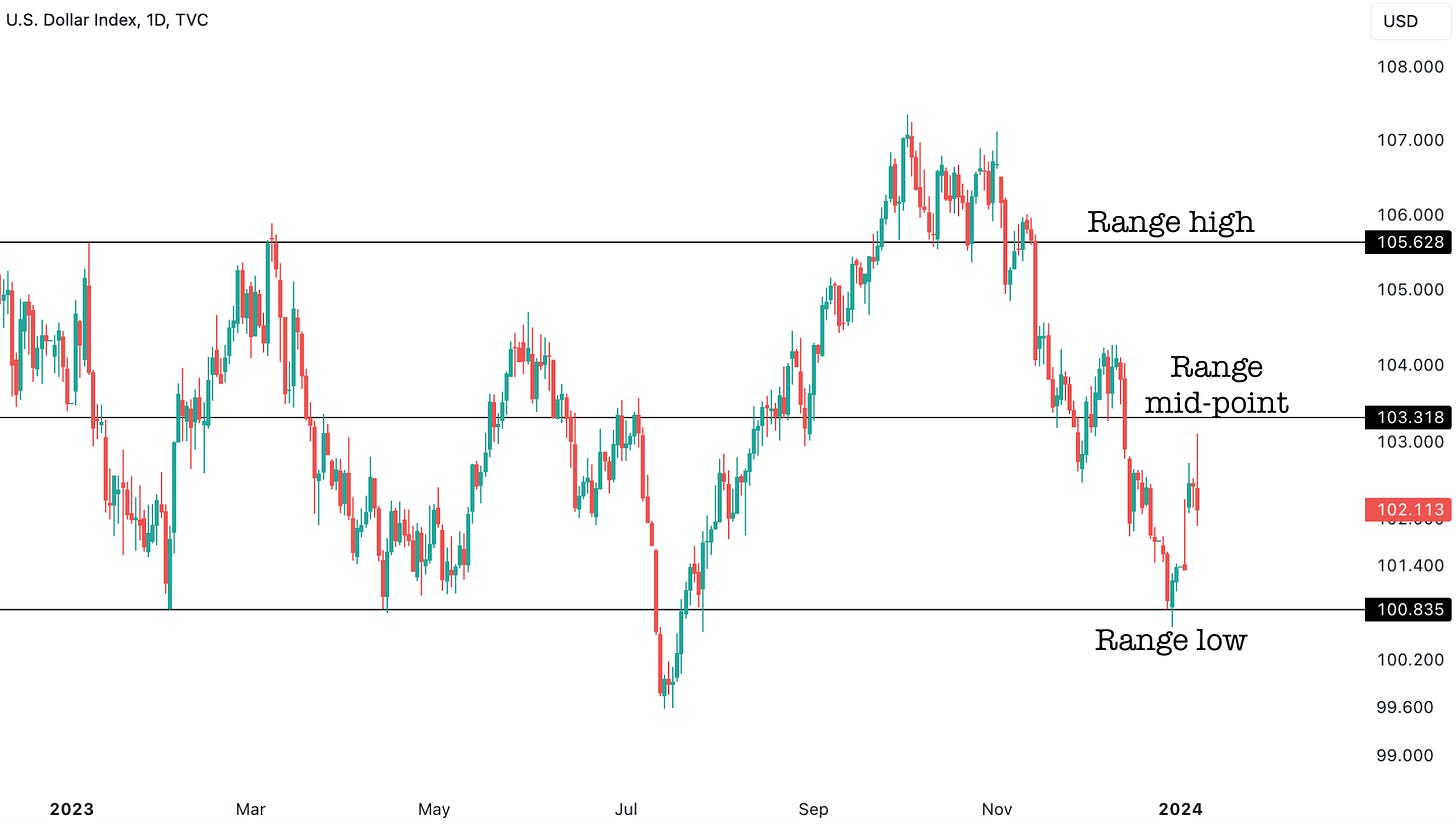
One of the reasons that risk-on assets like Bitcoin saw a sharp correction was because of the sharp bounce in the Dollar Index ($DXY) from its range low. While this bounce was expected, we didn’t expect it to lead to a liquidation cascade for cryptos, but that’s helped clear out a lot of the high leverage in the system.
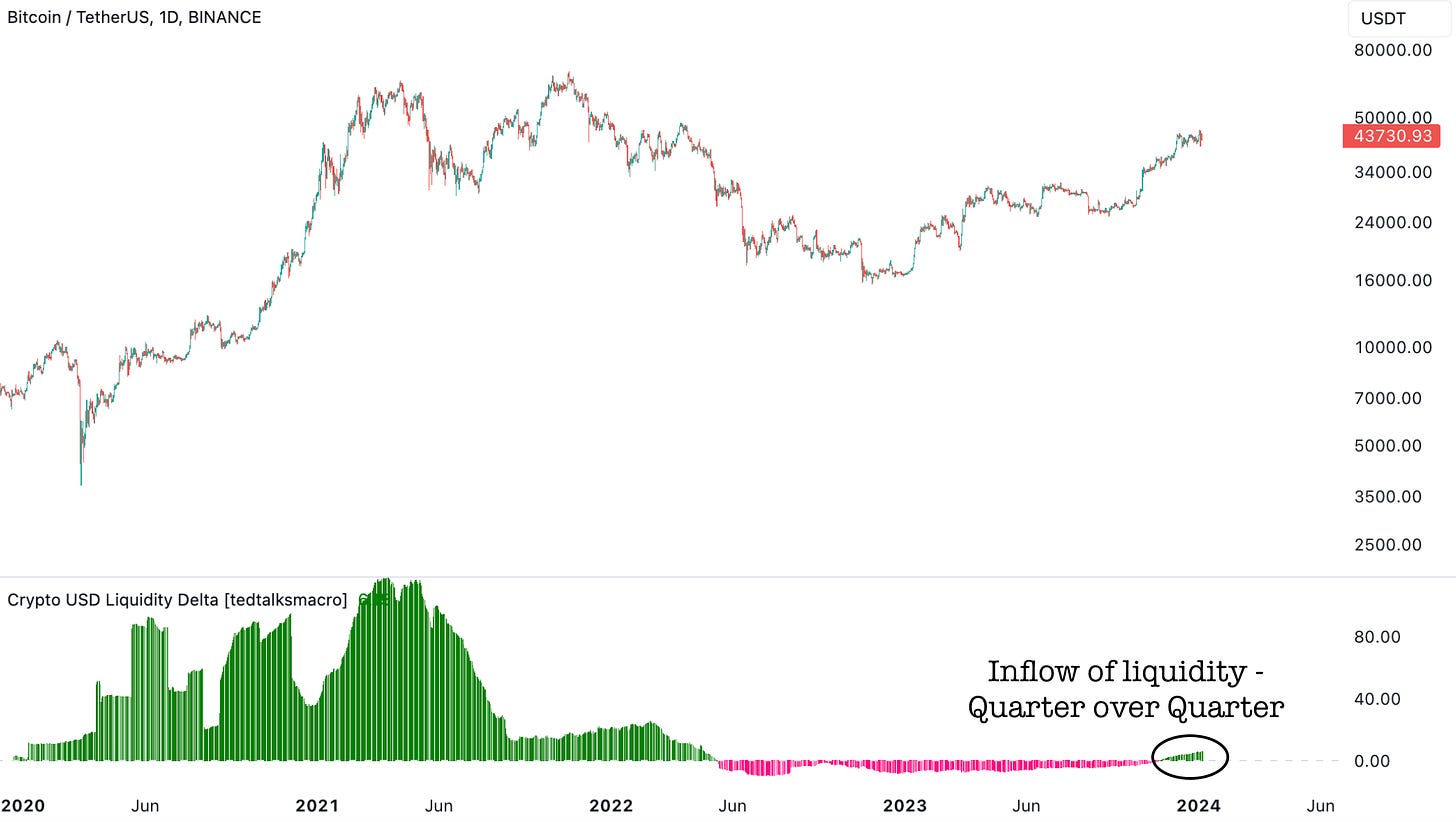
On the other hand, a very positive sign for cryptos is the return of liquidity. The crypto USD liquidity index (courtesy of Tedtalksmacro) has shown its first positive quarter over quarter reading since May 2022. For those interested in following this index, it can be found for free on Tradingview under the indicators list.
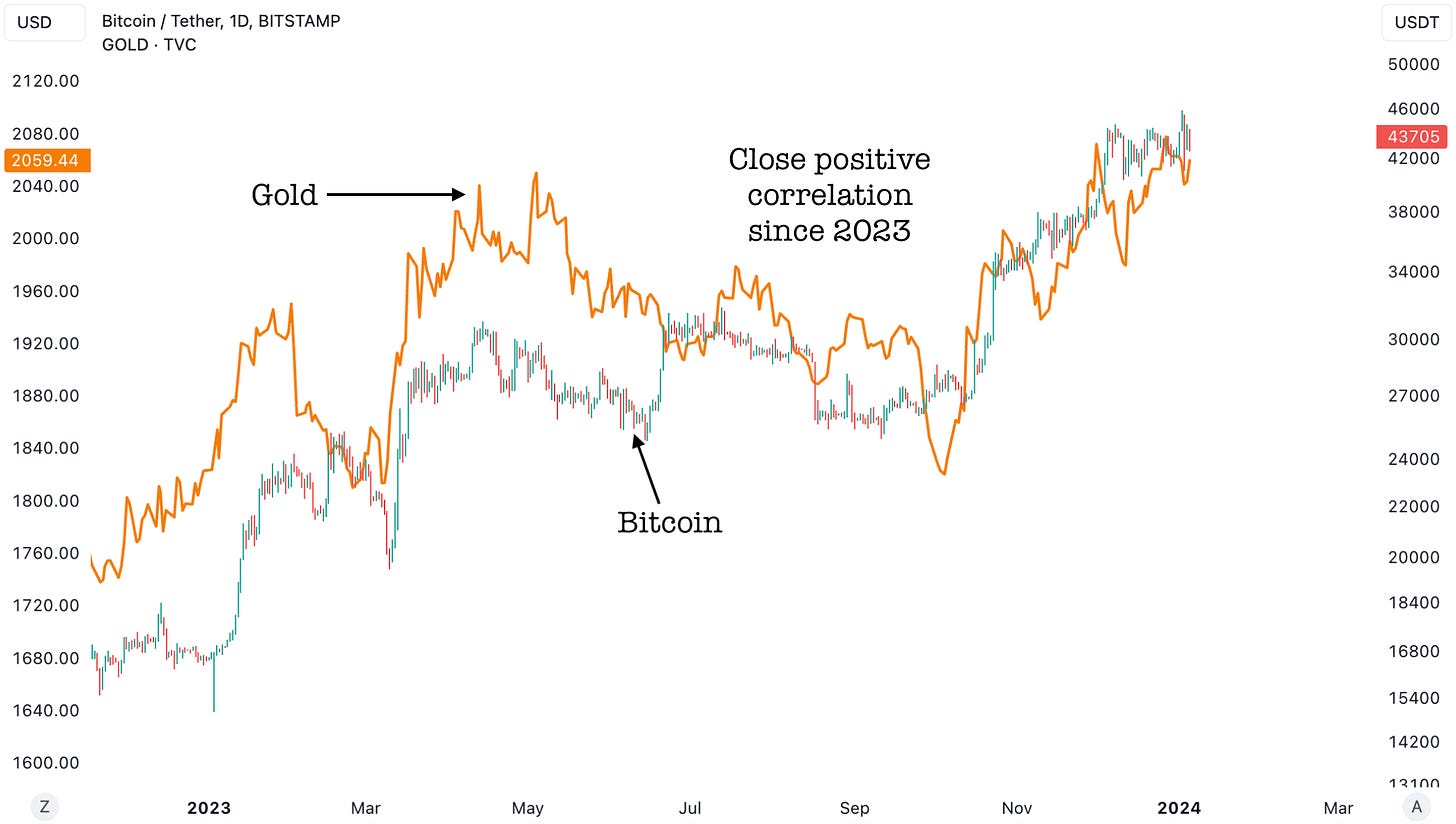
Another important dynamic that’s been occurring since 2023 is the close positive correlation between Gold and Bitcoin. This would be a key chart to keep an eye on because a breakout/breakdown in one of the two assets can act as a leading indicator for the other.
Ethereum and its Relative Performance
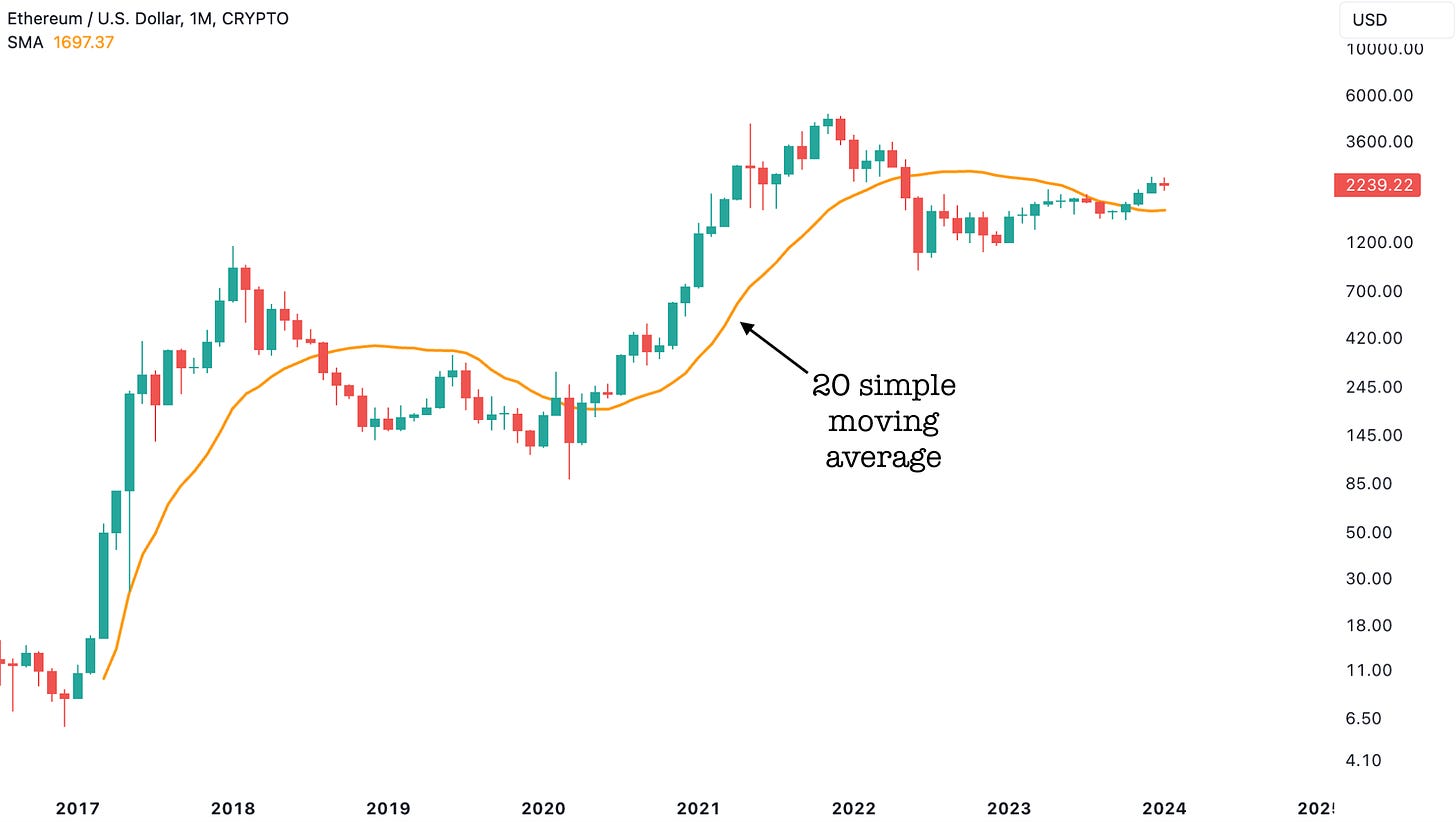
On the monthly time frame, Ethereum has begun its bull run structure with a break above the 20-simple moving average. While a retest of this moving average in the coming months is likely, we expect it to hold.
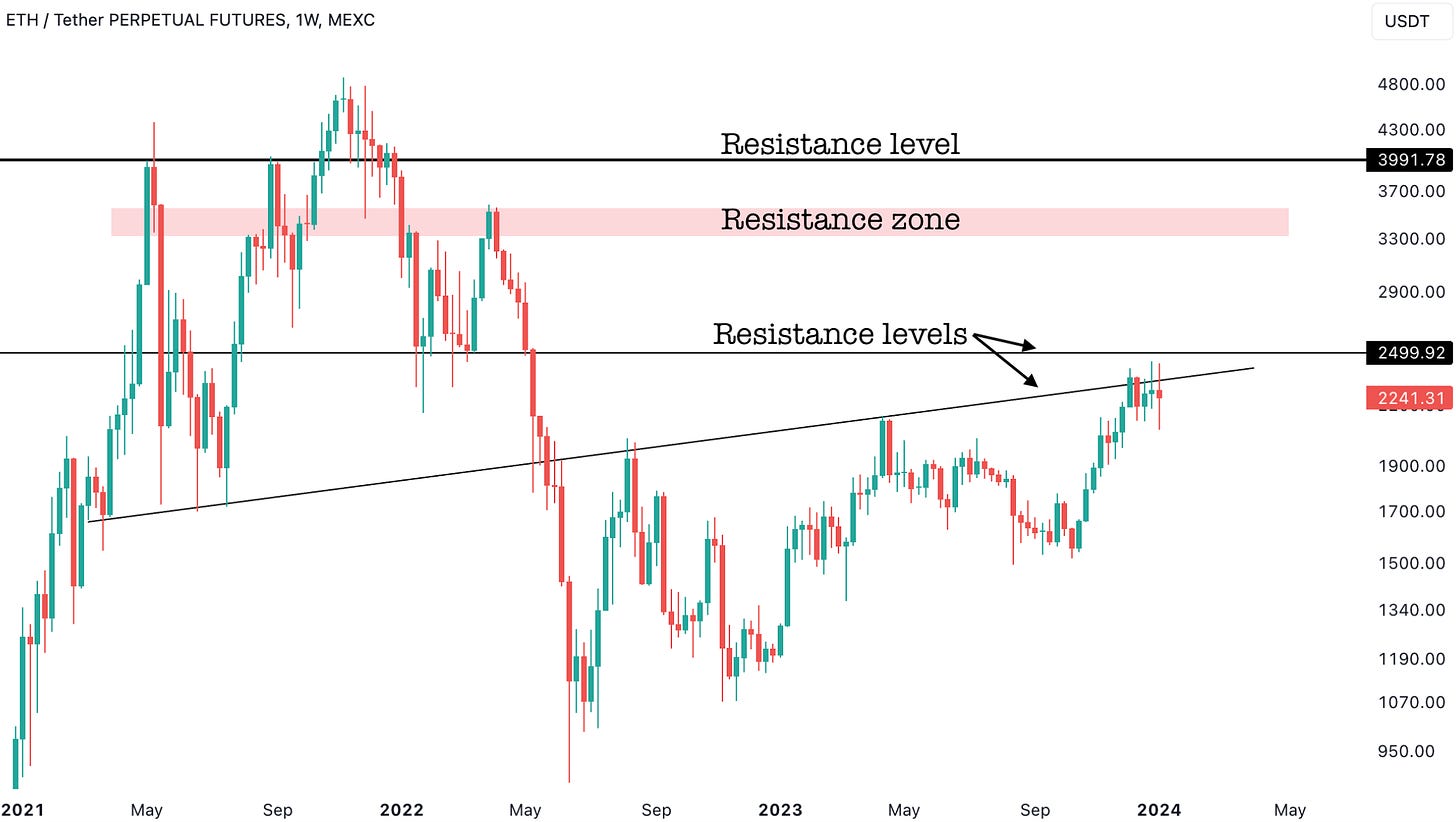
On the weekly time frame, Ethereum is still having trouble getting past its upward sloping resistance. A break above would put the $2500 level at play.
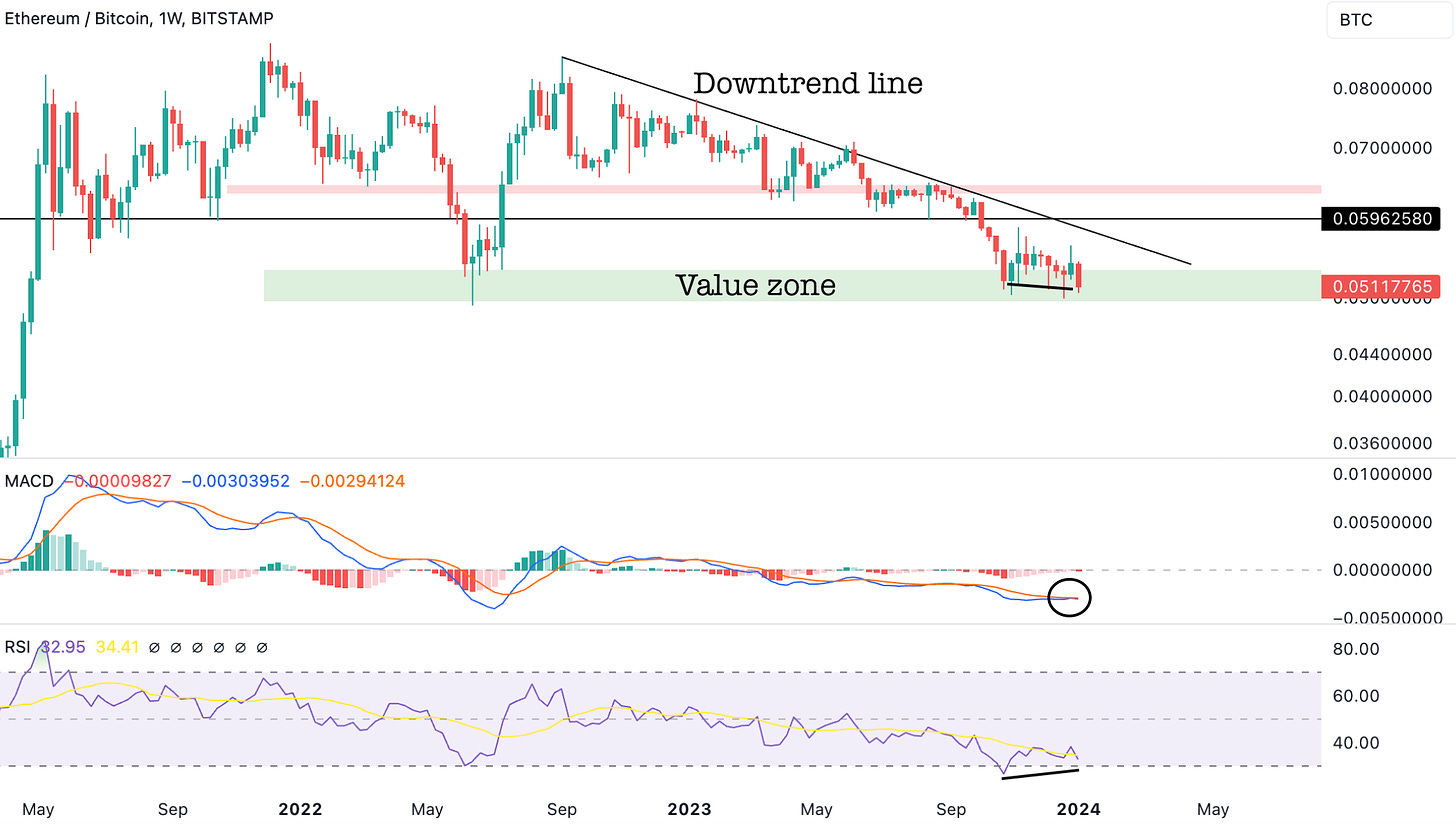
The ETH/BTC ratio is still in the value zone. The weekly MACD has still been unable to flip bullish. The weekly RSI is showing signs of a bullish divergence forming (lower low on the ratio and higher low on RSI), but is yet to be confirmed.
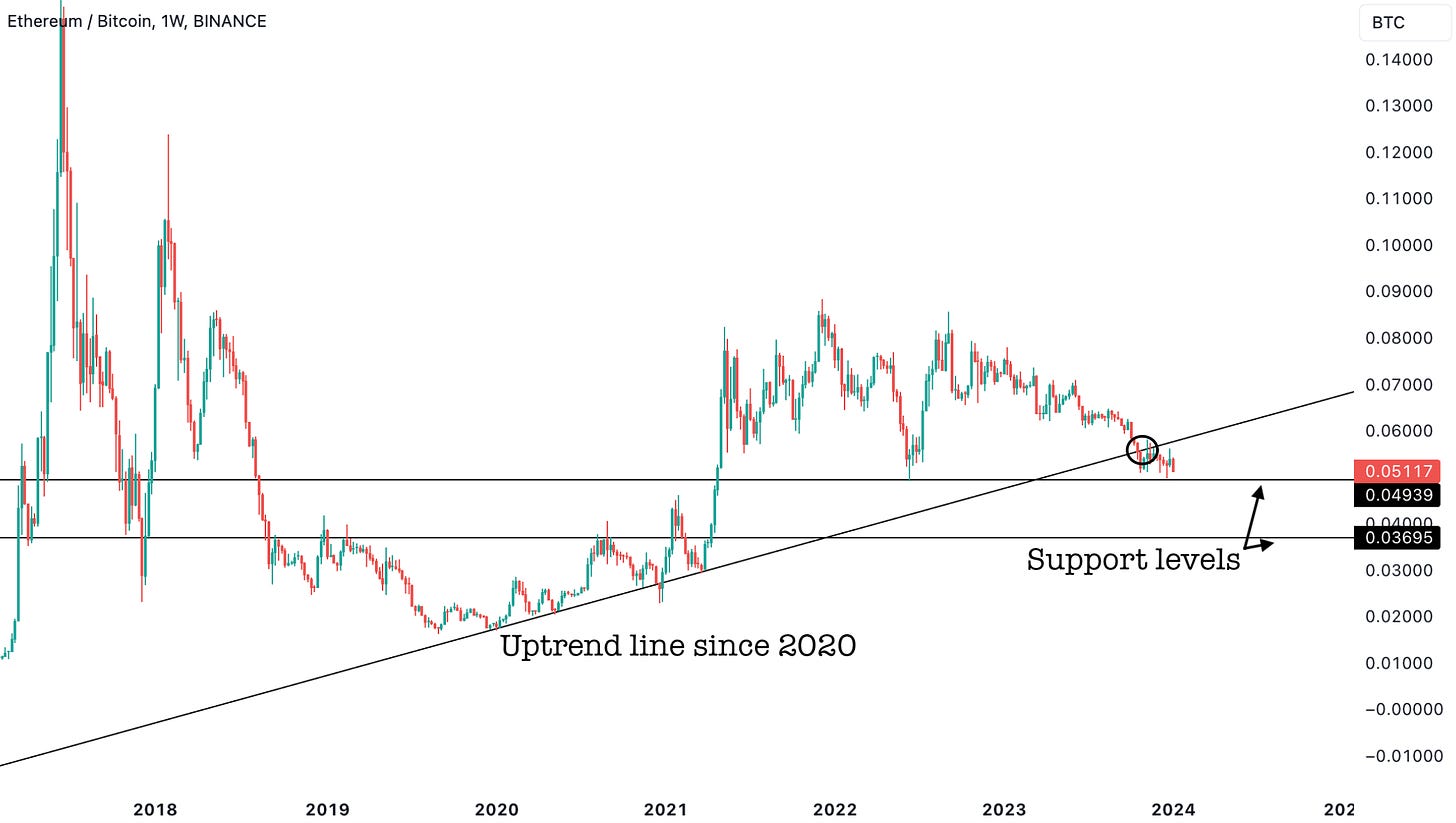
However, looking at the ETH/BTC ratio with a linear scale chart shows a more troubling picture. The uptrend line from 2020 was broken a few weeks ago, and the ratio is currently near support. IF this support breaks, it could result in significant underperformance for Ethereum relative to Bitcoin. While we believe such an underperformance is unlikely for now, we found it important to highlight this possibility.
Setups + A Secret Intermarket Analysis Chart
In this section, we’ll go over setups for a couple of attractive Bitcoin miners: Marathon Digital ($MARA) and CleanSpark ($CLSK). This is in preparation for the pullback, which will allow our members to optimize their entries and line themselves up for potential upside of more than 3x – 5x during Bitcoin 2024-2025 bull run. Towards the end we’ll also provide you with a secret intermarket dynamic chart that will give you an edge in not only Bitcoin but also on Copper and Gold.


