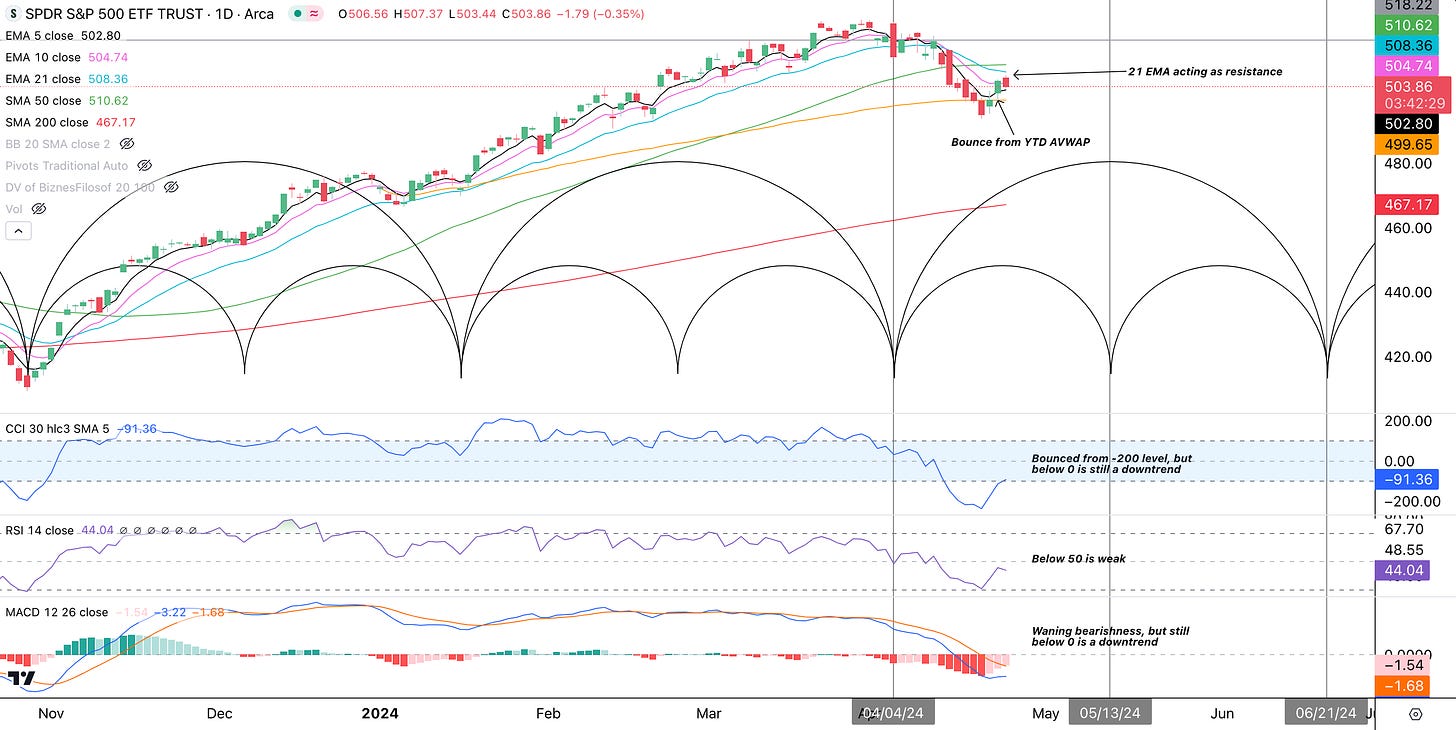
The S&P 500 (SPY) had a reactionary bounce from the year-to-date Anchored Volume Weighted Average Price (AVWAP or orange line). This coincided with the CCI being way oversold below the -200 mark. When CCI touches -200, a bounce often occurs. Similarly, RSI often produces a bounce when it hits the 30 mark. Unfortunately for bulls, the down-sloping 21 EMA (blue line) is acting as resistance. In our system, the 21 EMA is the most important moving average and reflects roughly 1 month of price data. Notice how the October 2023 low rally followed the 21 EMA up. Unless something changes, we can assume the current downtrend will follow the 21 EMA down.
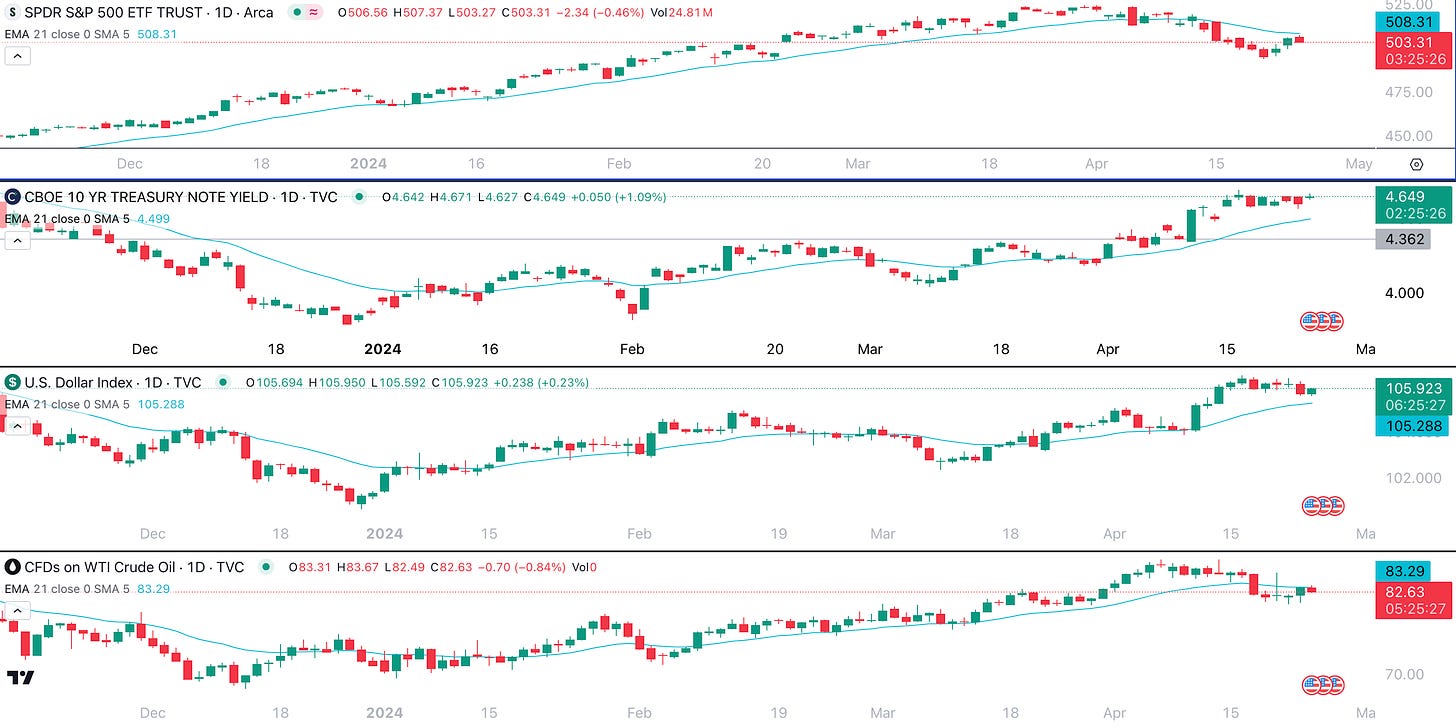
The Intermarket picture may be driving this weakness as the 10-year Treasury rate (TNX) and US Dollar (DXY) continue to trend higher above their respective 21 EMAs. Be sure to look out for our upcoming Educational Piece on Intermarket Analysis!
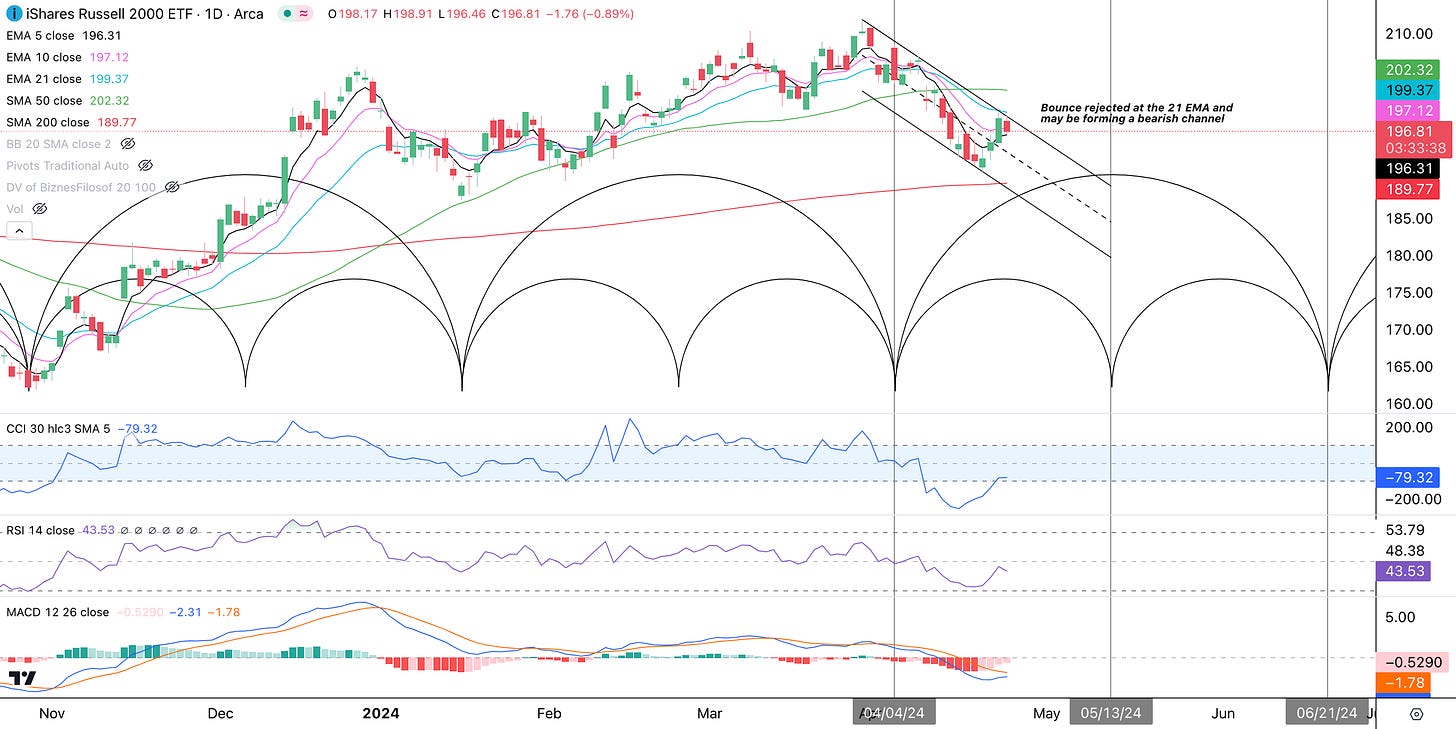
The other indexes are following suit. The Russell 2000 (IWM) also got rejected near the 21 EMA and appears to be forming a bearish channel.
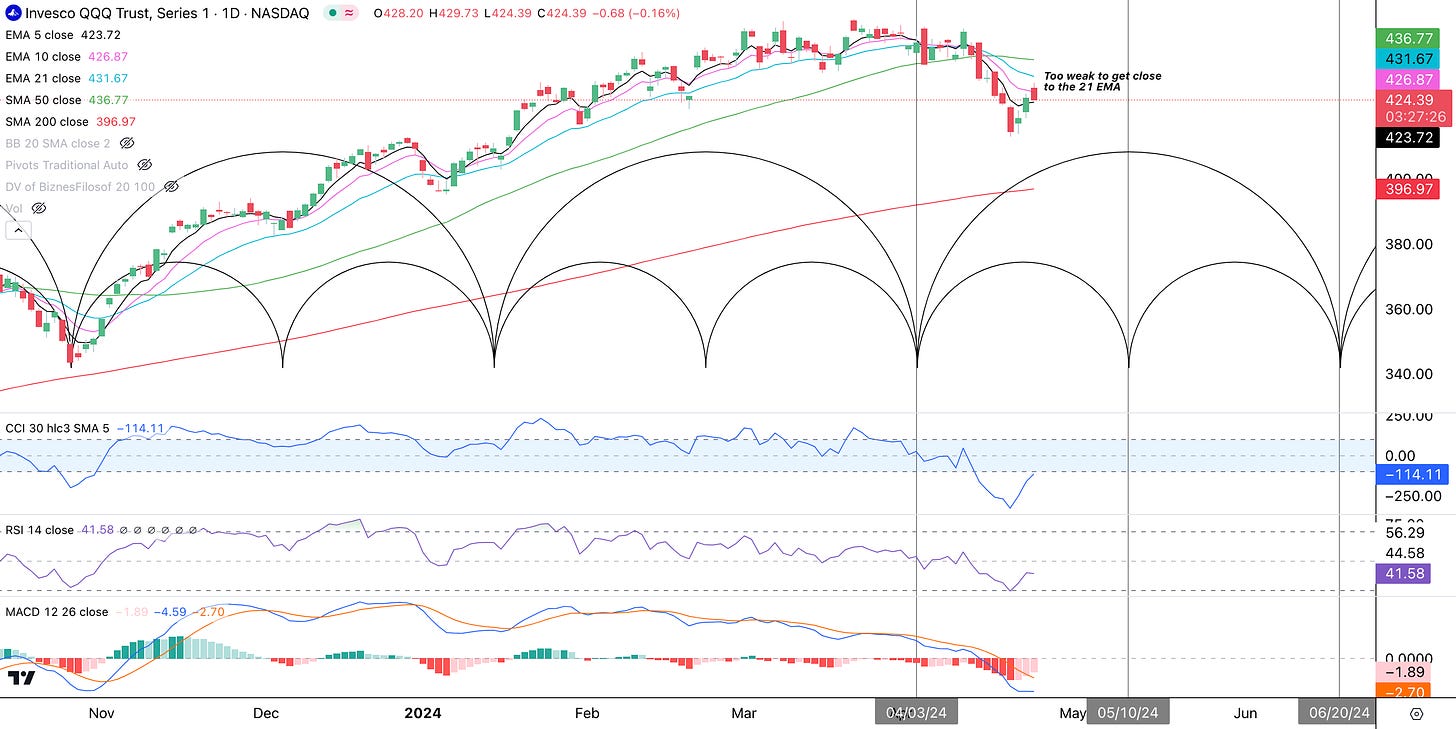
The Nasdaq 100 (QQQ) has relative weakness to the other indexes as it could not even come close to the 21 EMA. This represents the concept of the “Pendulum”. What is extra strong going up could be extra weak going down.
The sector performance snapshot shows that the defensive sectors are strong as the offensive sectors are weak. This does not provide confidence for a sustainable rally.
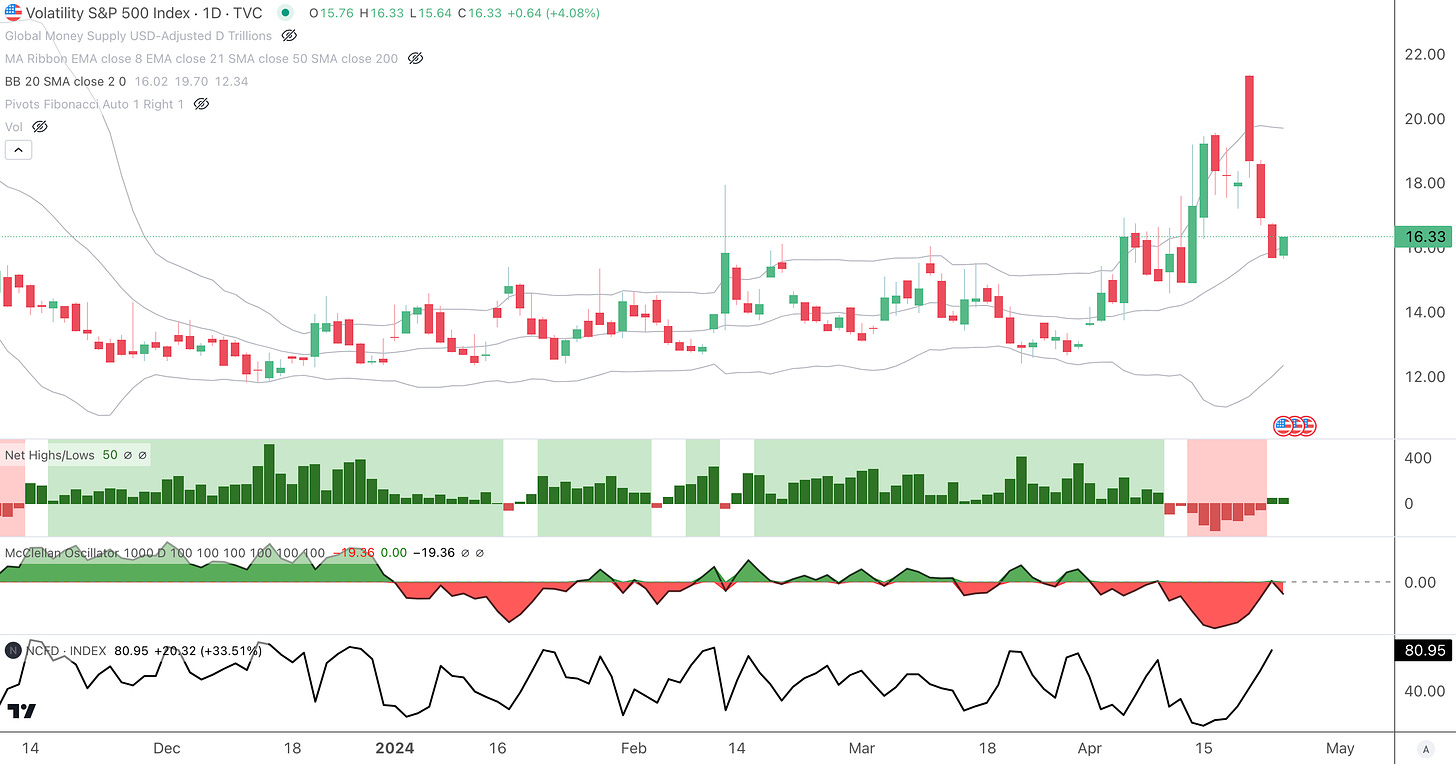
The Volatility Index (VIX) got ahead of itself and popped hard on April 19th due to news of Israel’s retaliation on Iran. With no news of retaliation from Iran, the VIX fell back to the Bollinger Band midpoint or the 20-day Simple Moving Average. From here it appears to be setting up for another move up. There are a few Net New Highs, but this trend has yet to prove it has staying power. The McClellan Oscillator did produce a bounce, but that bounce appears to be fizzling out. The Percent of Nasdaq Stocks above the 5-day Simple Moving Average (NCFD) skyrocketed from 5% to 82% in a short period of time. This is a clear indication of FOMO in the market. Notice how high NCFD readings often led to up-movements in the VIX. This could be an early warning for another leg down for the indexes.
For Paid Subscribers we’ll display our Cycle Forecasts for the VIX up to the end of 2024. We hope this helps our valued subscribers to plan for sustainable rallies and avoid rug pulls when the time comes.
Disclaimer - All materials, information, and ideas from Cycles Edge are for educational purposes only and should not be considered Financial Advice. This blog may document actions done by the owners/writers of this blog, thus it should be assumed that positions are likely taken. If this is an issue, please discontinue reading. Cycles Edge takes no responsibility for possible losses, as markets can be volatile and unpredictable, leading to constantly changing opinions or forecasts.


