

Can This Rally Continue?
Premium Section: New Areas of Strength

Nine consecutive weeks of gains. Seven straight winning sessions into the Memorial Day close. The S&P 500 finished the week at 7,580, marking its longest winning streak since 2023, and the tape is not showing the kind of exhaustion signals that typically precede meaningful tops.
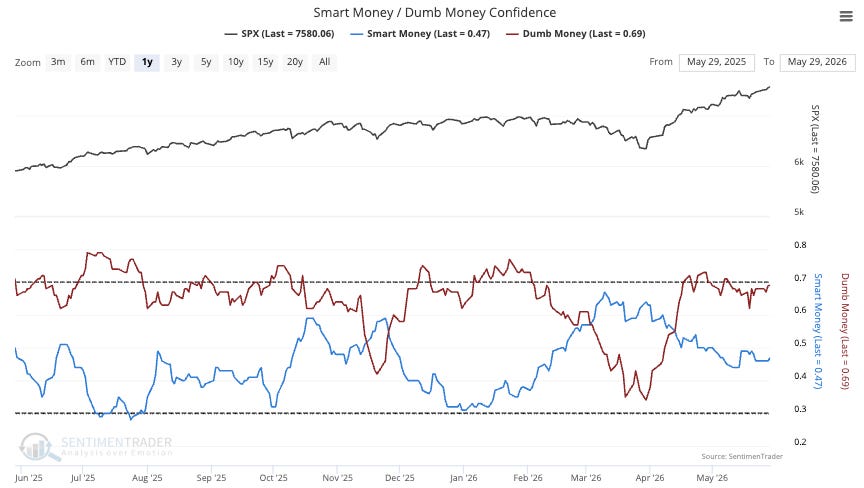
Every dip during this run has been met with buying. That participation pattern is what keeps the Greed Grind alive. Notice how Dumb Money continues to add exposure near the bullish extreme. Smart Money is also beginning to buy back in.
But many investors are wondering whether this rally can continue.
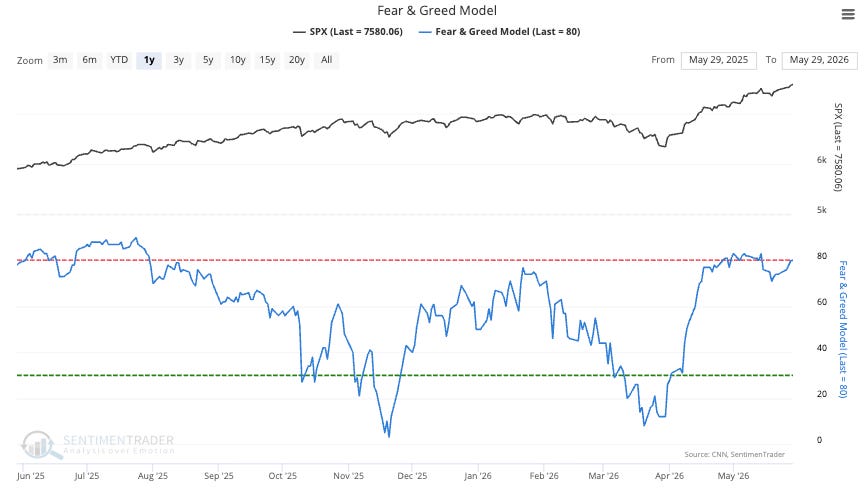
The Fear and Greed Model also continues to grind near the highs, telling us that bad news is currently being brushed aside as investors continue to buy equities. One of the best Investment Strategists, Ed Yardeni, says that this is not a FOMO (Fear Of Missing Out) rally, which is based on emotions. This is a FEMO (Fabulous Earnings Momentum) rally, backed by strong earnings growth and a low PE to Growth ratio (PEG ratio).
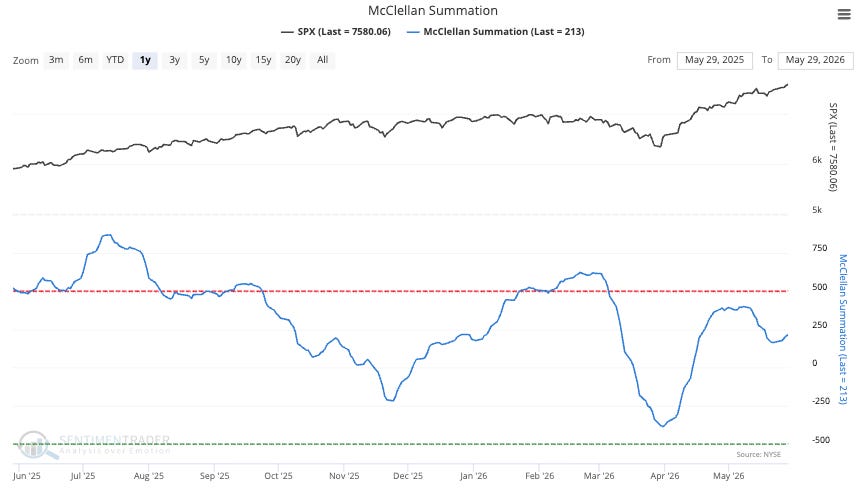
Breadth is beginning to turn higher, and if this continues, it would be an excellent tailwind for a broadening-out rally.
Let’s take a closer look at the S&P 500 (SPY) and the market internals:
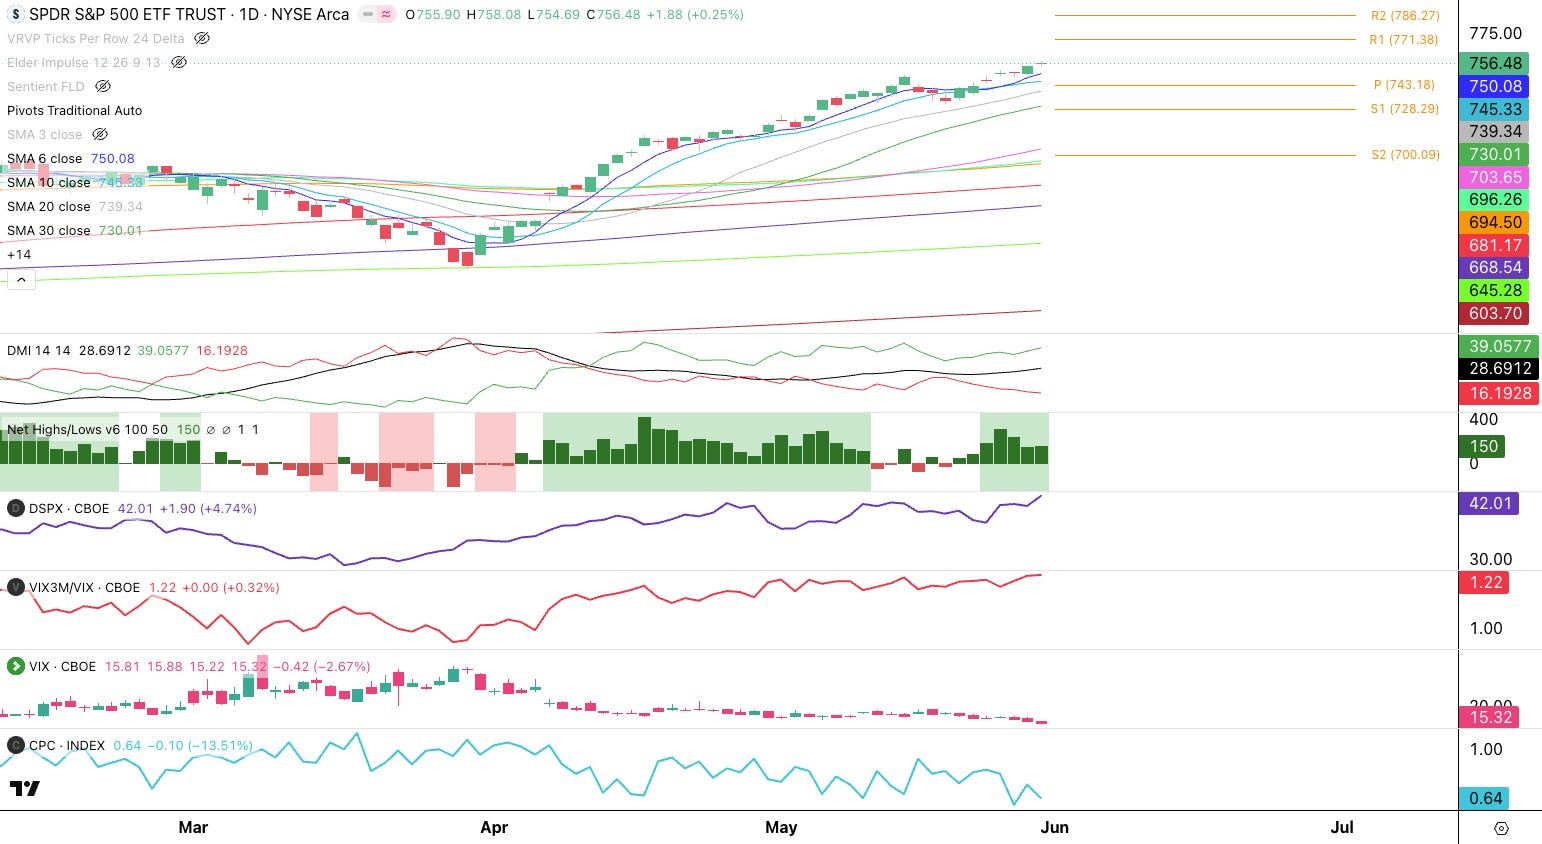
Trend: The SPY is trending above all moving averages so odds are stacked in favor of a continued rally for now.
Pivot Points: Pivot Points recalculate monthly and the June Pivot Points provide an R1 target of $771.38 (about 2% higher) and an R2 target of $786.27 (about 4% higher).
Directional Movement Index (DMI): The Bullish DMI (green) is nearing the 40 to 50 area, which often precedes a profit-taking. Be ready for a short-term profit-taking within a greater uptrend.
Net New Highs: There are significant Net New Highs, telling us that this is a bullish environment for individual stocks.
Dispersion (DSPX): Dispersion continues to rise, telling us that stocks are acting very different. Certain groups rise and others stagnate or fall at the same time.
VIX Curve: The VIX Curve is in contango (normal), but is in the overbought area (above 1.20). If this begins to point down, a pullback is likely.
VIX: The VIX is in a downtrend and currently at 15.32. Below 20, many investors are comfortable to be fully invested and holding overnight. However if the VIX gets below 14, this is a place where the market is too complacent and a pullback is. possible.
Put/Call Ratio (CPC): The CPC is weighted on the Call option side, and this favors a pullback or pause in the rally.
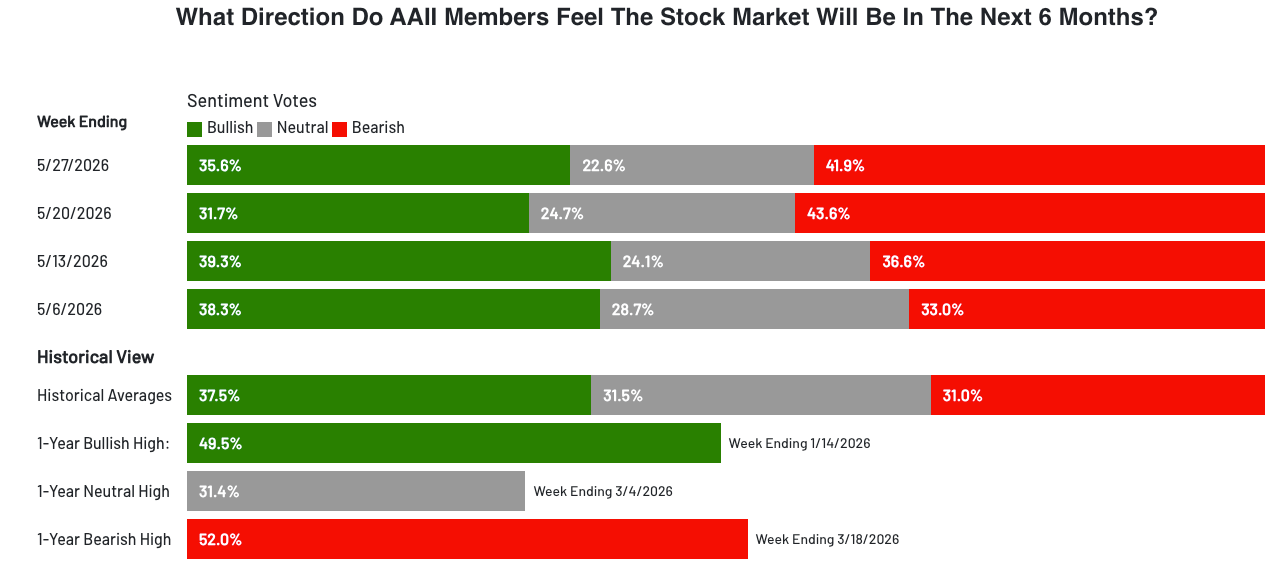
Sentiment: The AAII Sentiment Survey shows that we are not overly bullish right now. This supports a continued uptrend.
Conclusion: We believe that the rally will continue into July, however it is vulnerable to a profit-taking pullback.
We do see new areas of the market that are attracting investors and/or starting new uptrends. We’ll review them in the Premium Section.
Disclaimer - All materials, information, and ideas from Cycles Edge are for educational purposes only and should not be considered Financial Advice. This blog may document actions done by the owners/writers of this blog, thus it should be assumed that positions are likely taken. If this is an issue, please discontinue reading. Cycles Edge takes no responsibility for possible losses, as markets can be volatile and unpredictable, leading to constantly changing opinions or forecasts. All sales are final.