Charts Charts Charts: Charts and Cycle Forecasts for the Top ETFs & Stocks
The uptrend in the stock market continues, but important inflection points where the trend could change may be coming up. Today I want to focus on making money (and protecting profits) through the top tickers: SPY, QQQ, DIA, IWM, AAPL, AMZN, GOOGL, META, MSFT, NFLX, and TSLA. I’ll review each symbol's Technical Chart, Seasonal Cycle, and Cycle Composite. Let’s do this!
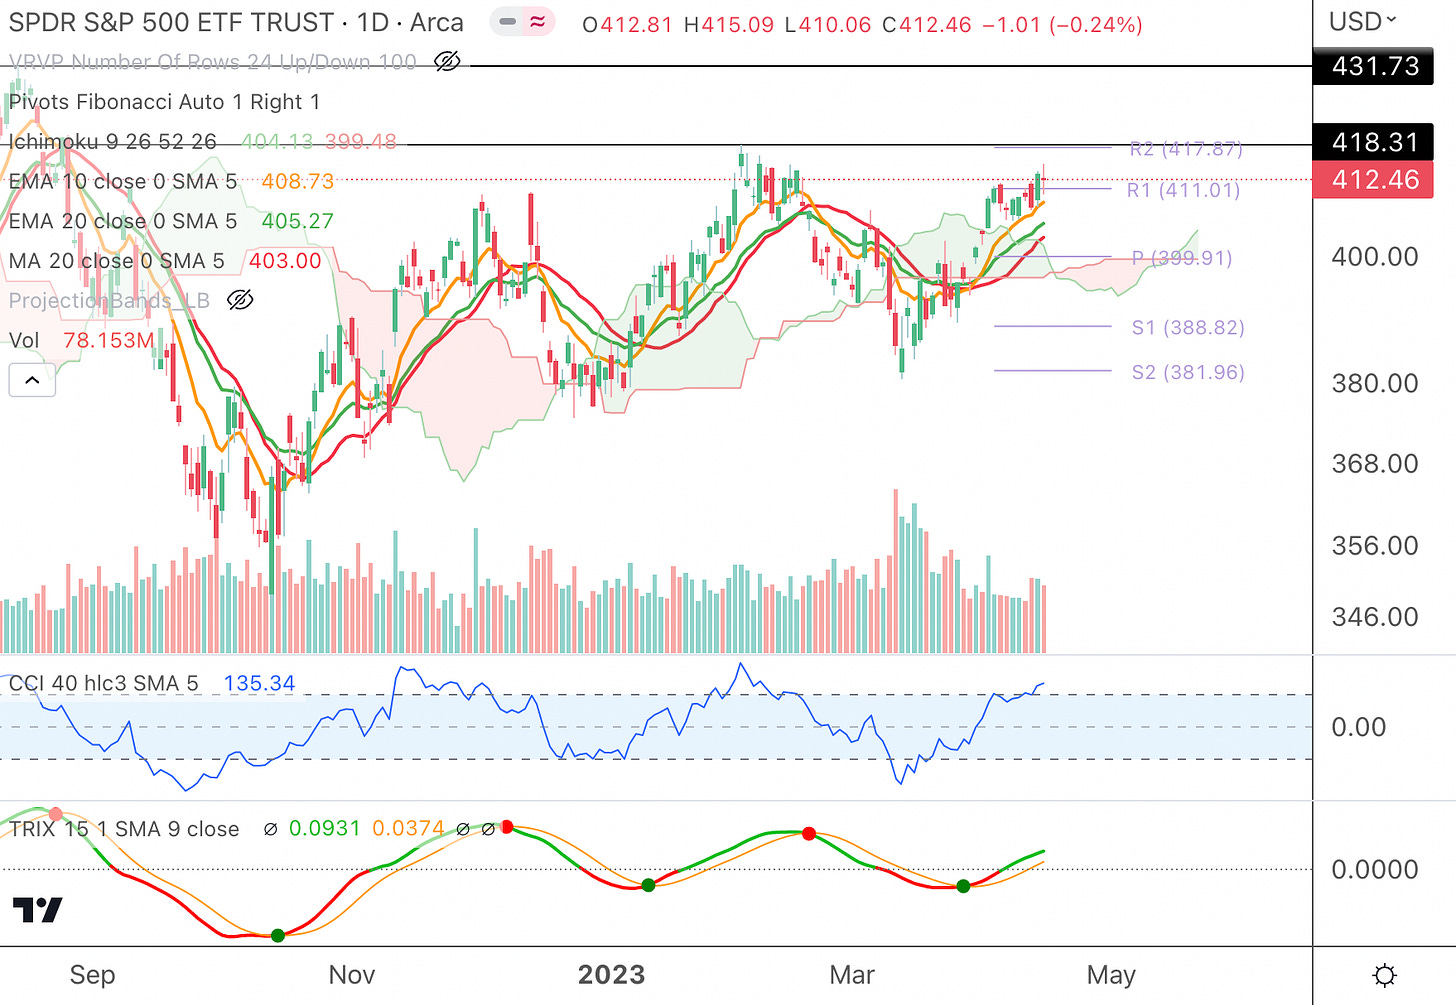
S&P 500 (SPY): SPY is in an uptrend and successfully bounced off the 10 EMA last week showing strength. It is trading above the R1 Pivot Point and the R2 Pivot point at $418 is a logical next stop and is also the February high. The CCI is still in an uptrend, but a drop below the 0 mark could signal that the uptrend is over. The TRIX indicator is bullish and does not seem close to making a bearish crossover yet. A continued uptrend to the $418 and $431 (August 2022 high) appears likely.
Although it is more important to trade the technical chart in front of you, cycle forecasts could provide forward guidance on possible trend changes. Although they are not always correct, knowing the cycles can help you plan for trades. Here are a few possible trades:
Now to 4/24 - Both the Cycles Composite (CC) and Seasonal Cycle (SC) are in up-cycles until 4/24. Pullbacks to the 10 or 20-day moving averages could be possible long trades. From 4/24 to 5/2 the CC forecasts a small pullback, but the SC continues higher until 5/2. This difference could provide for more choppier price action.
5/2 to 5/11 - The CC shows an up-cycle, but the SC shows a down-cycle. If a long trade is taken, having a stop-loss order or limited risk options trade could protect from volatile price action if price follows the SC.
5/24 to 6/5 - Both the CC and SC point to up-cycles. A stronger uptrend is possible here. Be sure to protect profits around 6/5.
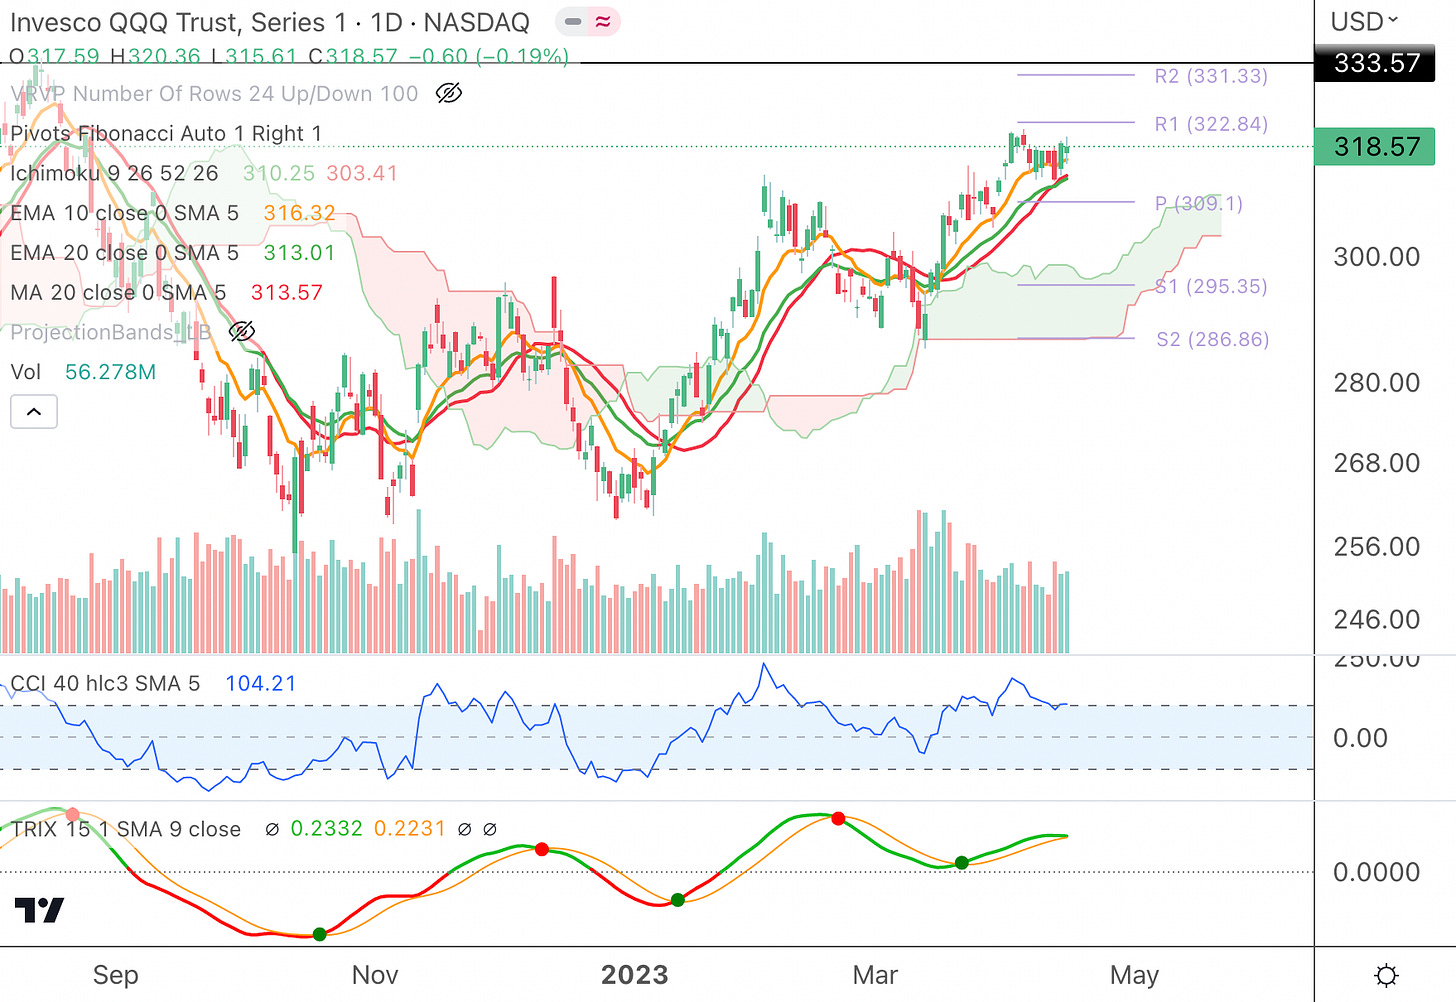
Nasdaq 100 (QQQ): QQQ tested the 20 EMA but managed to bounce. Although volume does show some profit-taking, it does not show investors rushing to sell. As long as it stays above the 20 SMA (red line) the odds are in the favor of it reaching the $323 R1 Pivot Point and perhaps even to the $331 R2 Pivot Point. The August 2022 high at the $333 level could also pose as stiff resistance. The CCI is still in an uptrend, but a drop below 0 could be a warning of trend change. The TRIX indicator does show trend exhaustion and looks ready to make a bearish crossover.
The cycles show these possible trades:
Now to 4/25 - Both the CC and SC are in up-cycles. A pullback is possible from 4/25 to 5/4. This could coincide with the exhausted TRIX indicator.
5/4 to 5/15 - The CC shows a slight up-cycle, while the SC shows a down-cycle. A choppy, unsure uptrend is possible. If price follows the SC a sell-in-May selloff could occur.
5/22 to 6/6 - The CC and SC both show strong up-cycles so a tradeable rally is possible here. Be sure to protect profits close to 6/6.
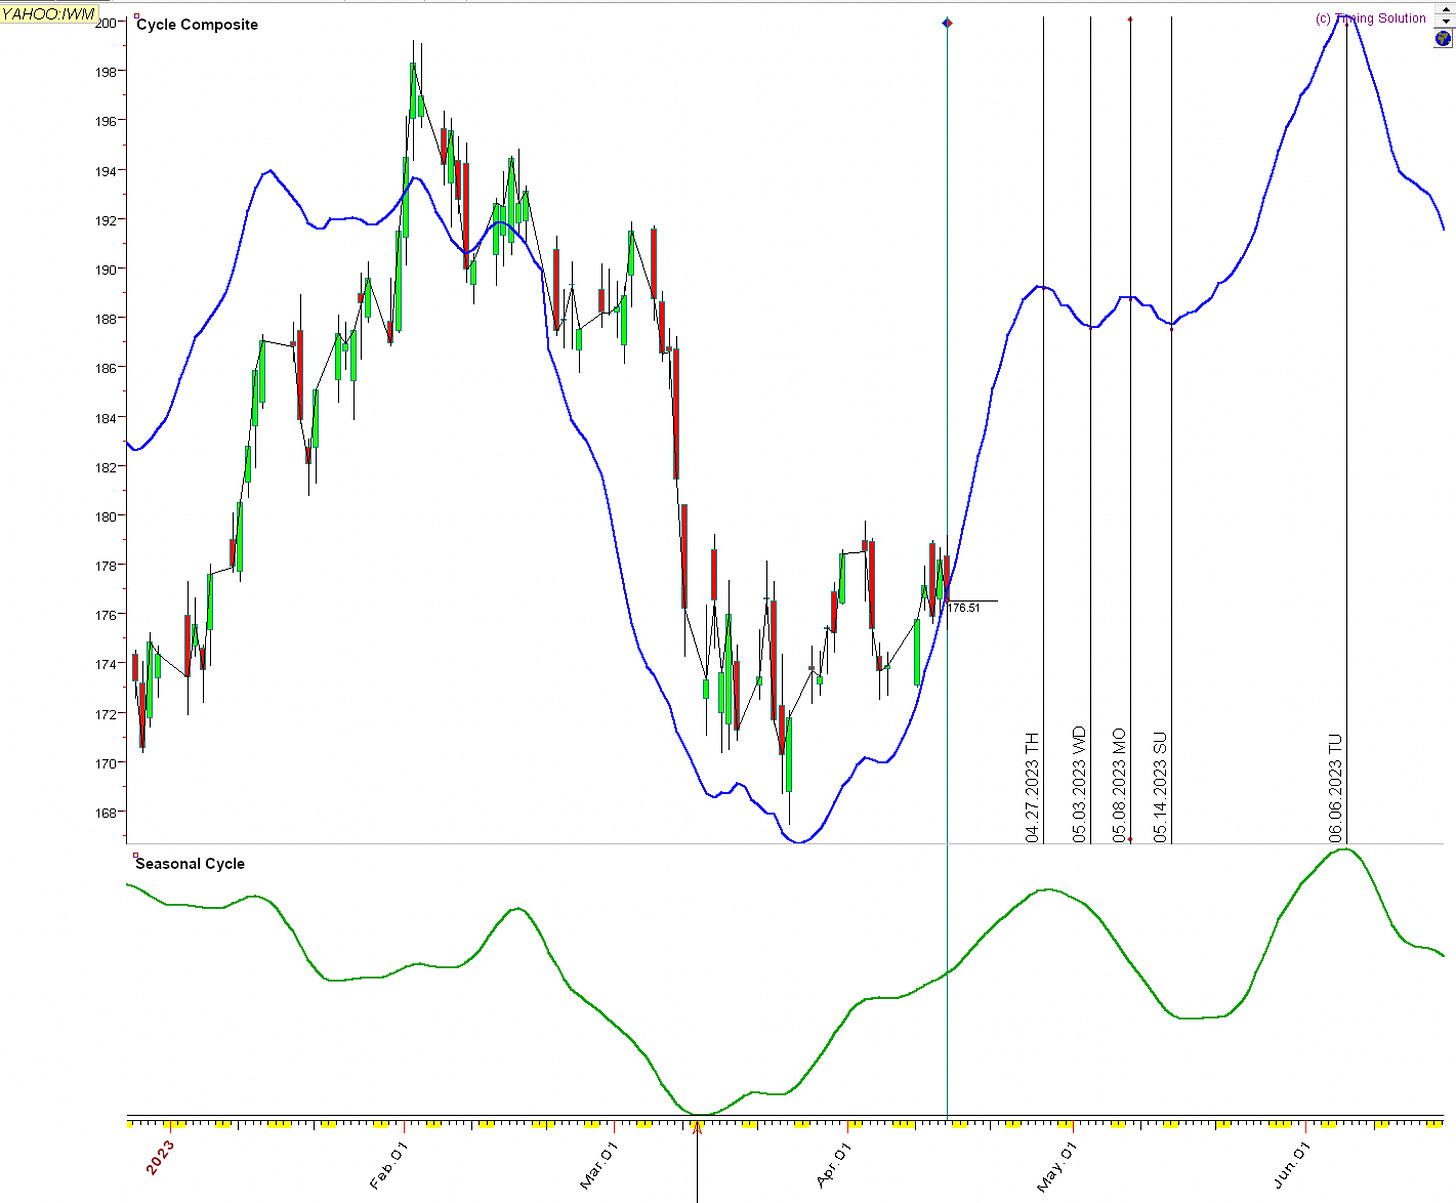
Russell 2000 (IWM): The Russell 2000 is the laggard of the indices due to it’s exposure to finance and regional banks. Price action is forming a bear flag under the Ichimoku Cloud, however price is over all moving averages. A continued uptrend is possible, but if regional bank earnings come in weak, another leg down is possible. The CCI indicator is below 0 showing weakness. The TRIX indicator made a bullish crossover but is still below 0. IWM is not the picture of strength. Let’s see what the cycles forecast.
Now to 4/27 - The CC and SC both show up-cycles. So far, price action is not convincingly strong. The cycles may be propping up the downwards pressure in IWM and forming a choppy sideways consolidation.
4/27 to 5/14 - The CC shows a sideways consolidation while the SC shows a down-cycle. If IWM breaks below the 20 SMA, a short trade could be possible.
5/14 to 6/6 - The CC and SC both have up-cycles during this timeframe. A long trade could be warranted, especially if regional bank earnings come out okay.
Dow 30 (DIA): DIA is above all moving averages and the Ichimoku Cloud, but it may be at resistance, as it is already at the R2 Pivot Point. If it continues higher, $343 and $348 are other resistance levels. The uptrend could continue as the CCI and TRIX do not seem exhausted.
Now to 4/26 - An up-cycle is forecasted to 4/26. At that time, there is a change in complexion as the CC and SC go sideways.
4/26 to 5/10 - The CC points higher but the SC begins rolling over. A weak rally is possible.
5/10 to 5/24 - The CC and SC both point to down-cycles. A short trade is possible.
5/24 to 6/6 - The CC and SC both point higher. This appears to be a retracement of a downtrend however. If a long trade is taken, risk should be limited with a tight stop loss order.
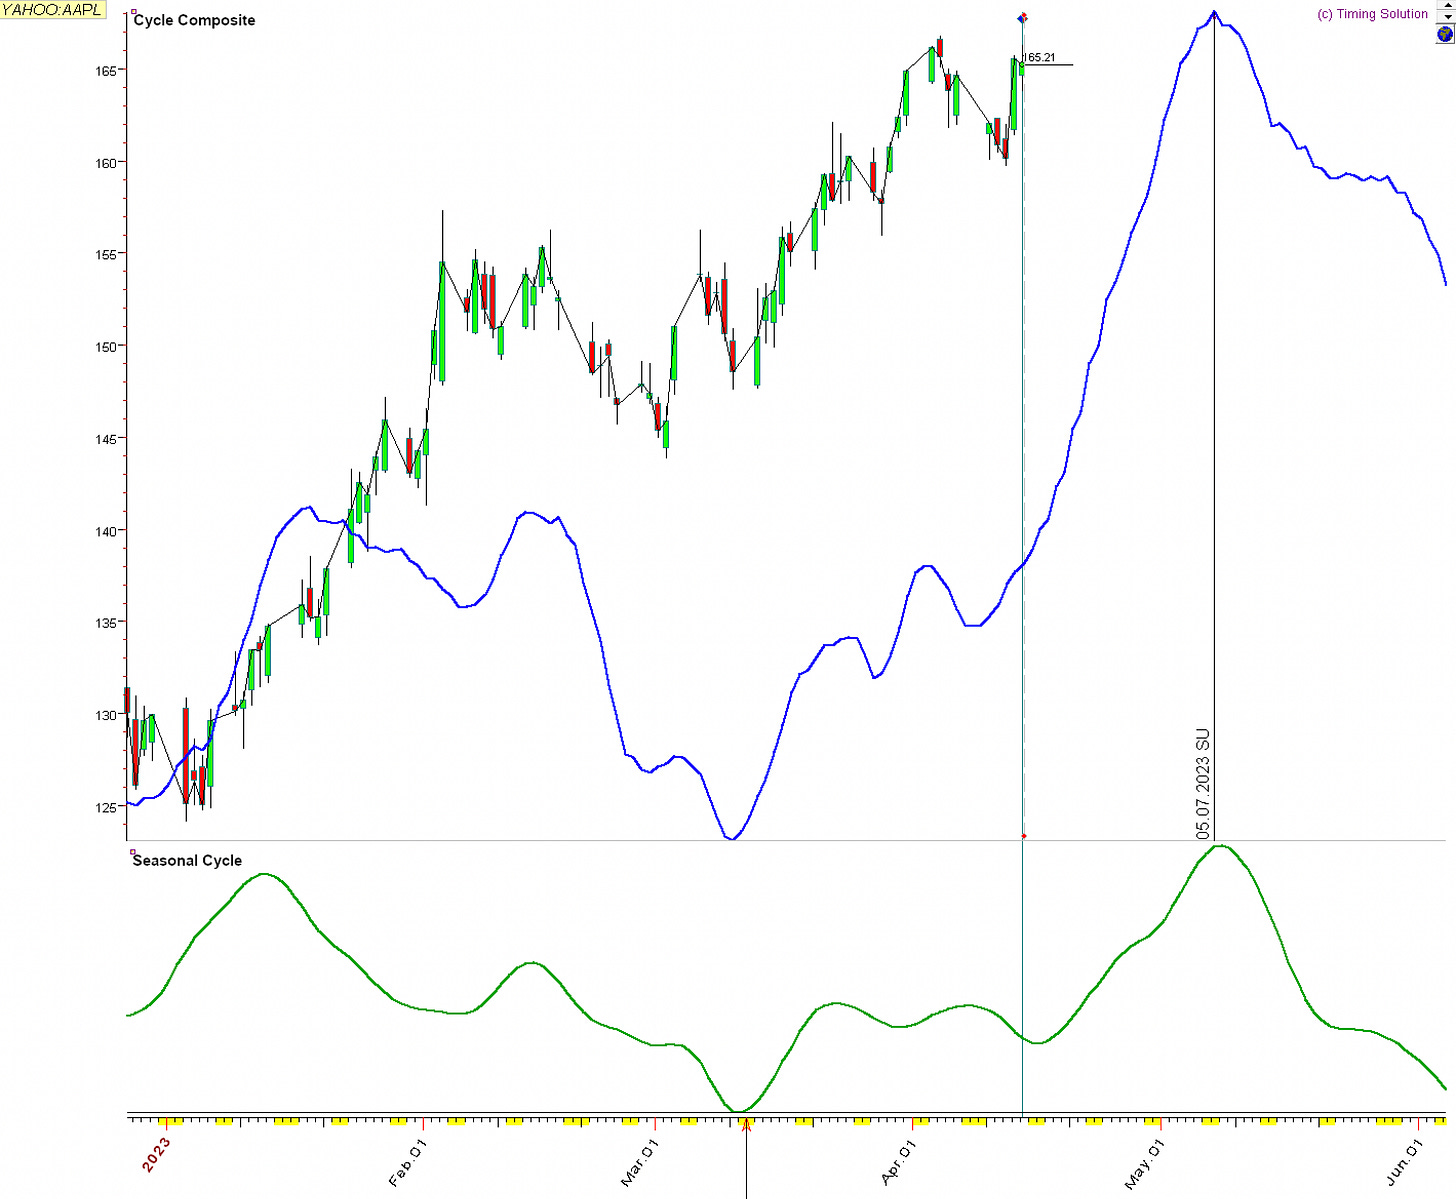
Apple (AAPL): Apple is in an uptrend above all moving averages, however the TRIX looks like it wants to make a bearish crossover. It is at the R1 Pivot Point. If it has more gas in the tank, it could get to the R2 Pivot Point at $171 or the $176 resistance level from the August 2022 high.
Now to 5/7 - AAPL is in an up-cycle until 5/7. At this point in time the CC and SC roll over hard. A short trade could be considered around 5/7, especially if price actions trends below the 10 and 20 EMAs.
Amazon (AMZN): Amazon has noticeable relative weakness to the SPY and QQQ. Amazon is a consumer-focused business and weakness in retail spending could be the driver behind it’s relative weakness. Nonetheless, it is above the Ichimoku Cloud and all moving averages. The TRIX does look like it wants to make a bearish crossover. Earnings will be reported on 4/27 and it is possible that the stock price to become volatile. The options market is pricing in an $8.57 move on earnings, which could possibly bring it to close to the $114 resistance level or down to the R1 Support Pivot Point. Let’s see what the cycles say.
Now to 4/25 - The CC and SC are in up-cycles until 4/25, but both seem to reverse into sharp down-cycles afterwards. It is possible that AMZN rallies before earnings, but then drops and starts a downtrend after the earnings release on 4/27.
4/25 to 5/20 - Both the CC and SC are in down-cycles. Short trades could be considered here.
5/20 to 6/5 - The CC and SC have up-cycles, thus as tradeable move is possible.
6/12 to 6/19 - Another tradeable move is possible here, but range expansion seems muted on both the CC and SC.
Similar analysis for GOOGL, META, MSFT, NFLX, and TSLA are available to paid subscribers. At $9.99 a month, give it a try.


