There are key type of chart patterns, namely, continuation patterns and reversal patterns. These can either be bullish or bearish. What do we mean by this? Well, continuation patterns act in the direction of the trend, so when the trend is bullish then bullish continuation patterns are formed and vice-versa. Similarly, reversal patterns are structures that are formed when the trend is reversal from one direction to another, so either from bullish to bearish or vice-versa. The best part about these patterns is that they occur on every timeframe, so one can use them based on their investing/trading timeframe preference.
This article covers 6 basic continuation patterns:
1. Bull flag
2. Bear flag
3. Pennant
4. Ascending triangle
5. Descending triangle
6. Price channel
In a follow up Educational Article next week (for Paid Members only), we’ll cover 7 key reversal patterns. A key point to note is that, in general, continuation patterns are safer in nature since they are in the direction of the trade, but reversal patterns hold significantly higher profit potential, given that the investor/trader is betting on a trend change (contrarian approach) that can end up catching a lot of investors/traders off-guard (except the ones that were betting on the trend change).
In order to keep this article “to the point” we’ll follow a bullet point structure, so that everyone can have this information in a very quick skimmable manner. Now, let’s dive into the 6 basic continuation patterns.
Bull Flag
Characteristics:
1. Bullish continuation pattern
2. A strong up move occurs that forms the pole of the flag
3. Price then consolidates that forms the flag part
How To Play It:
1. Breakout point is a confirmed candle close above the top resistance of the flag
2. Target is the flagpole distance that is measured from the breakout point
3. Stop-loss is placed below the support line of the of the flag consolidation
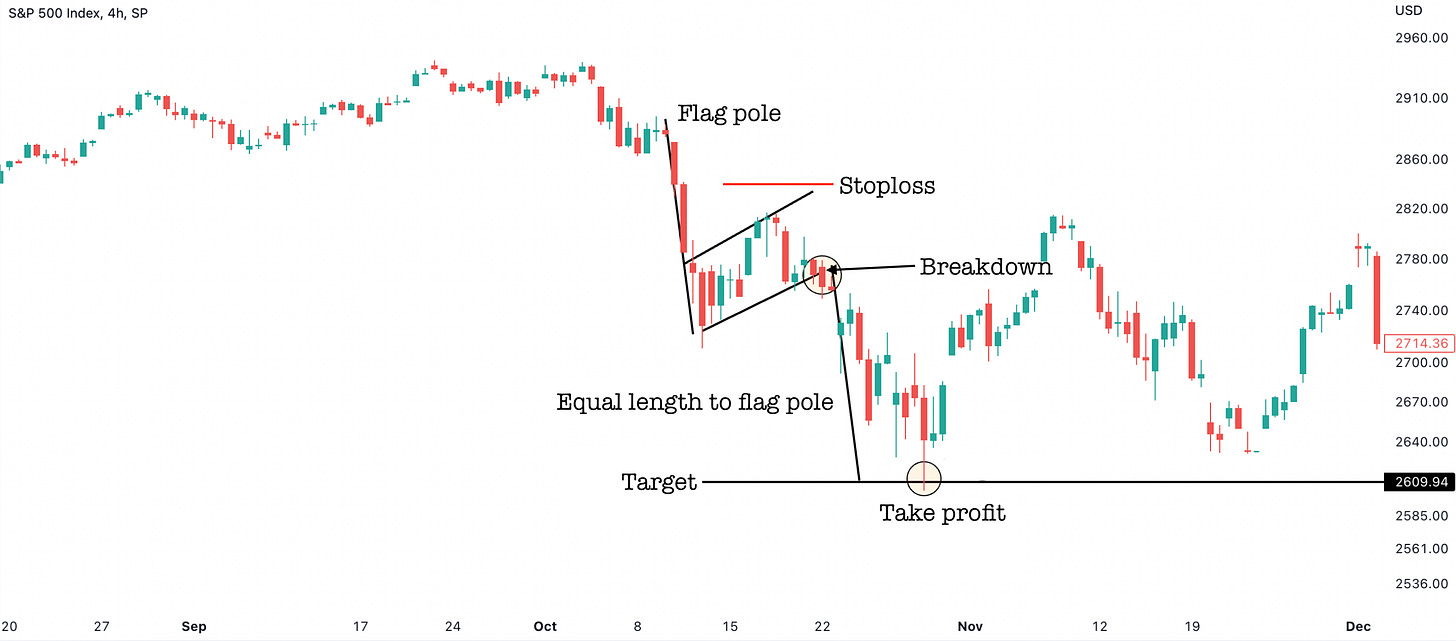
Bear Flag
Characteristics:
1. Bearish continuation pattern
2. A strong up down occurs that forms the pole of the flag
3. Price then consolidates that forms the flag part
How To Play It:
4. Breakdown is a confirmed candle close below the bottom support of the flag
5. Target is the flagpole distance that is measured from the breakout point
6. Stop-loss is placed above the resistance line of the of the flag consolidation
Pennant
Pennants follow the same principles as the flag pattern i.e., there are bull pennants and bear pennants, similar to bull flags and bear flags. The main difference between the two is the type of consolidation that happens: Flag patterns consolidate in a range type format, whereas, pennant patterns consolidate in a pennant/triangle shaped format.
Ascending Triangle
Characteristics:
1. Bullish continuation pattern
2. Horizontal resistance line
3. Ascending support line
How To Play It:
4. Breakout point is a confirmed candle close above the horizontal resistance
5. Target is the widest distance in the ascending triangle measured from the breakout point
6. Stop-loss is placed below the ascending support line
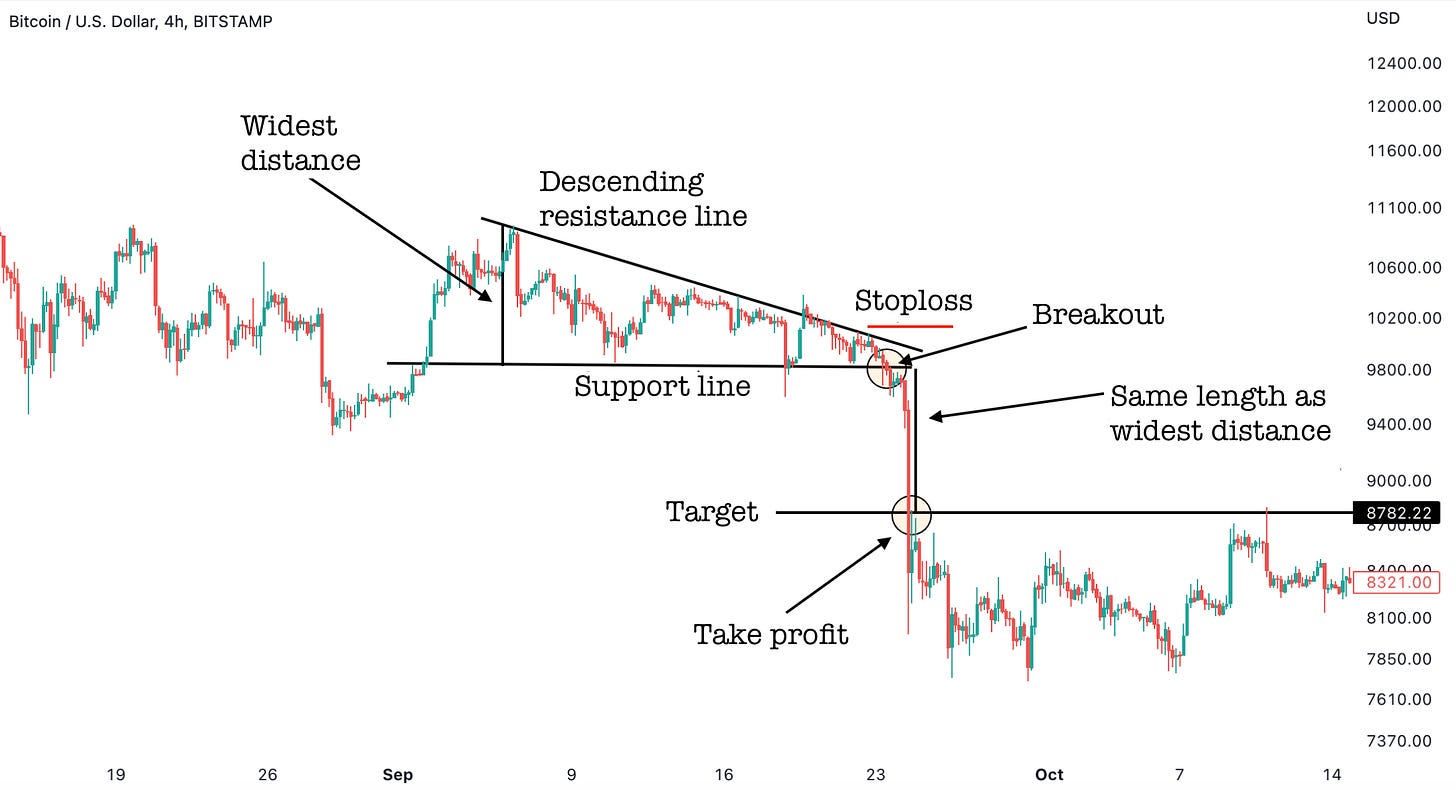
Descending Triangle
Characteristics:
1. Bearish continuation pattern
2. Horizontal support line
3. Descending resistance line
How To Play It:
4. Breakdown point is a confirmed candle close below the horizontal support
5. Target is the widest distance in the descending triangle measured from the breakdown point
6. Stop-loss is placed above the descending support line
Price Channel
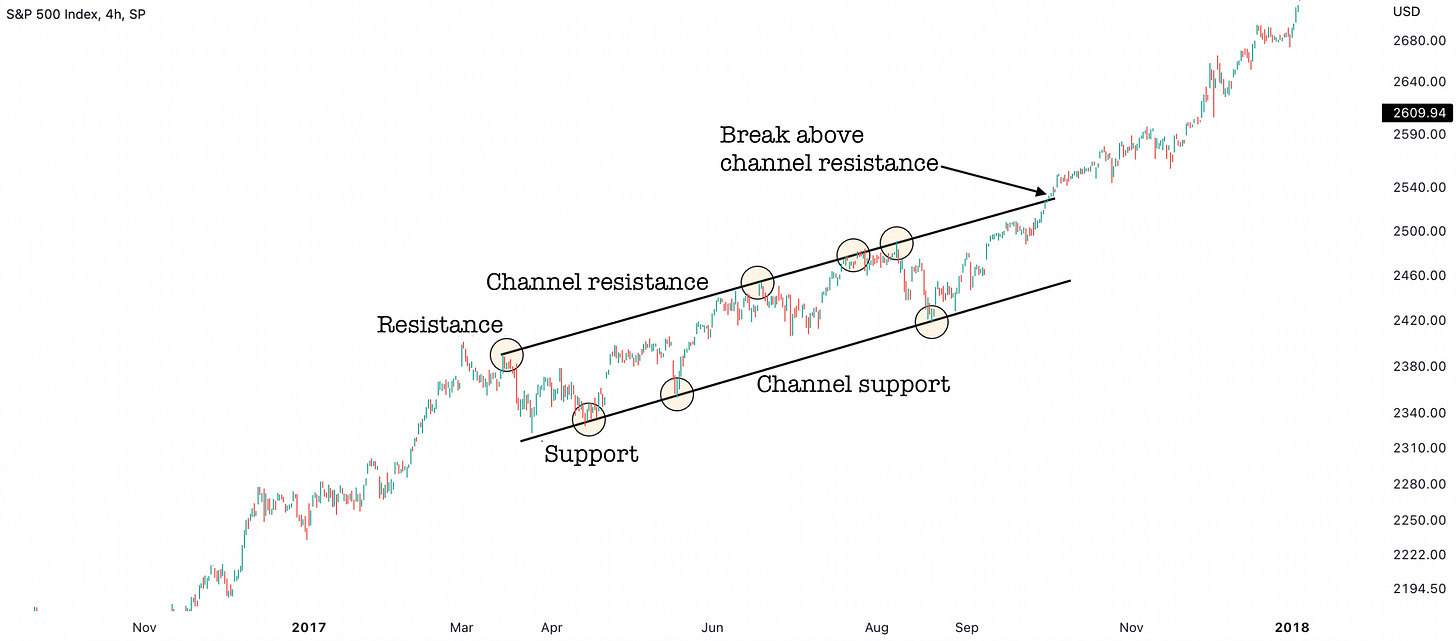
A price channel technical pattern is formed when the price of an asset moves within two parallel lines on a chart. These can be bullish (rising price channel), bearish (falling price channel), or neutral/ranging (horizontal price channel). A break of the price channel in either direction is a very telling sign. If price breaks in the direction of the trend then price often starts to get more aggressive in the direction of that trend. Below is an example of a rising price channel, along with a breakout in the direction of the trend. The same concept applies for falling price channels.
However, a break in the other direction i.e., price breaking downwards from a rising price channel or breaking upwards from a falling price channel acts as a warning signal for that particular trend.
We hope you enjoyed this Educational Piece on Continuation Patters. Next week, we’ll have 7 Reversal Patterns in a similar format in order to help you learn the basics of these important repeating technical patterns. Until next time!
Disclaimer - All materials, information, and ideas from Cycles Edge are for educational purposes only and should not be considered Financial Advice. This blog may document actions done by the owners/writers of this blog, thus it should be assumed that positions are likely taken. If this is an issue, please discontinue reading. Cycles Edge takes no responsibility for possible losses, as markets can be volatile and unpredictable, leading to constantly changing opinions or forecasts.


