Crypto has been making a comeback, but investors are still skeptical of this move. That’s exactly the type of move that typically has more legs as eventually more and more investors flip from being bearish or uncertain into finally joining the uptrend. This article goes over why we believe Bitcoin is nearing a big move up and the cycle top is not yet in.
Bitcoin Technical Analysis
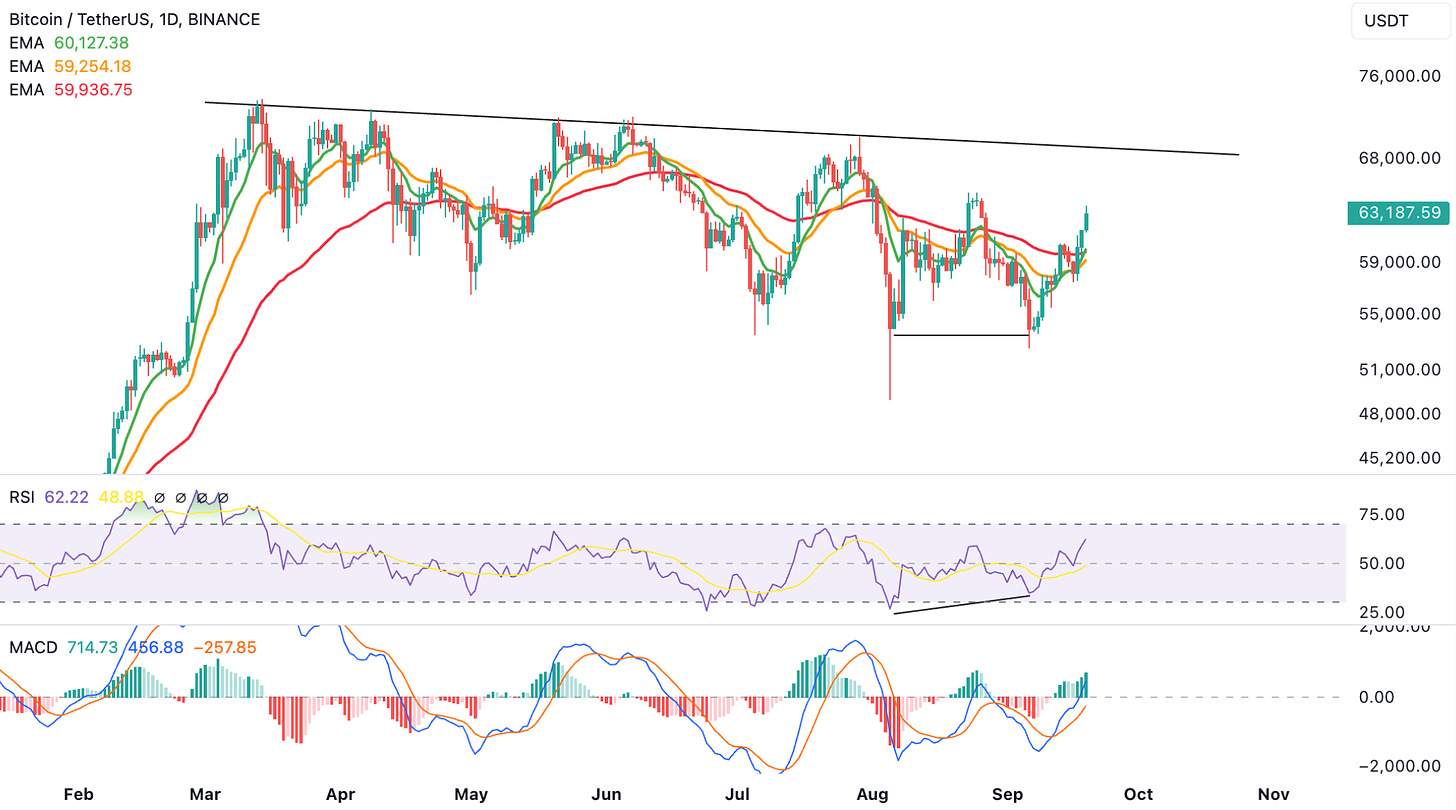
Bitcoin has formed two equal lows on a daily closing basis (5th Aug and 6th Sept), alongside a higher low on the daily RSI and MACD. This is a classic double bottom with a bullish RSI divergence, which shoot the price to around $63k already.
During this process, Bitcoin has reclaimed the daily 9, 21 and 55-daily EMAs, alongside a bullish MACD and RSI back in the bull zone. The next real resistance is at $69.5k, which is the downtrend line that’s kept a lid on the price since March 2024. A break of this level would signal all clear sign, indicating new ATHs is next. On the downside, the key level to hold now is the 5th Aug and 6th Sept closing low at $53.8k.
Ethereum Technical Analysis
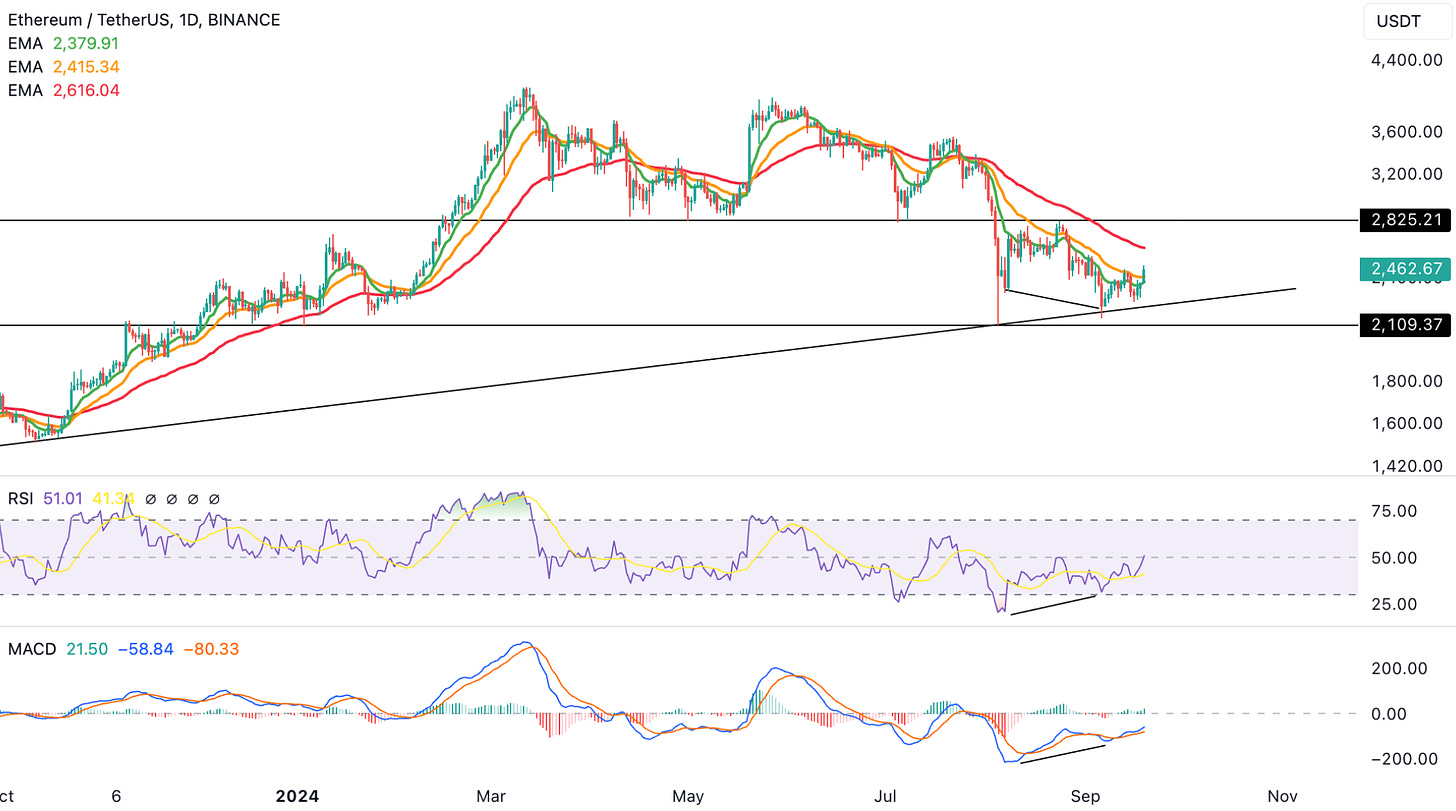
Similar to Bitcoin, even Ethereum has formed a daily bullish RSI and MACD divergence, alongside finding support on its key uptrend line. Price has reclaimed the daily 9 and 21-EMAs, but the daily 55-EMA (around $2615) is yet to be reclaimed.
The key level we’re interested in is $2825. If Ethereum is able to reclaim this lost support, then we’re confident that Ethereum would make another run at the $4000 resistance level. The timing of when this is likely is the tricky, but if we had to choose then we’d strongly lean towards Q4 2024 being that high probability period.
Intermarket Analysis – USD ($DXY) Weakening
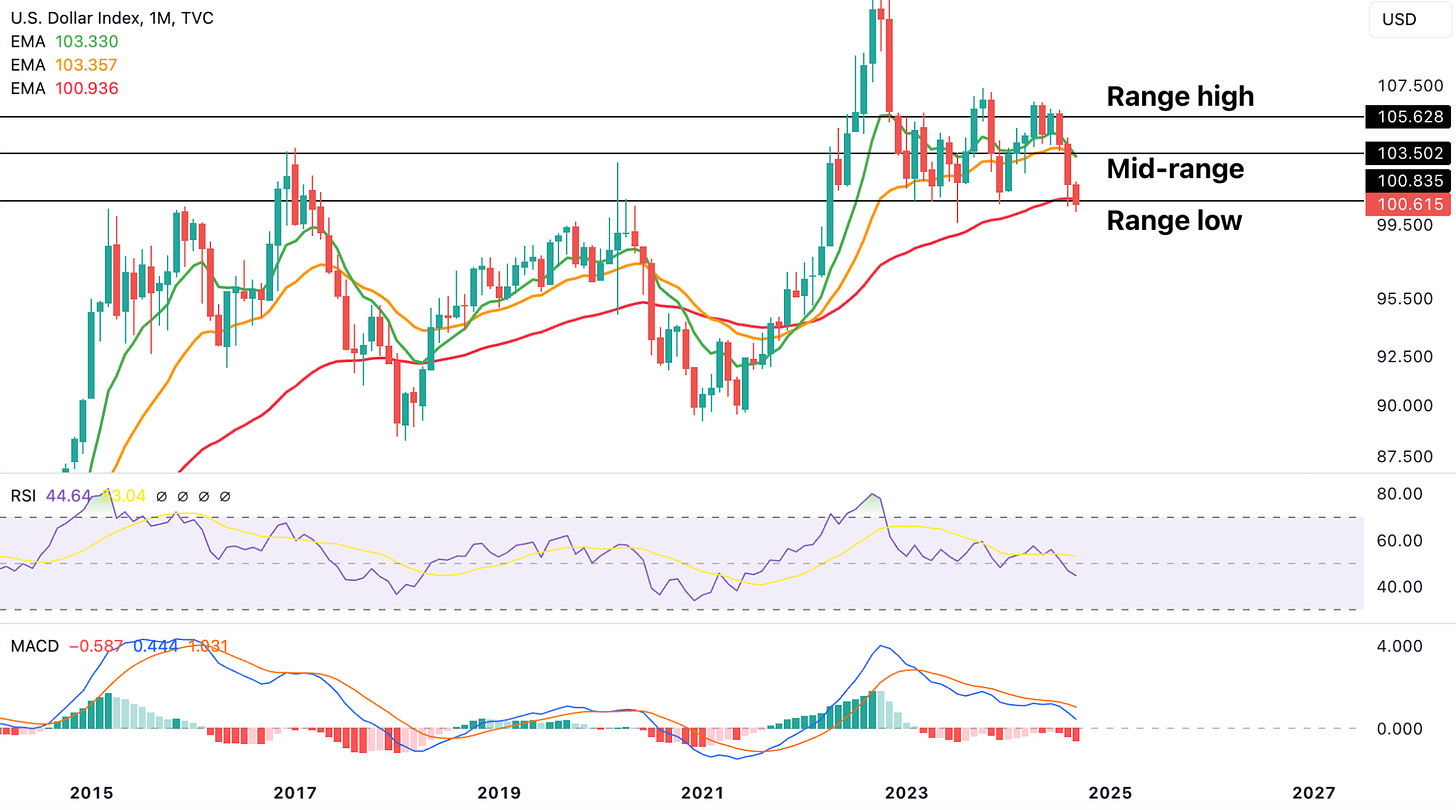
One key reason behind our bullishness on Cryptos is the significant weakness in USD ($DXY). This monthly close is going to be quite telling for the Dollar because if the monthly closes below 100.83, then it’s going to lose its range low + monthly 55-EMA, both of which signaling that further downside continuation is the likely path (our base case for now). Remember, a bearish Dollar is good for risk-on assets as a general rule of thumb.
There’s Still More Upside
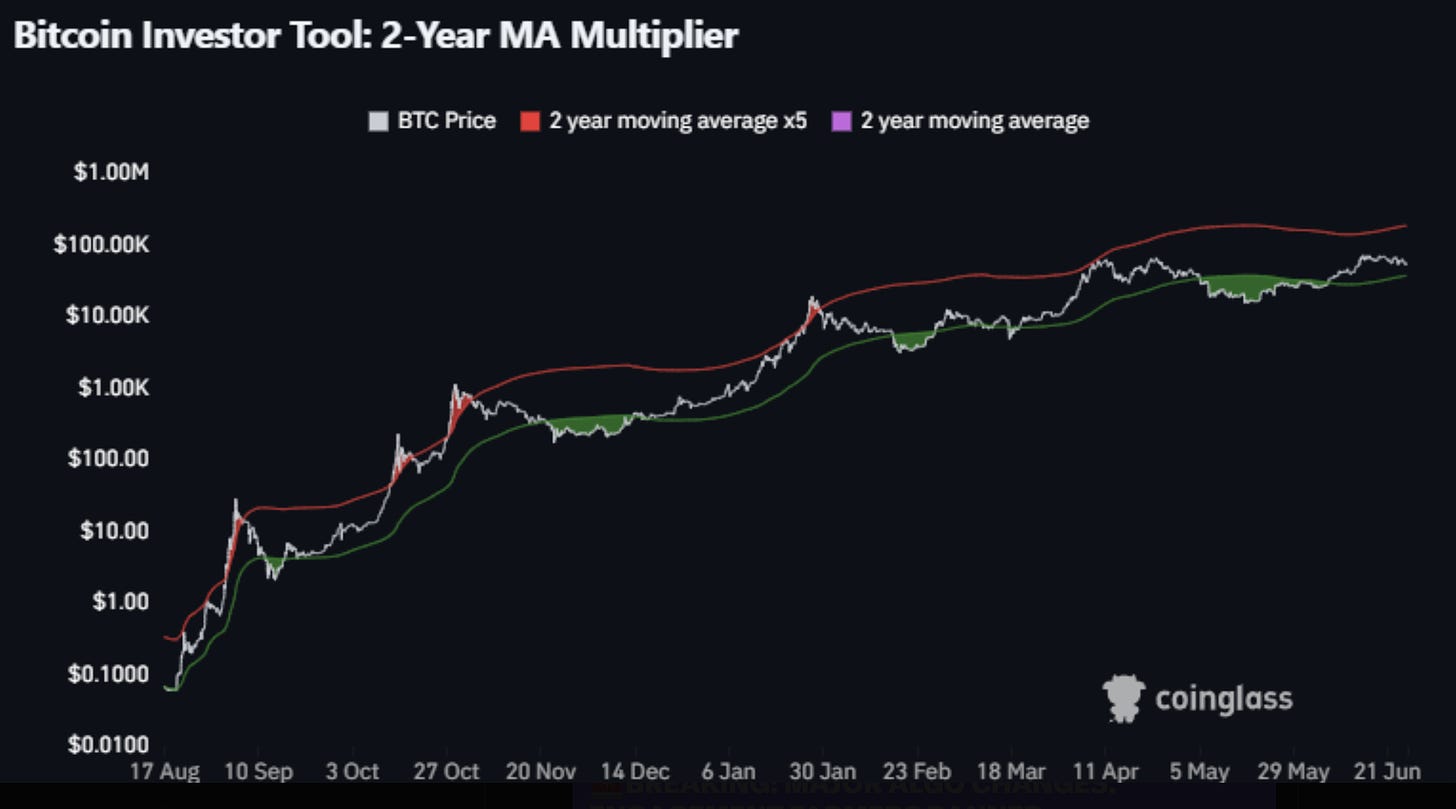
This is another chart that you can add to the mix showing that Bitcoin still has more upside left for this bull cycle. The lower line is the 2-year MA and the upper line is the 2-year MA multiplied by 5.
2-year MA Multiplier has historically showed good spots for cycle lows & tops. Any time below the bottom line is usually a good time to accumulate. Conversely, when Bitcoin gets close to the top line, it's near its cycle highs.
In this cycle, Bitcoin has still not reached close to the red line, indicating that there’s still room for significant upside (most likely at least reaching the $100,000 mark at a minimum). We’ll fine tune our targets and provide it to our paid members first as soon as we’re back in new ATH territory.
Next up, we’ll take a look liquidity conditions in the Premium Section. This is a key component for the entire Crypto market. We’ll also analyze Bitcoin’s seasonality along with providing our proprietary Cycle Forecasts. Lastly, we’ll present you with 2 Money Making setups – one is a Crypto-related stock play and the other is an altcoin play.
Find our membership cost/benefits below. If you’re serious about Making Money (our primary goal at Cycles Edge), then the Premium Sections are key for you!
Liquidity Conditions


