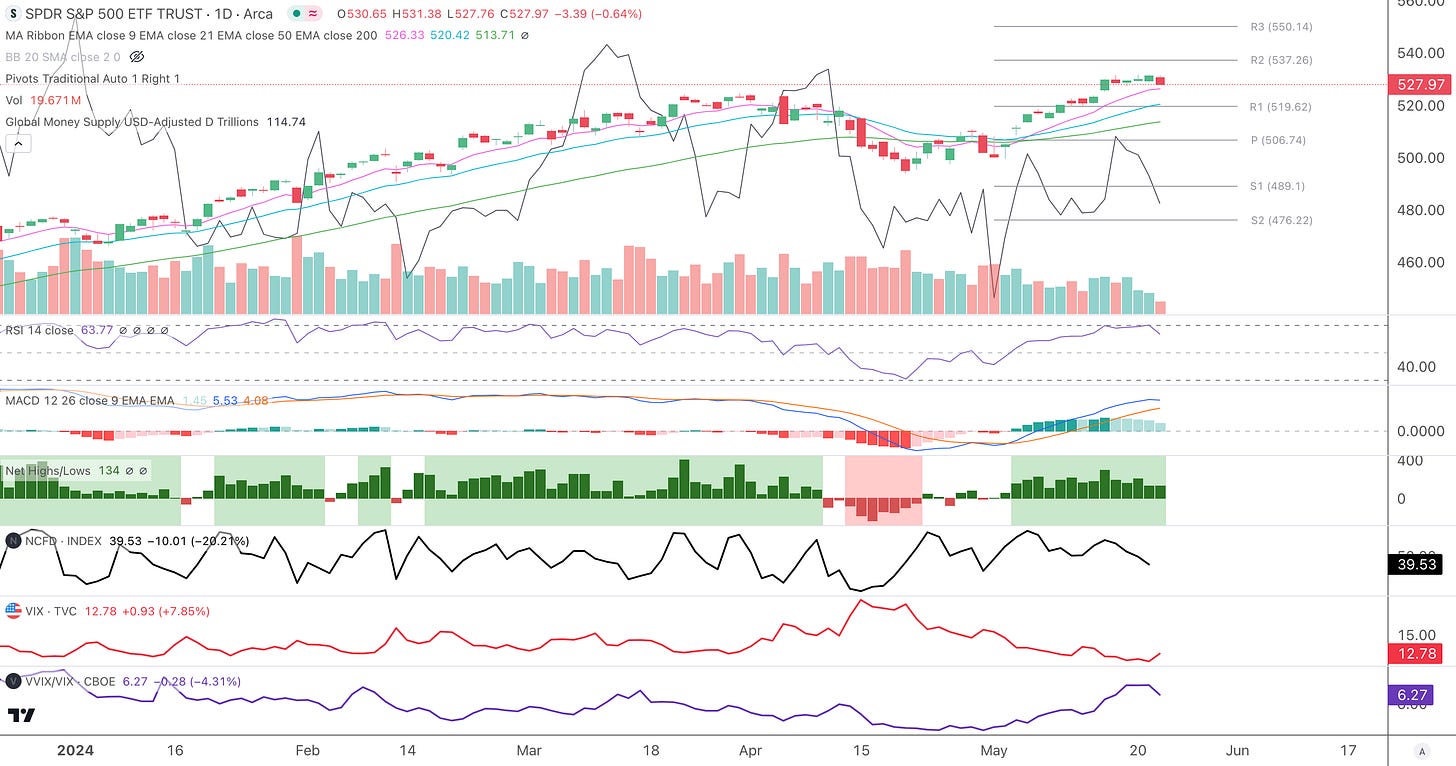
The stock market is like a deer in headlights right now waiting for NVDA’s earnings report, which will be reported after the close today 5/22. The options market is pricing in a $77 move (about 8%) in NVDA stock to the end of the week (5/24 expiration option). This is probably going to be a market moving event and unfortunately it occurs after the close, thus if one’s portfolio is heavily weighed in high-beta tech stocks and NVDA gaps down $77 it could be painful. On the other hand if NVDA gaps up $77, it could be a hefty gain. This is the dilemma with binary events. Most portfolio managers and traders reduce or exit positions going into a binary event and this is seen as a responsible portfolio management. You can see from the Nasdaq McClellan Oscillator that breadth has taken a breather going into this binary event.
Perhaps an earnings drop for NVDA creates a buy-the-dip opportunity for the market. This is possible as the Nasdaq McClellan Summation Index, a longer-term breadth indicator, just crossed the 0 mark and has a lot of room to run before it gets to bullish extremes.
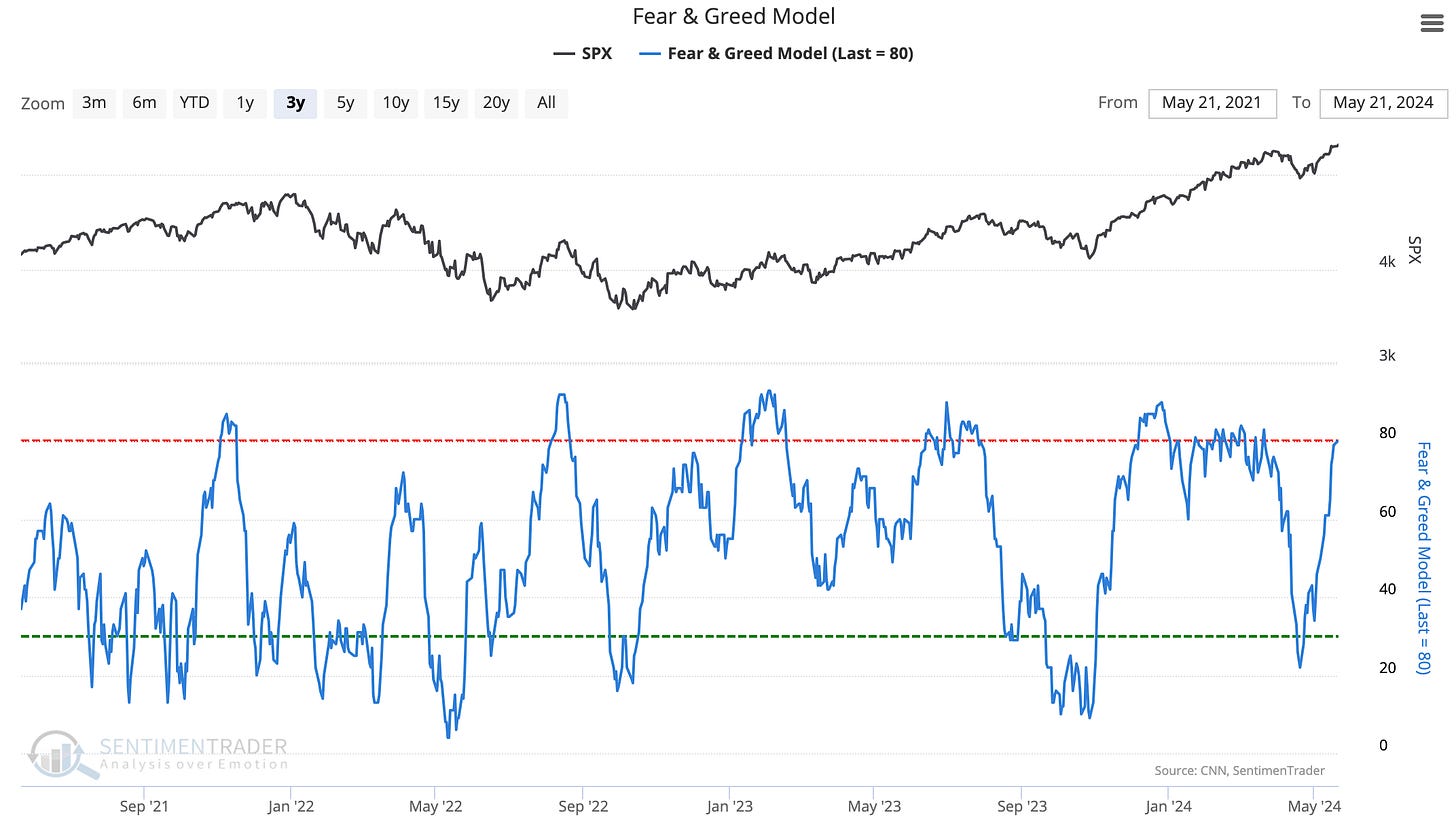
Despite the downtick in breadth, sentiment of the market is quite bullish. You could see from the Fear and Greed Model that we are just touching extreme greed, and the indicator often stays here for 1 to 3 months before reversing (I call this the. “Greed Grind”). If a Greed Grind occurs, this indicator should move sideways for a while.
The chart of the S&P 500 (SPY) is still bullish as it is trending higher above the 9, 21 and 55 EMAs. RSI was a bit overbought, so a pullback to a moving average is normal. Global Liquidity (black line) is declining, so we should be patient and see where this pullback stops. It is still a Swing Traders’ Market as price is above an up-sloping 21 EMA, MACD is above 0 and there are Net New Highs. The Percent of Nasdaq Stocks Above the 5 SMA is falling, which tells us that a buy-the-dip opportunity could be coming. However, while NVDA earnings is looming before us, fear has begun to sneak back in as the VIX increased over 7% today. More importantly, the VVIX/VIX (purple) began to drop and this often accompanies a market decline.
We’ll now go over the setups for NVDA. In part 2 we’ll cover other setups.
NVIDIA (NVDA) is in an uptrend above the EMAs and the Ichimoku Cloud. It is running into resistance near the $974 level. So far it looks like a Triple Top pattern, however it could gap above this level on earnings. Alternatively, NVDA could dip on earnings, find dip-buyers and gather energy for a move above this resistance. The cycle bracket renews on 5/23, right after earnings so we’ll have to look for a change of complexion. The Stochastics indicator is overbought, so a pullback would be a good reset. We mentioned earlier that the options market is pricing in a $77 move. On the downside, that would bring NVDA to the $860 level, which is to the top of the Ichimoku Cloud. On the other hand, a gap up would bring NVDA to the $1014 level where the R2 Pivot Point sits. The best play here is to either use a limited risk options strategy to play earnings or wait for a buyable dip.
Now let’s look at the cycle chart.
Disclaimer - All materials, information, and ideas from Cycles Edge are for educational purposes only and should not be considered Financial Advice. This blog may document actions done by the owners/writers of this blog, thus it should be assumed that positions are likely taken. If this is an issue, please discontinue reading. Cycles Edge takes no responsibility for possible losses, as markets can be volatile and unpredictable, leading to constantly changing opinions or forecasts.


