DIVERGENCE
Something Shady is Going On Under the Surface
If Spiderman were a money manager, his spider senses would be tingling! The stock market shrugged off an early January tax selloff and a higher than expected CPI report, however DIVERGENCES (an early warning sign of trend change) and other warning signs are piling up as the S&P 500 hits resistance. The January Trifecta, although not finished yet, is all bearish so far as the Santa Claus Rally and First 5 Days of January were negative. If January finishes negative than it would not bode well for the market’s performance for 2024. You can see from the chart below that a negative January Trifecta often leads to diminished returns for the year.
Wednesday 1/17 is VIX Expiration Day and Friday 1/19 is Options Expiration Day, which are two events that are often highly volatile and could trigger a pullback.
The Situation: DIVERGENCES Everywhere
The S&P 500 is in a sideways trend at the moment and having a tough time getting above the R1 Pivot Point at $478. It did bounce on the 21 EMA and is now above the 8 EMA as well. Normally when the market is above the 8 & 21 EMAs we’d be bullish. However right now, there are many warning signs and the SPY could be forming a double top. Notice how the Relative Strength Index (RSI) and the TTM Squeeze (momentum indicator) show bearish DIVERGENCE, which is often a precursor to a trend change. The Stochastics indicator hints that the ball will be in the Bears court so next week will be crucial. We do see support lining up at $459, $454, $443 and $435, which could serve as possible buy points.
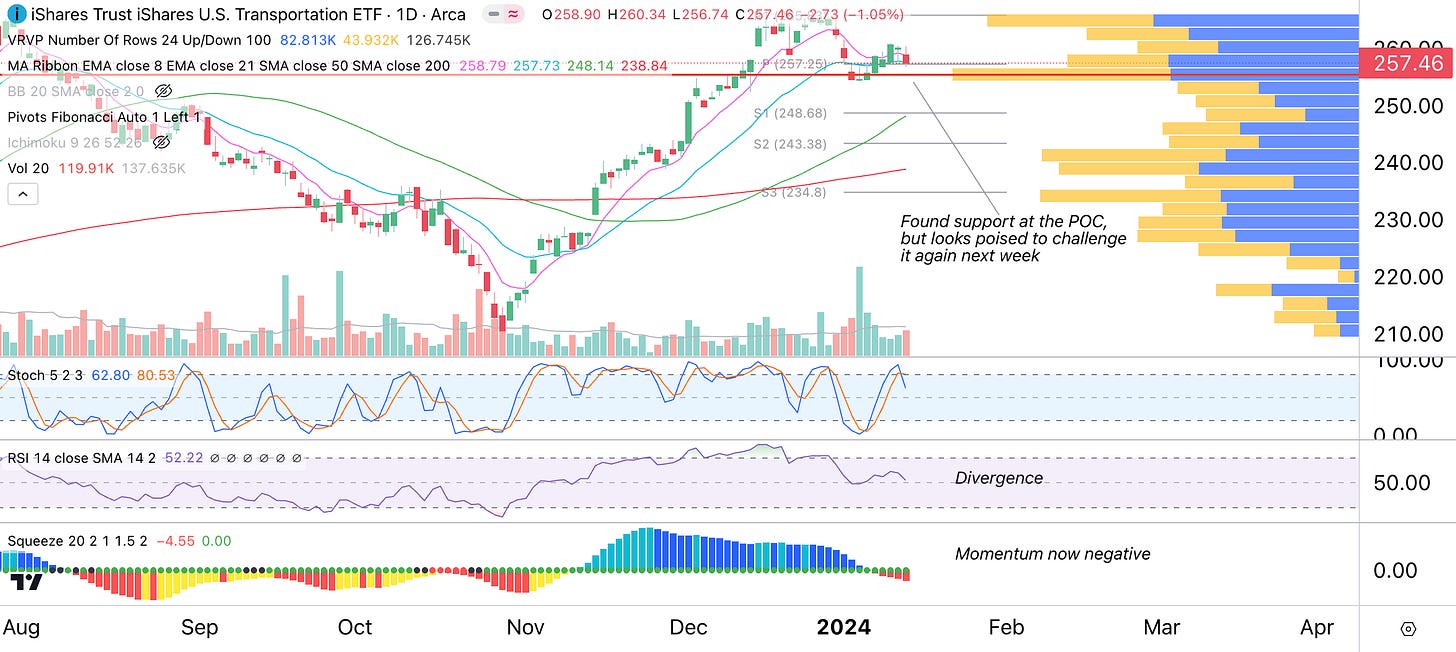
Certain asset classes tend to be leading indicators for the market. According to Dow Theory the greater market tends to follow the transportation sector and Transports aren’t looking that strong. Looking at the chart below, IYT (Transports ETF) is below the 8 and 21 EMAs signifying a loss of its short term uptrend. RSI shows a bearish divergence and the TTM Squeeze shows negative momentum. IYT did find support at the Point of Control (POC or point where the most shares were traded) but it seems ready to test it again next week. If IYT rolls over, it could tip us off that a broader market pullback is coming.
Semiconductors are another leading indicator for the stock market. SMH (semiconductor ETF) formed a lower low as the SPY formed a double top. That relative weakness could be seen as another warning sign of impending trend change. SMH also shows RSI and momentum divergence, even with the strong performance of NVDA last week.
The rally is becoming narrow again as breadth declines. The McClellan Summation breadth indicator warns of a possible reversal.
As breadth declines and the rally narrows, many end-of-2023 assumptions are being disputed. The Equal Weight S&P 500 (RSP) relative to the SPY chart below shows that RSP is lagging and that the majority of stocks are not participating on the upside in 2024. More specifically, 61% of S&P 500 stocks are down year-to-date. This negates the assumption that the rally will broaden to non-Mega Cap stocks in 2024 for now.
Furthermore, the risk-on rally of November/December, where Small Caps were leading fizzled out big-time in 2024. You can see from the relative chart below how small caps (IWM) are very weak relative to large caps (SPY). So much for the Small-Cap boom in 2024 that they hyped up on CNBC.
What is going on under the surface?
Players Analysis: You Hold The Bag…No, You Hold The Bag
It seems like a game of Hot Potato is going on under the surface, where no one wants to be left holding the bag when the market pulls back. Retail Dumb Money is selling out to lock in profits. Smart Money who were late to the party realize that the momentum is gone and are now punting equity exposure.
The Greed Grind appears to be over as the Fear and Greed model is rolling over. This means that market participants are becoming less greedy and becoming more fearful, which is not conducive to a risk-on rally.
The Retail Only Put/Call Ratio shows that on the options front, the stage is set for a rug pull. With retail now heavily invested in call options betting on a continued rally, its the perfect time for Market Makers to drop the market so they don’t have to pay the call option buyers.
In fact you can see from the S&P 500 Commitment of Traders charts below that Market Makers (Dealers) are reducing long positions and increasing short positions. They would profit if they dropped the market and could cover their short positions at lower prices.
And this setup seems to coincide with what the Cycles are pointing to.
Cycles: A Possible Wyckoff Distribution
Our 1Q2024 Cycle Forecast for the S&P 500 (shown below) predicts a double top followed by a pull back occurring after 1/15. The DIVERGENCES, weak leading indicators (IYT, SMH), narrowing breadth and short Market Maker positioning should result in a pullback. If the market is strong enough to defend these negative factors, a “swamped” cycle is possible where it just goes sideways during the down-cycle.
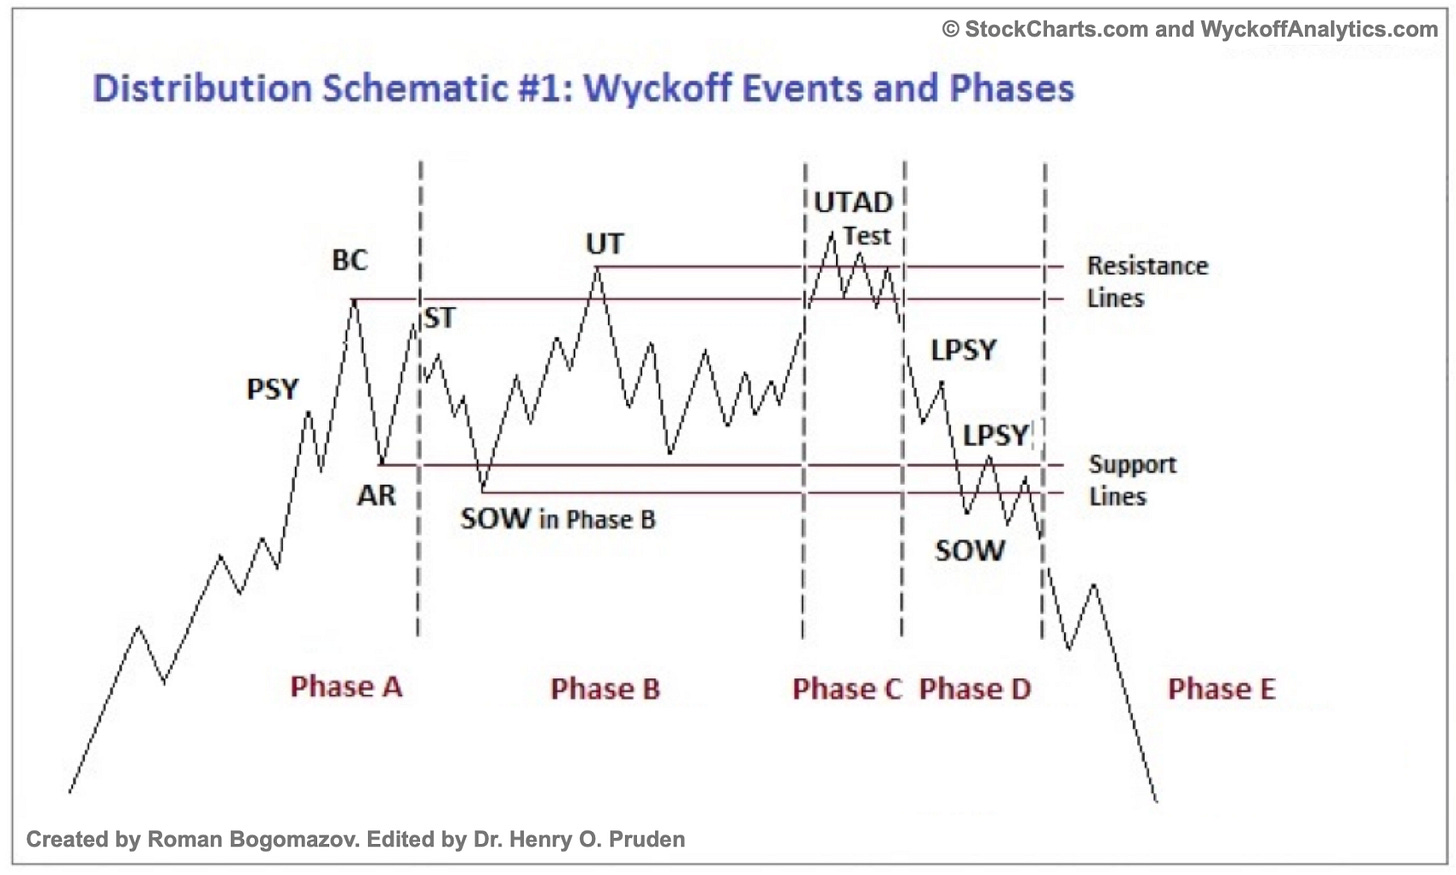
A Wyckoff Distribution Schematic may be playing out and coinciding with our Cycle Forecast. Think of this as a topping pattern. Referring to the chart below:
The December high for the SPY was Phase A and we just experienced a Automatic Reaction (AR) bounce to a Secondary Test (ST), and this could be the double top.
The next move down would be a Sign of Weakness (SOW), which could bottom between 1/29 to 2/8.
An Upthrust (UT) could occur in Early February until 2/29.
Another drop is possible in the first half of March and this sets up for an up move into an Upthrust After Distribution (UTAD) which could last until the end of April or May.
Phase D could start in June where a more sinister downtrend begins. Taking the Presidential Cycle into consideration, this could last until Election Day, which could bring a new uptrend.
Conclusion: Protect Capital and Look for a Better Entry
With everything that we discussed, things are lined up for a pullback. Of course, the market can do anything it wants and it could continue higher, but with retail bullishly positioned with call options, this is less likely. There is a Game Theory side of the market, where the market is designed to rob most participants, not make them rich. An up move is possible to stop-hunt and steal liquidity, which could be followed by a rug-pull. We try to be on the right side of the market when the opportunity is there, but we also become protective of our capital when conditions deteriorate. Conditions don’t look so good right now. Patience will pay, so prepare your watchlist to buy on a pullback.
For Paid Subscribers, we’ll disclose our 2024 Cycle Forecasts for Transports (IYT), Semiconductors (SMH) and Real Estate (XLRE) below.
Disclaimer - All materials, information, and ideas from Cycles Edge are for educational purposes only and should not be considered Financial Advice. This blog may document actions done by the owners/writers of this blog, thus it should be assumed that positions are likely taken. If this is an issue, please discontinue reading. Cycles Edge takes no responsibility for possible losses, as markets can be volatile and unpredictable, leading to constantly changing opinions or forecasts.


