

Dow Theory Divergence - Quick Note
Importance Of The Transportation Sector

A lot of media outlets and analysts have been talking about the Dow divergence in the stock market. But what does this mean and more specifically, what does it mean for the stock market? That’s exactly what we’ll take a look at in this Quick Note!
Dow Theory states that the Dow Jones Industrials (DJIA) and Transportation (DJT) must move together to confirm a trend. If industrials are producing more, transportation should rise too, as goods need to be delivered. If they diverge, it could signal weakness or a trend reversal.
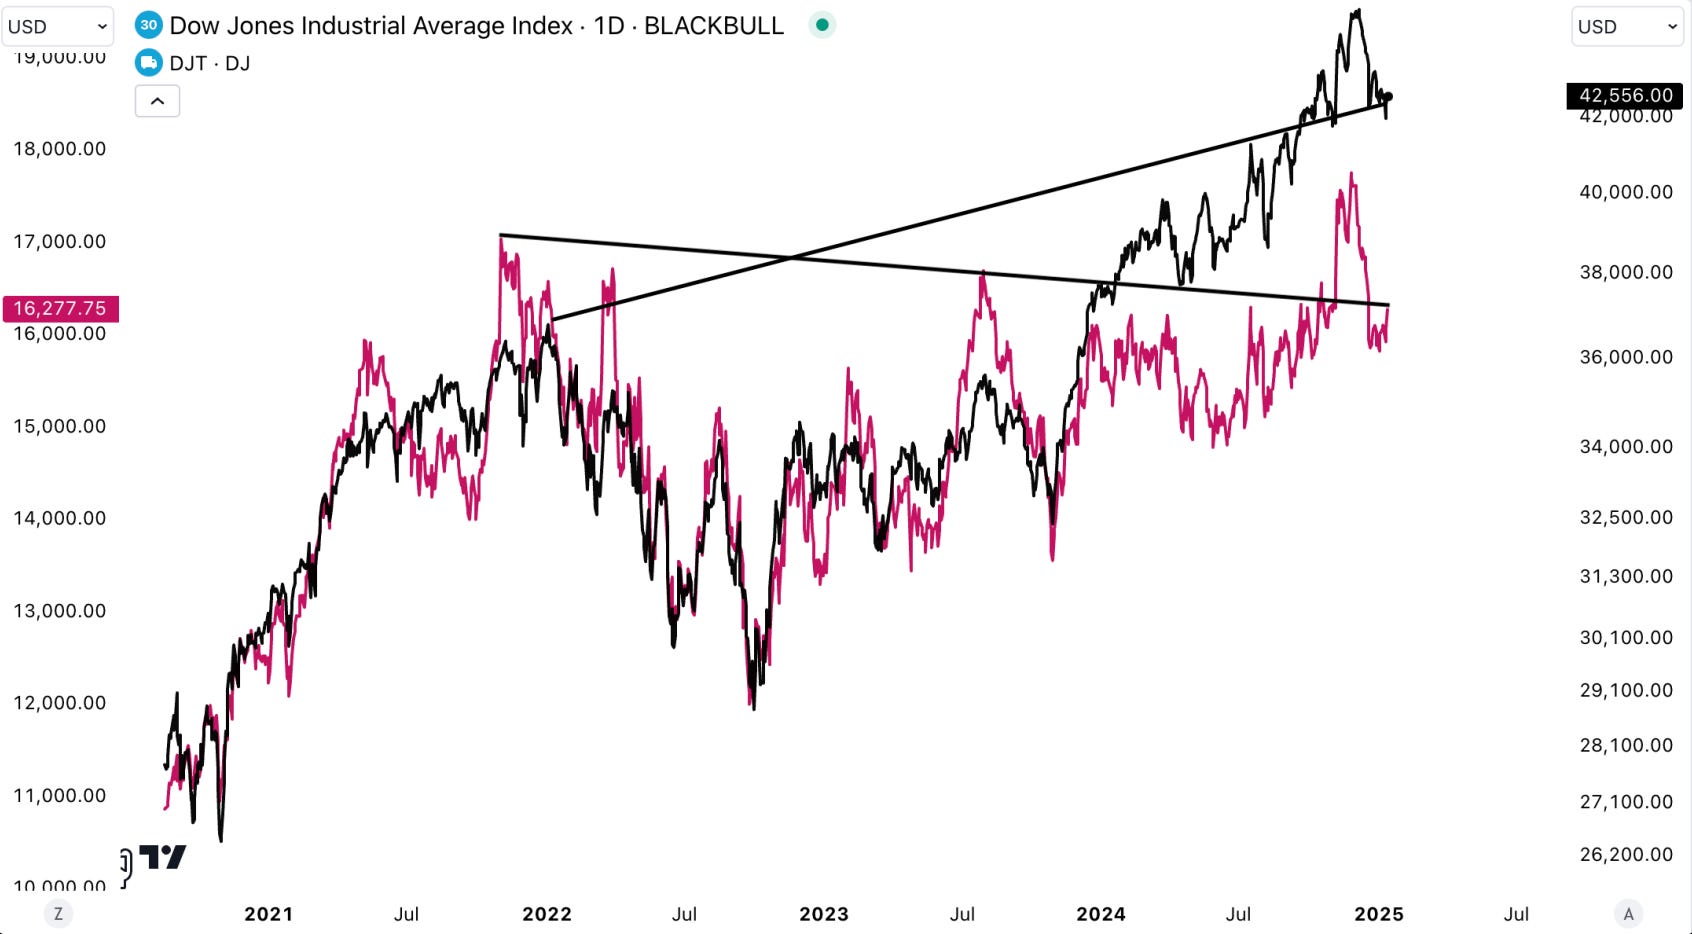
Please note that throughout the analysis below, the black line is the Dow Jones Industrials (DJIA) and the red line is Transportation (DJT).
Notice how in the recent market pullback, the DJIA is still above its previous ATHs from 2021, but DJT is below it right now since the past 1 month. This is typically a warning signal, especially if it lasts for the next few months.
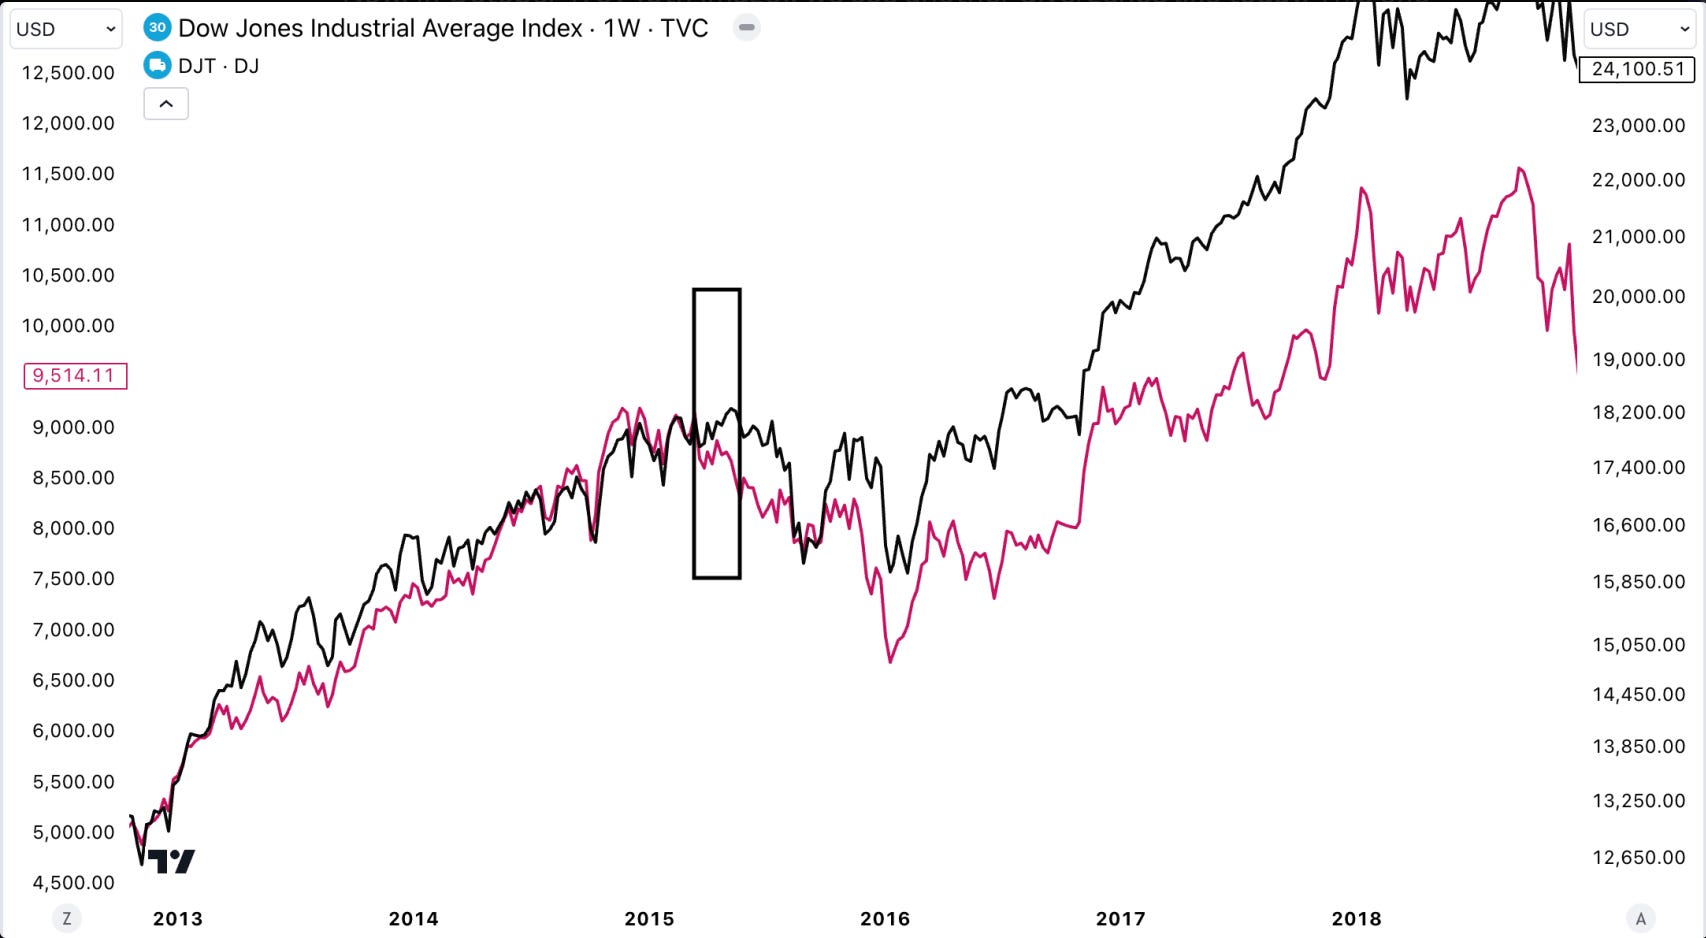
Now, a similar divergence occurred in March 2015 that lasted for 2 months before DJIA eventually peaked.
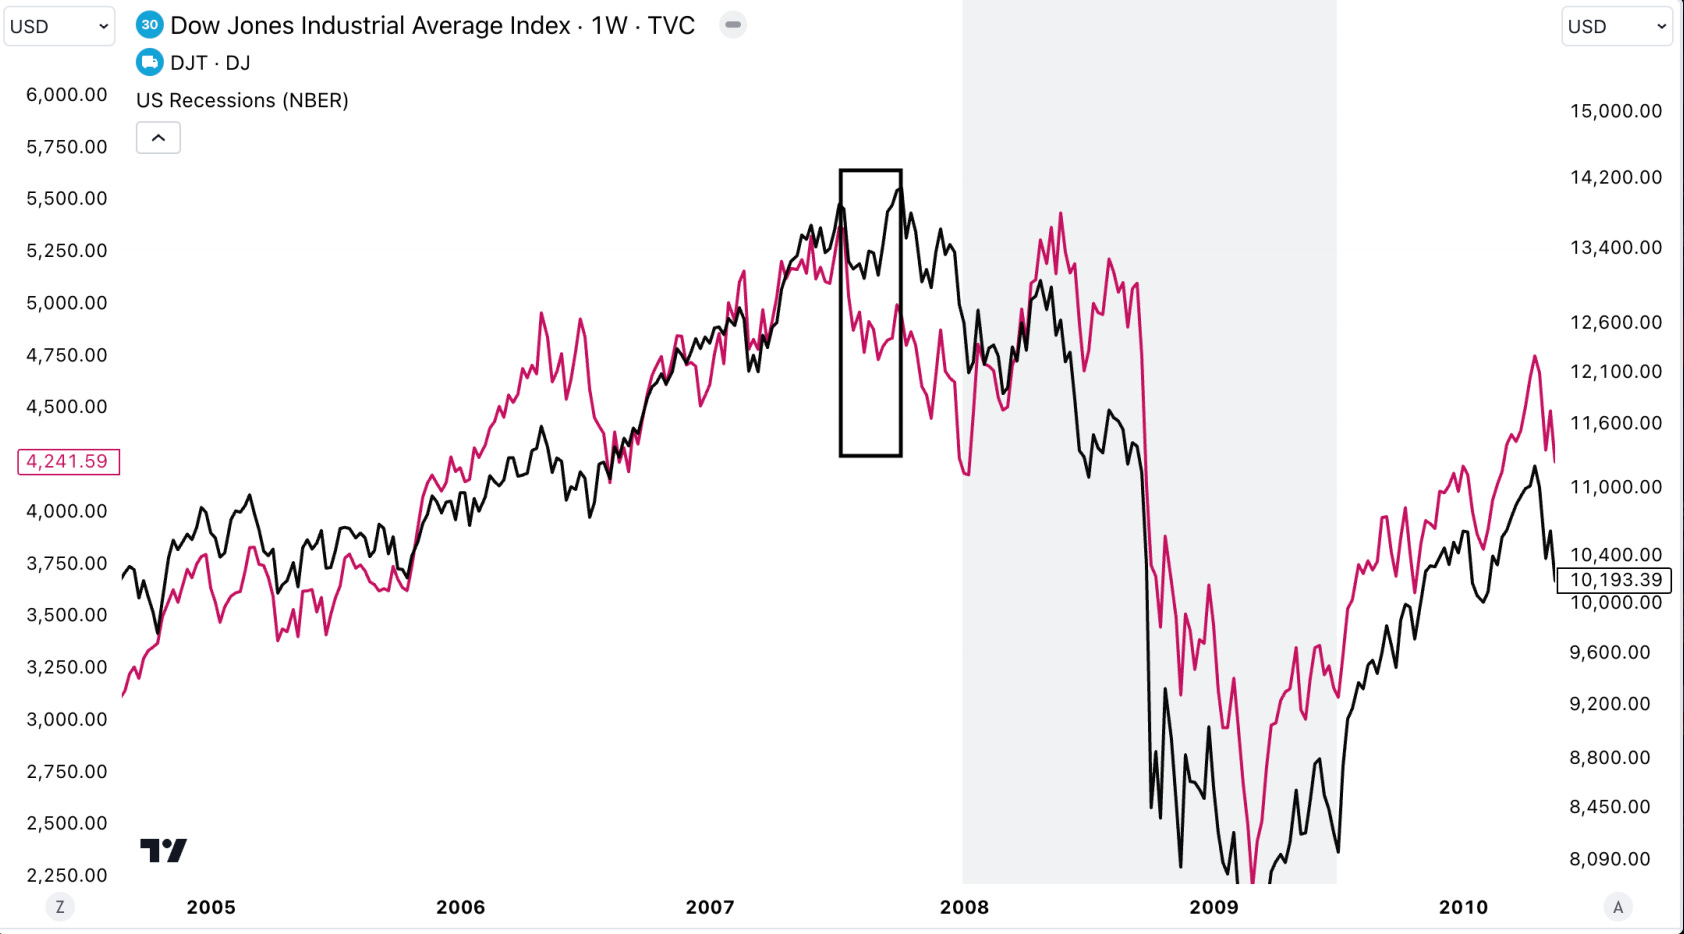
In July 2007, a similar divergence lasted for 3 months before DJIA peaked and declined. This did end in a recession.
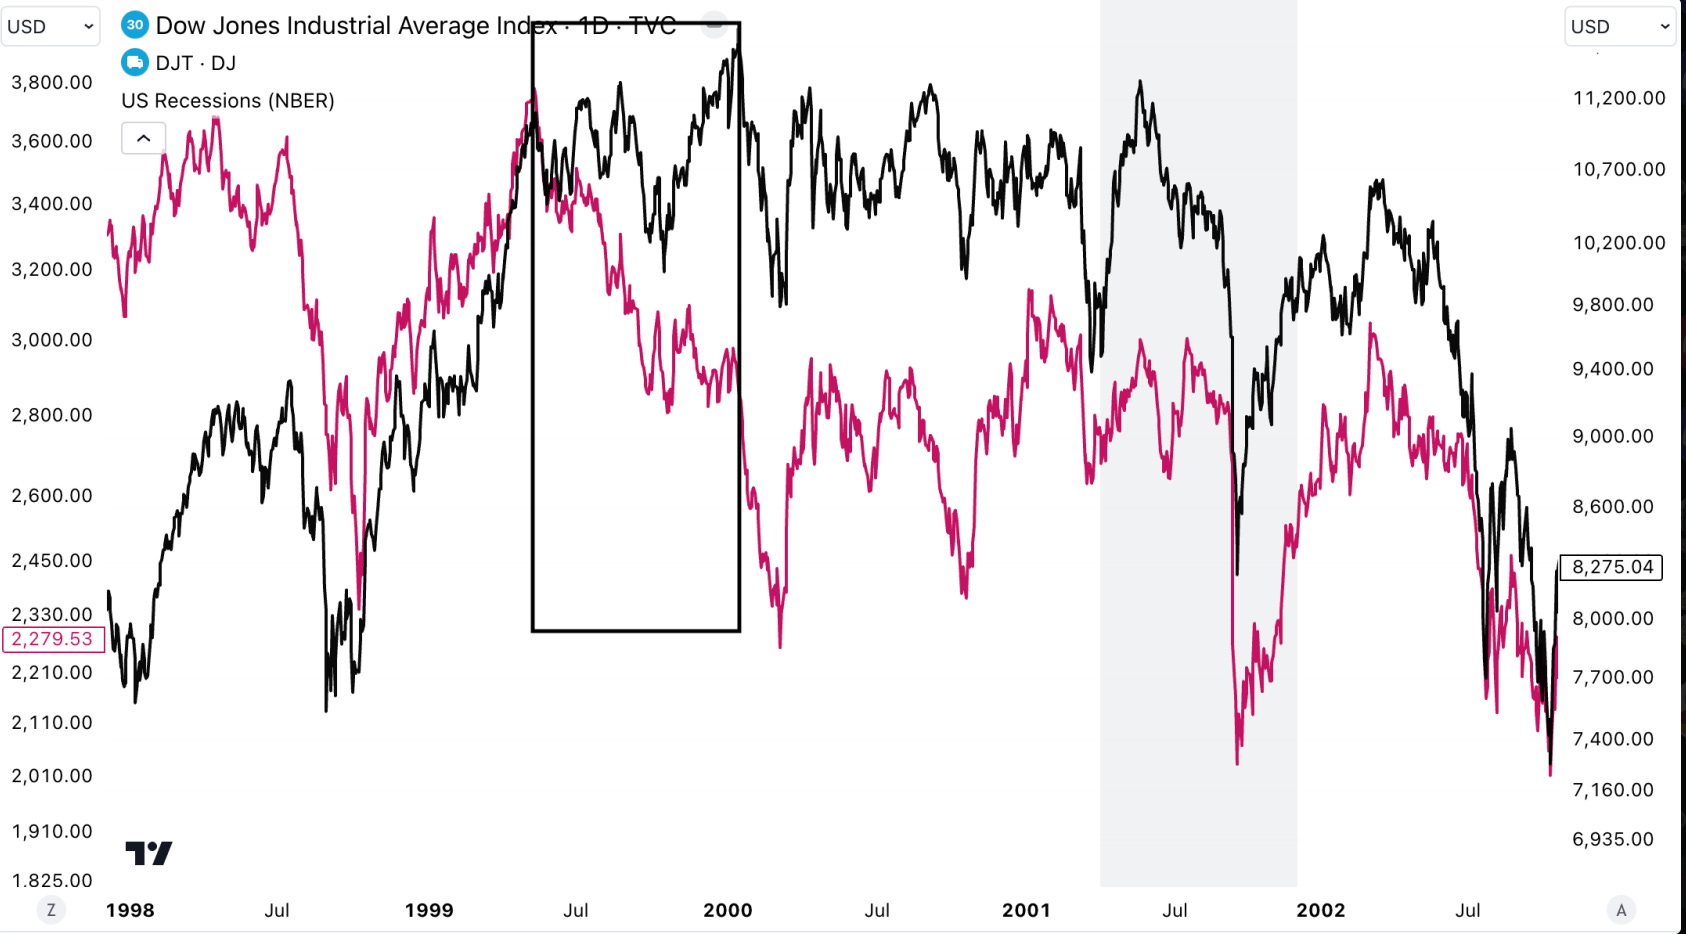
Rewind to May 1999, and there’s a similar divergence again. This one lasted for 9 months though before DJIA peaked. This one also ended in a recession.
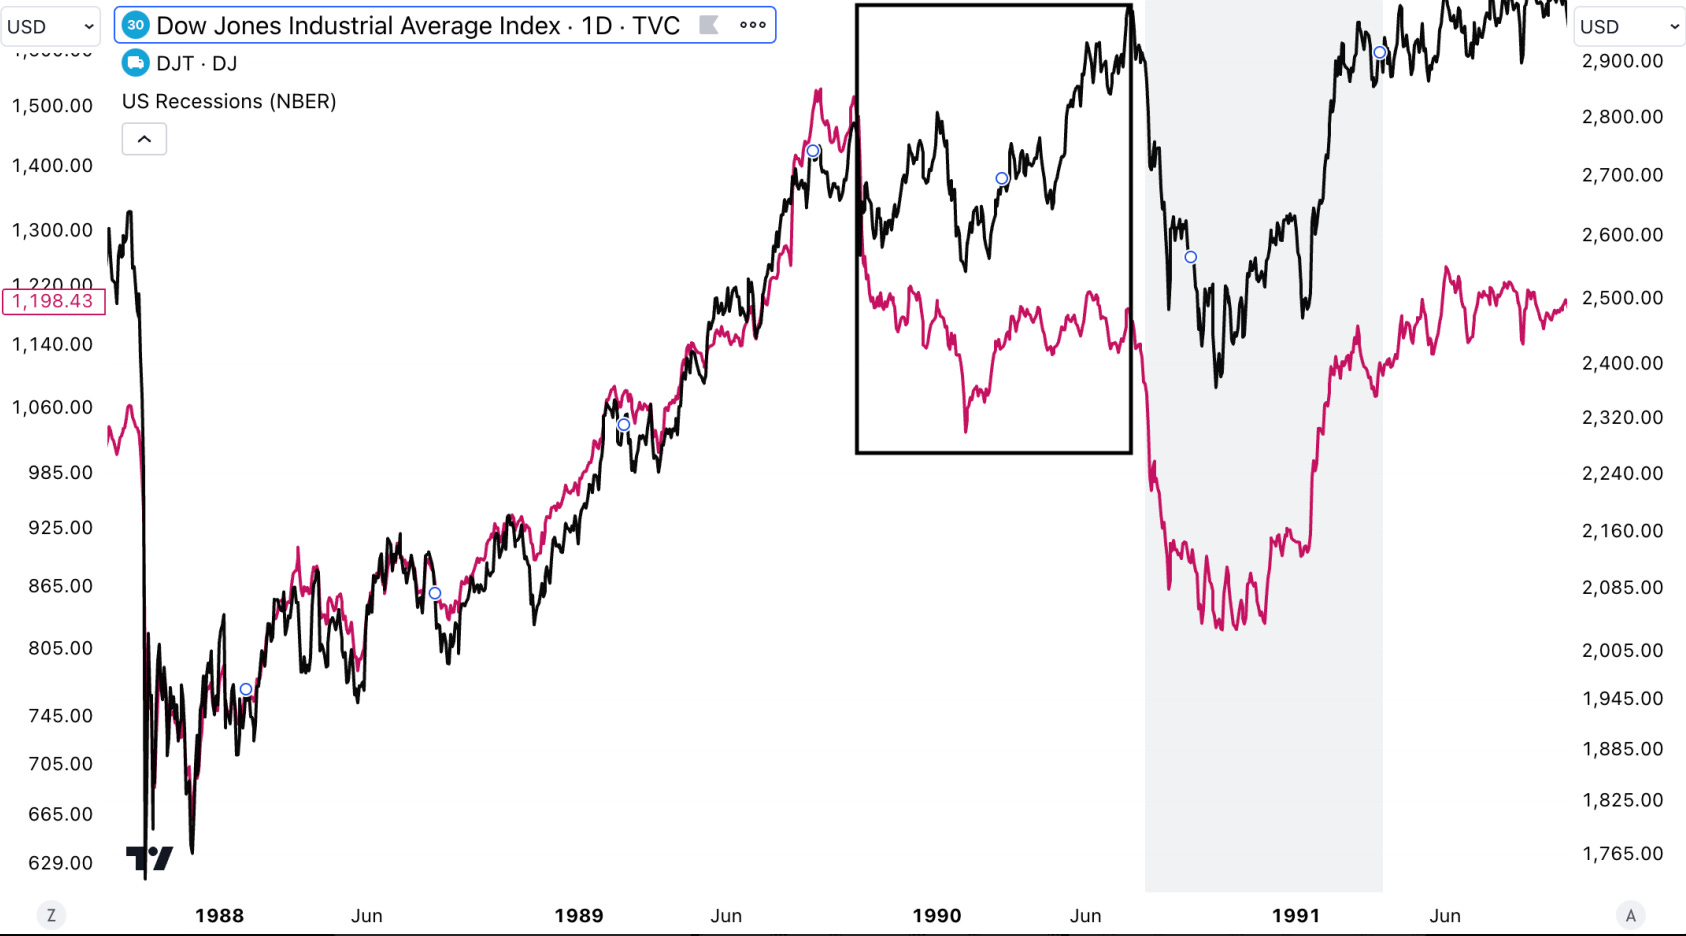
Now, in October 1989, we see another divergence like today. This one lasted for 10 months before DJIA peaked. Even this divergence ended in a recession.
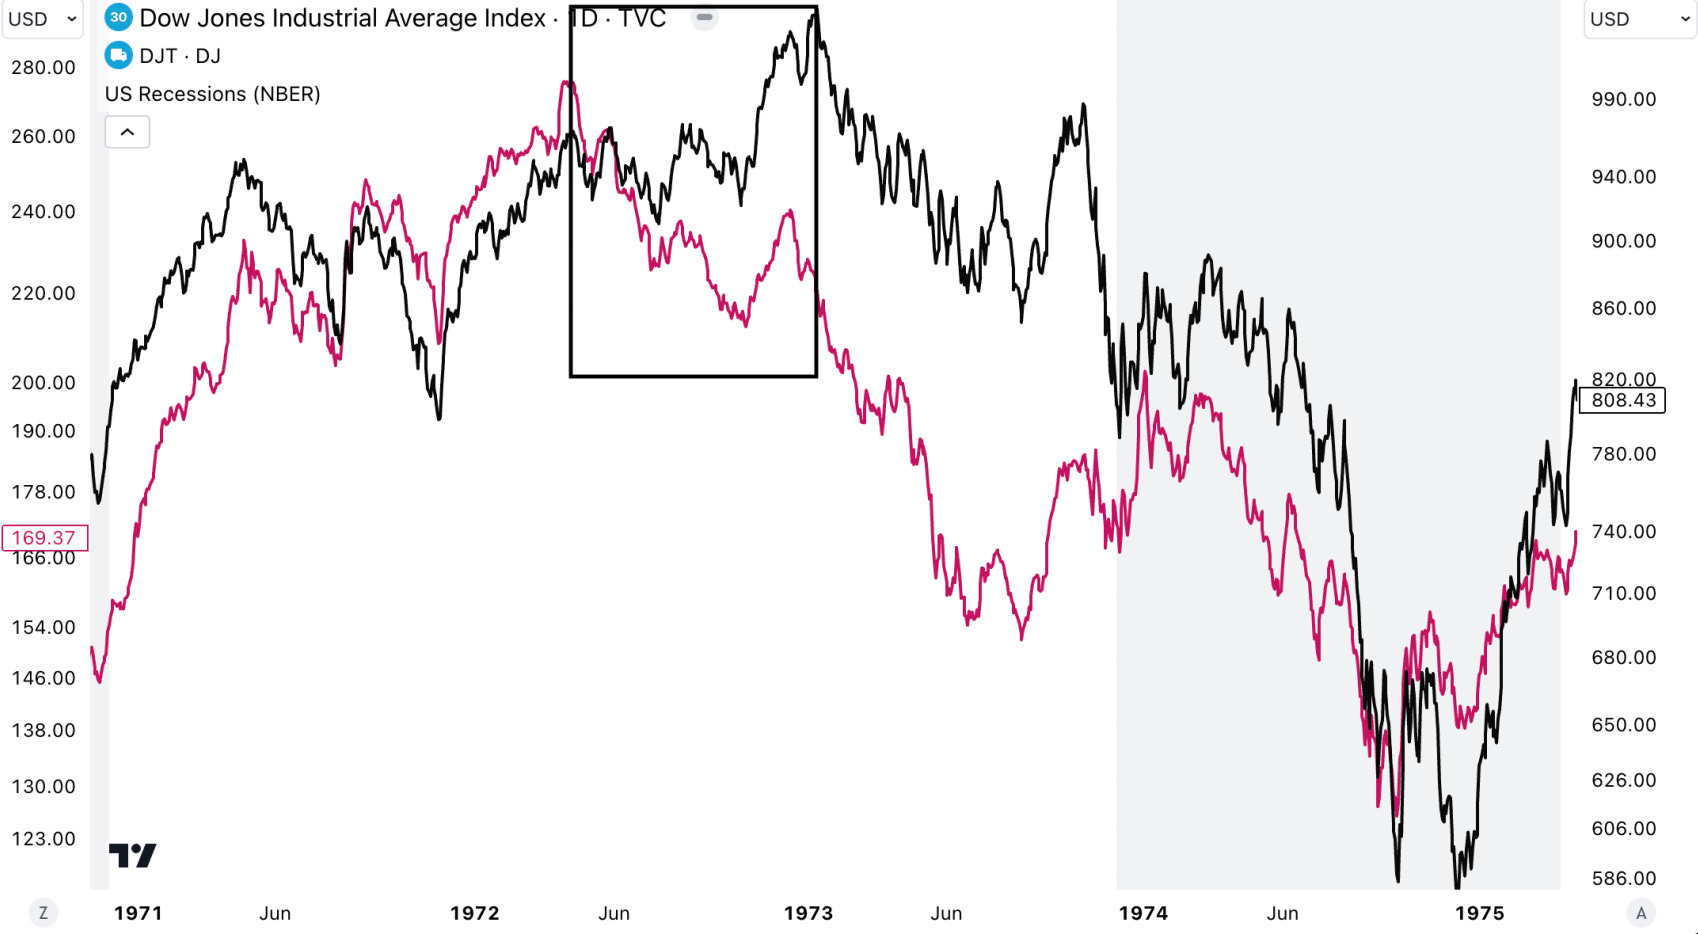
Lastly, in April 1972, we see another similar divergence, which lasted 10 months before DJIA put in a top. This one also ended in a recession.
So, you can see that a lot of the major market corrections and recessions have been anticipated by the Dow Theory divergence.
Another point to note is that these divergences have lasted anywhere between 1 month to 9 months before the DJIA put in a peak.
Today’s divergence is currently about 1 month old, but it could be negated in the event that DJT makes a new ATH in the next leg up, which would confirm DJIA’s price.

But, just like any other indicator, there are times where this divergence doesn’t play out.
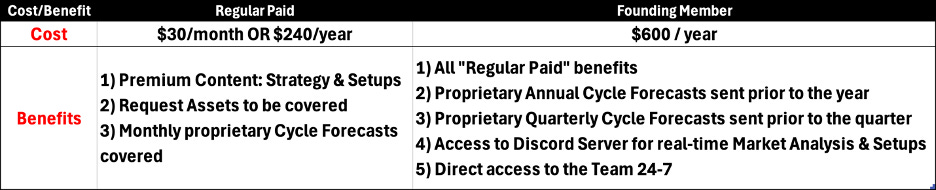
Find our membership cost/benefits below. If you’re serious about Making Money (our primary goal at Cycles Edge), then the Premium Sections are key for you!
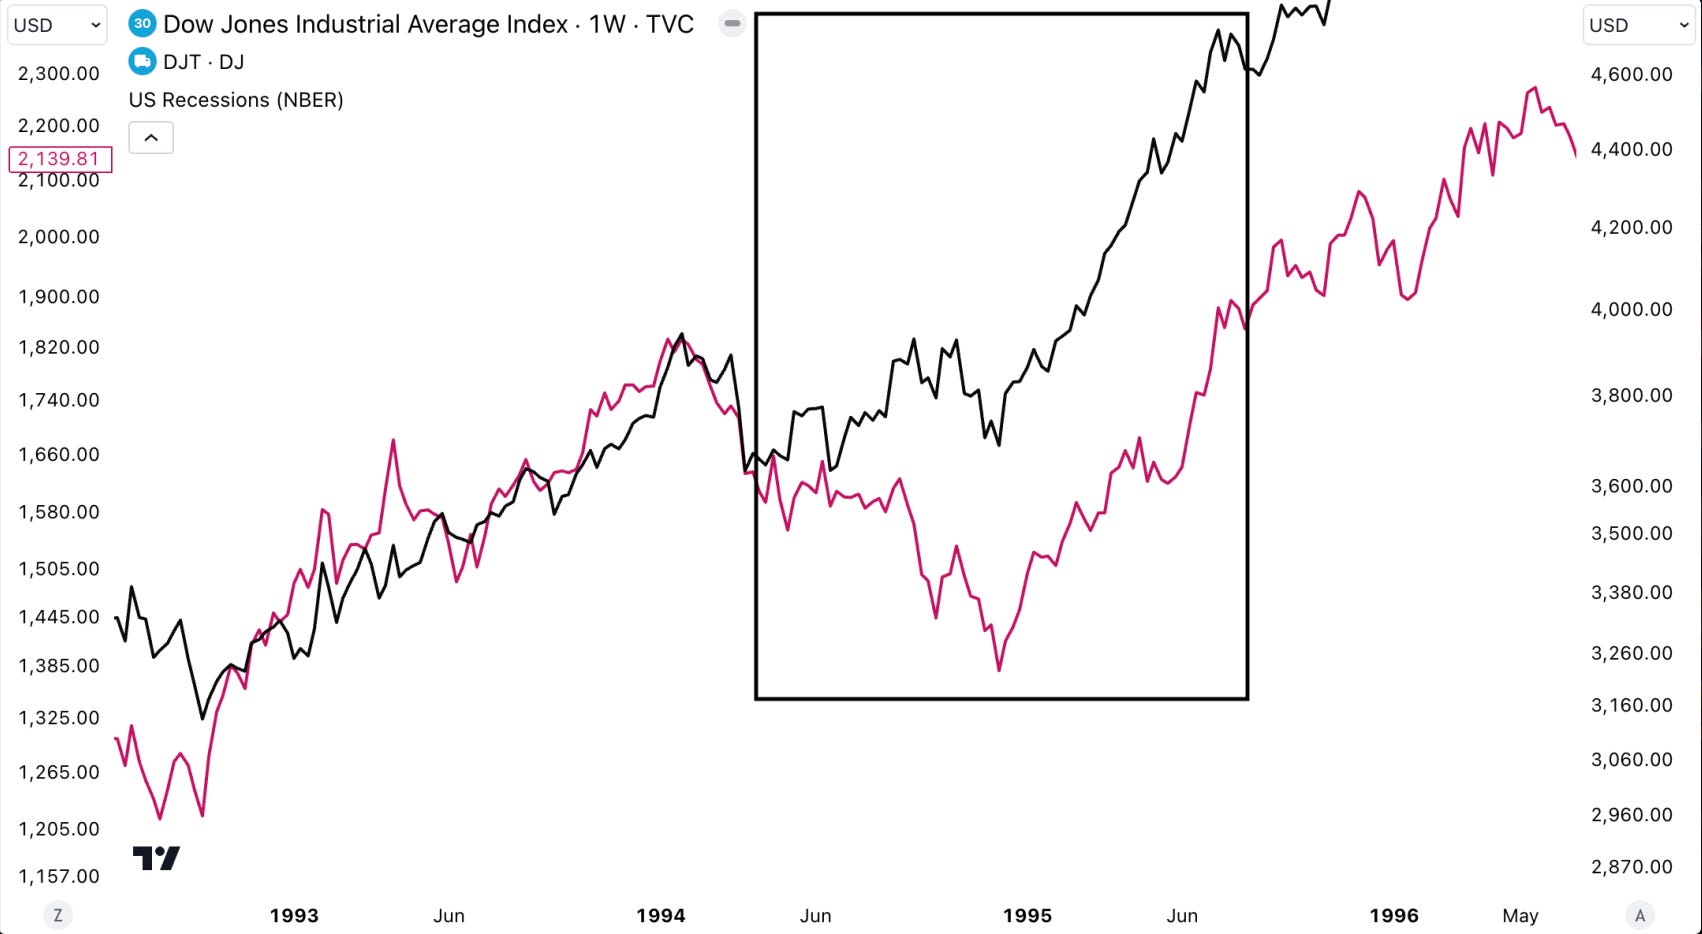
For example, in April 1994, this divergence lasted for 8 months as DJIA moved sideways, but DJT declined.
However, this divergence was resumed with both DJIA and DJT eventually moving higher to new ATHs. So, this is a scenario to also consider when looking at Dow Theory divergence .
Overall, this is a signal to monitor, but not to really worry about yet. Of course, if this divergence persists for multiple months, then the warning from it would be something to consider much more seriously.
We hope you enjoyed this quick rundown on the Dow Theory divergence. Until next time!
Disclaimer - All materials, information, and ideas from Cycles Edge are for educational purposes only and should not be considered Financial Advice. This blog may document actions done by the owners/writers of this blog, thus it should be assumed that positions are likely taken. If this is an issue, please discontinue reading. Cycles Edge takes no responsibility for possible losses, as markets can be volatile and unpredictable, leading to constantly changing opinions or forecasts.