In the battle between Bulls and Bears it’s really the Economics that moves mountains. The market now has “Economic Fuel” as Fed Chair Powell’s 50 bps rate cut + falling inflation + Soft Landing Economic Growth metrics = A Revitalized Bull Market. Yes Economics is more powerful than technicals or cycles.
Market Conditions: Liquidity Spigot is Back On
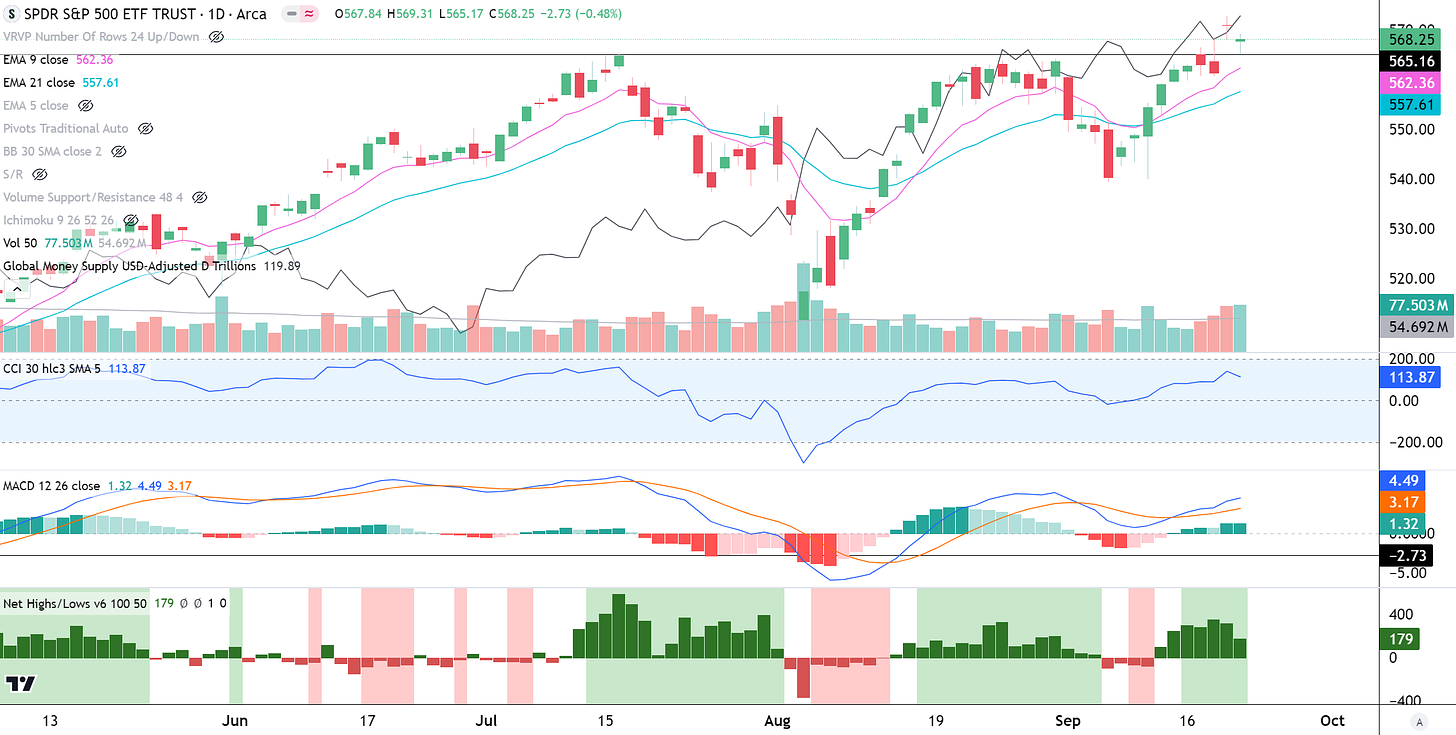
The 50bps Fed rate cut is pumping liquidity back into the system as evidenced by the Global Money Supply increasing, which is the black line below. The S&P 500 (SPY) is retesting the brake out at the $565 level, offering a good entry point. As SPY is above the 9 (pink) and 21 (blue) Exponential Moving Averages (EMA) it should be assumed that the uptrend is intact. Some sideways action is possible as the 9 EMA catches up to price. The CCI Indicator is above 0 confirming the uptrend. It is also not near the 200 mark, telling us that the market is not overbought yet. The MACD is above the 0 mark as there are Net New Highs. The S&P 500 is in a Swing Traders’ Market right now, where stock-picking individual stocks could be lucrative.
The 50bps Fed rate cut is pumping liquidity back into the system, as evidenced by the Global Money Supply increasing, shown by the black line below. The S&P 500 (SPY) is retesting the breakout at the $565 level, offering a good entry point. As SPY is above the 9 (pink) and 21 (blue) Exponential Moving Averages (EMA), it should be assumed that the uptrend is intact. Some sideways action is possible as the 9 EMA catches up to the price. The CCI indicator is above 0, confirming the uptrend, and it is not near the 200 mark, indicating that the market is not overbought yet. The MACD is above the 0 mark showing bullish momentum, while there are a healthy level of Net New Highs. The S&P 500 is in a swing trader’s market right now, where stock-picking individual stocks could be lucrative.
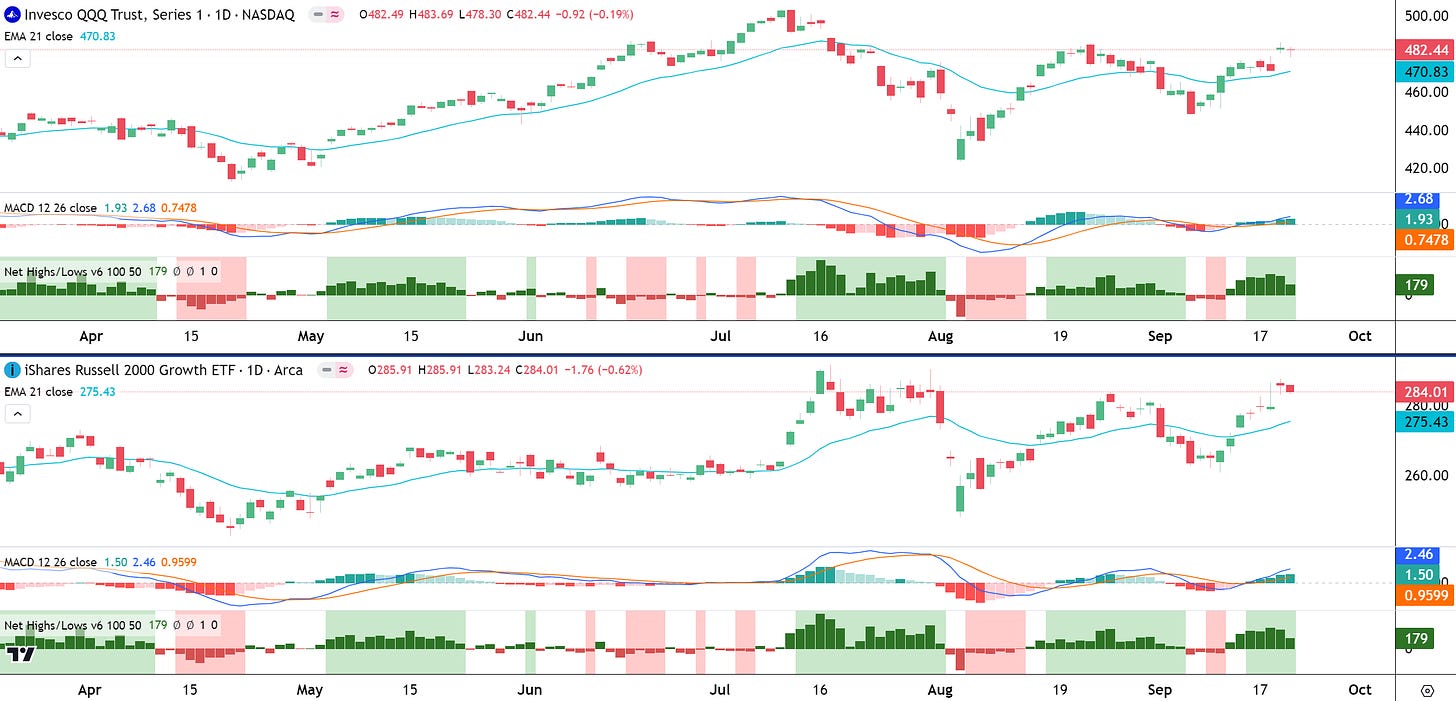
The Nasdaq 100 (QQQ) and Russell 2000 Growth (IWO) are both in swing traders' markets as they meet all the criteria: they are above the 21 EMA, the MACD is above 0, and there are Net New Highs. However, it is worth noting that their charts are relatively weaker compared to SPY, as only SPY has broken above the July 2024 high.
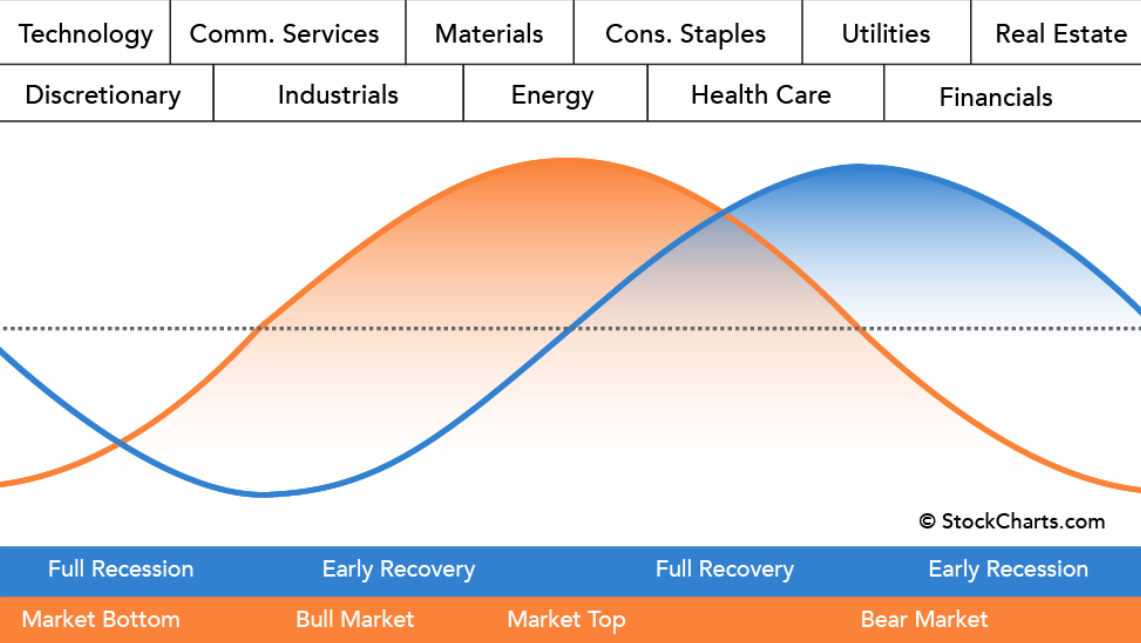
This is because defensive sectors, such as Utilities and Real Estate, have been leading over the past month, while Technology and Growth stocks have lagged.
This could be telling us that we are late in the business cycle. Although the economy is strong now and a soft landing appears likely, we should keep watching for signs of a recession. Strength in the late-cycle sectors suggests that the business cycle is in or close to the early recession stage.
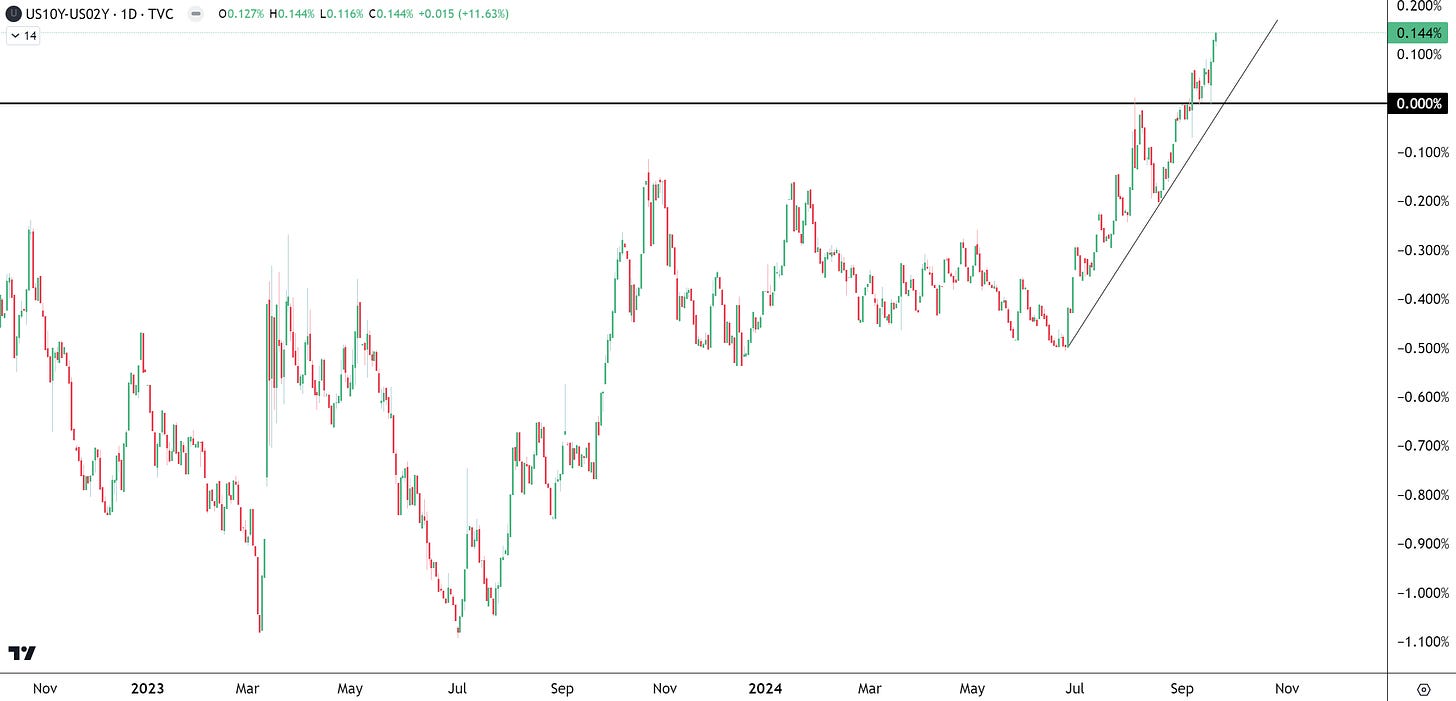
The yield curve is un-inverting (moving back above 0) and re-steepening, which is often a precursor to a recession.
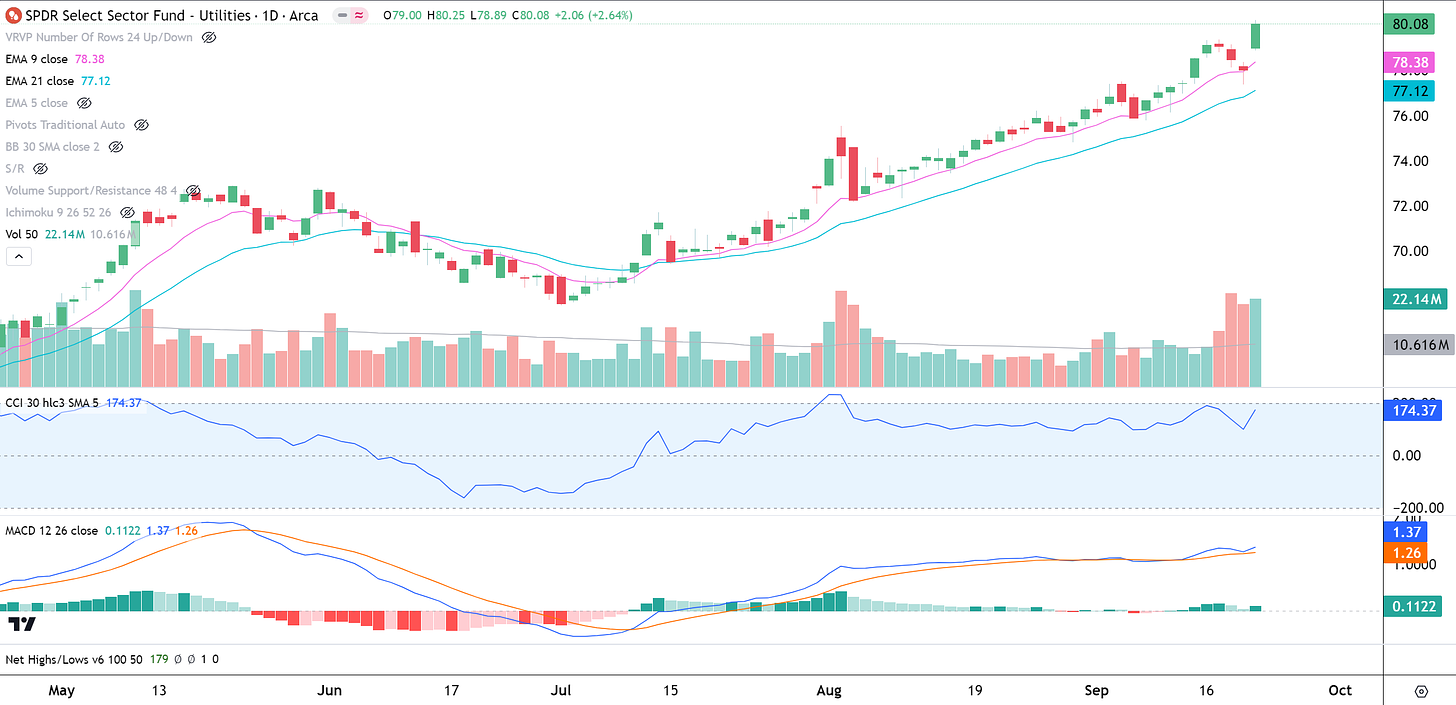
Finally, compare the chart of Utilities (XLU) below to the previous charts of QQQ and IWO. XLU’s outperformance is a statement that we are in a late cycle economy and the institutional money knows it.
A Balanced Opinion
Yes we have Economic Fuel from the Fed’s 50 bp rate cut and a breakout to new highs on the SPY. However it’s important not to give in to FOMO. The market is probably not going to go straight up and there are some signs that some digestion time is needed.
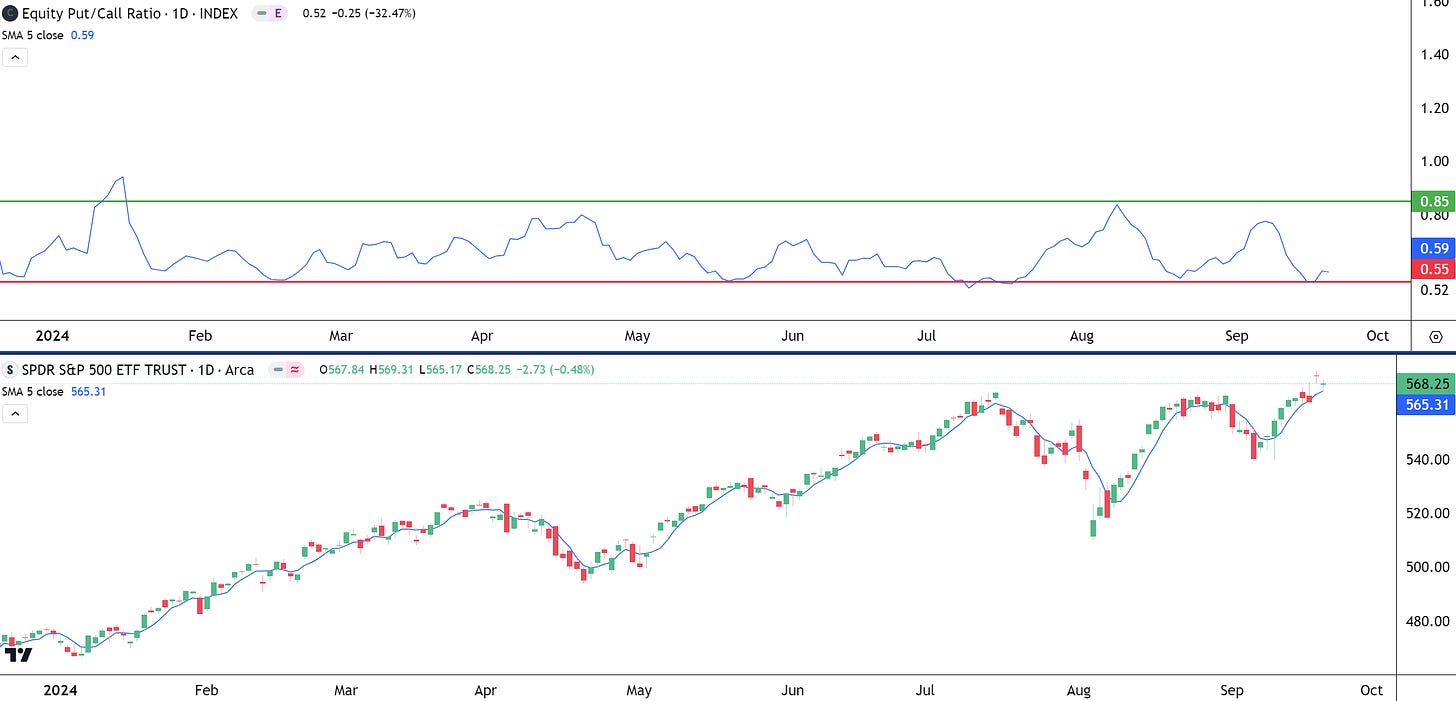
The equity put/call ratio is once again at a bullish extreme, which often foretells a pullback. The market has bought a lot of call options, and two things can happen. First, the market could reverse so that market makers don’t have to pay call option buyers. Second, economic momentum fuels the market higher, forcing market makers to hedge their options positions (as call buyers buy, market makers sell call options) by adding long S&P 500 futures positions. Currently, the second scenario is the reality; however, if buying stops, market makers can easily reverse the market to profit from washing out call options.
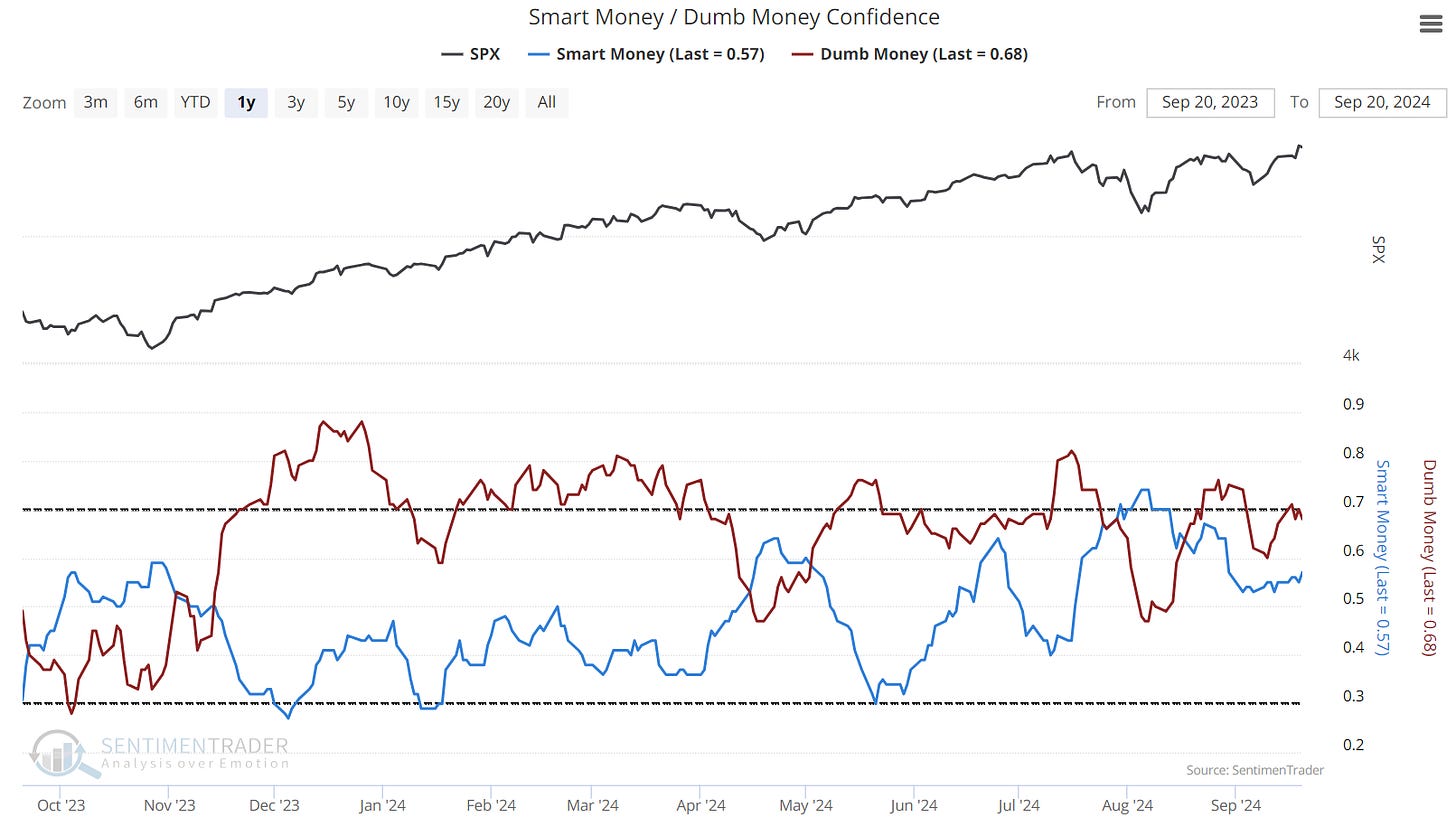
Smart money did not buy the rip initially, but it appears they are beginning to now. If smart money continues to buy every dip, their capital being put to work could lift the market higher for some time. Meanwhile, dumb money appears to be starting to sell.
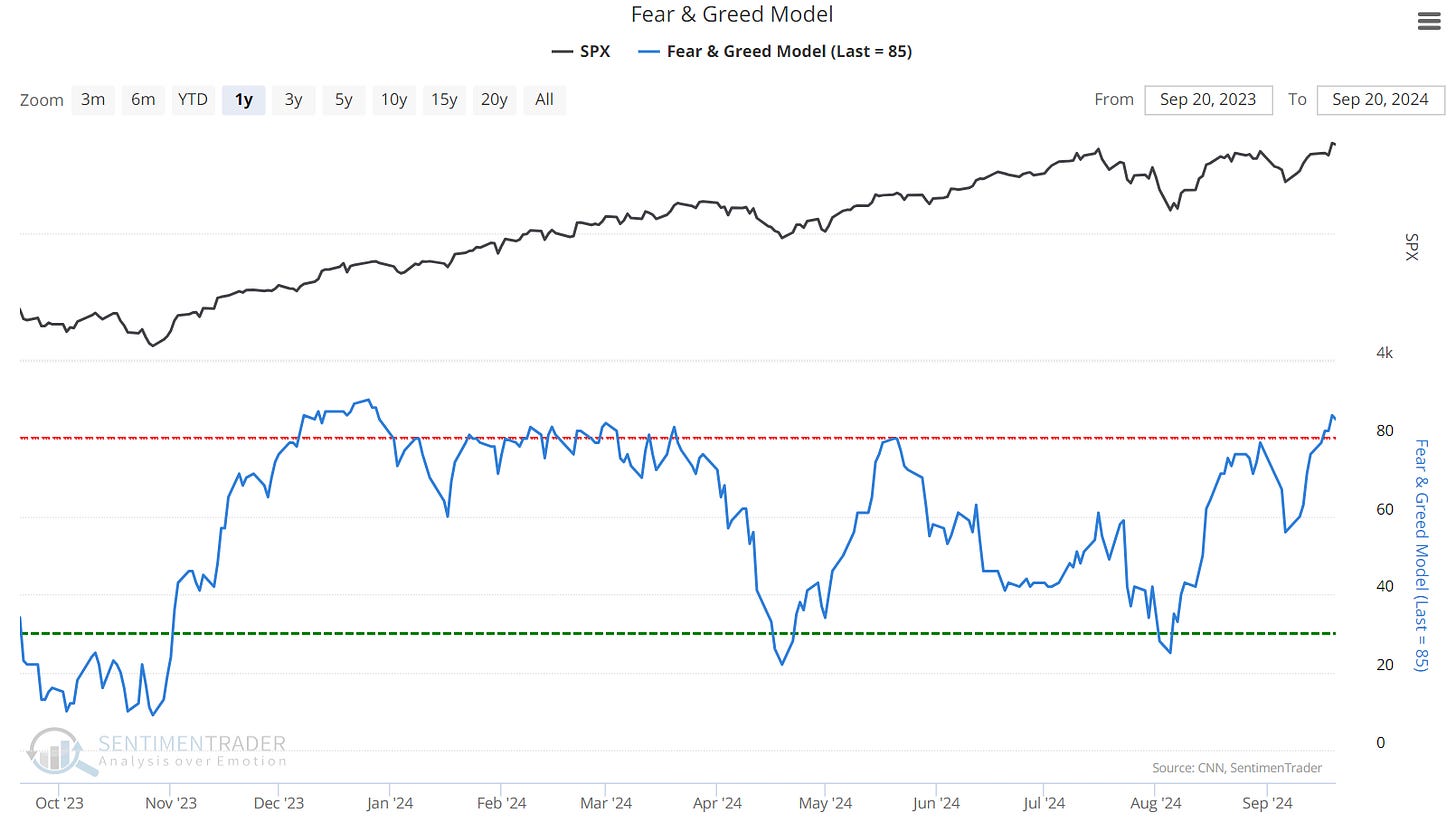
The Fear and Greed Model appears to be overheated with greed. If greed persists, it could form a “greed grind” where greed remains elevated for a long time, similar to the period from December 2023 to March 2024. However, if the market gets spooked, a reversal is possible.
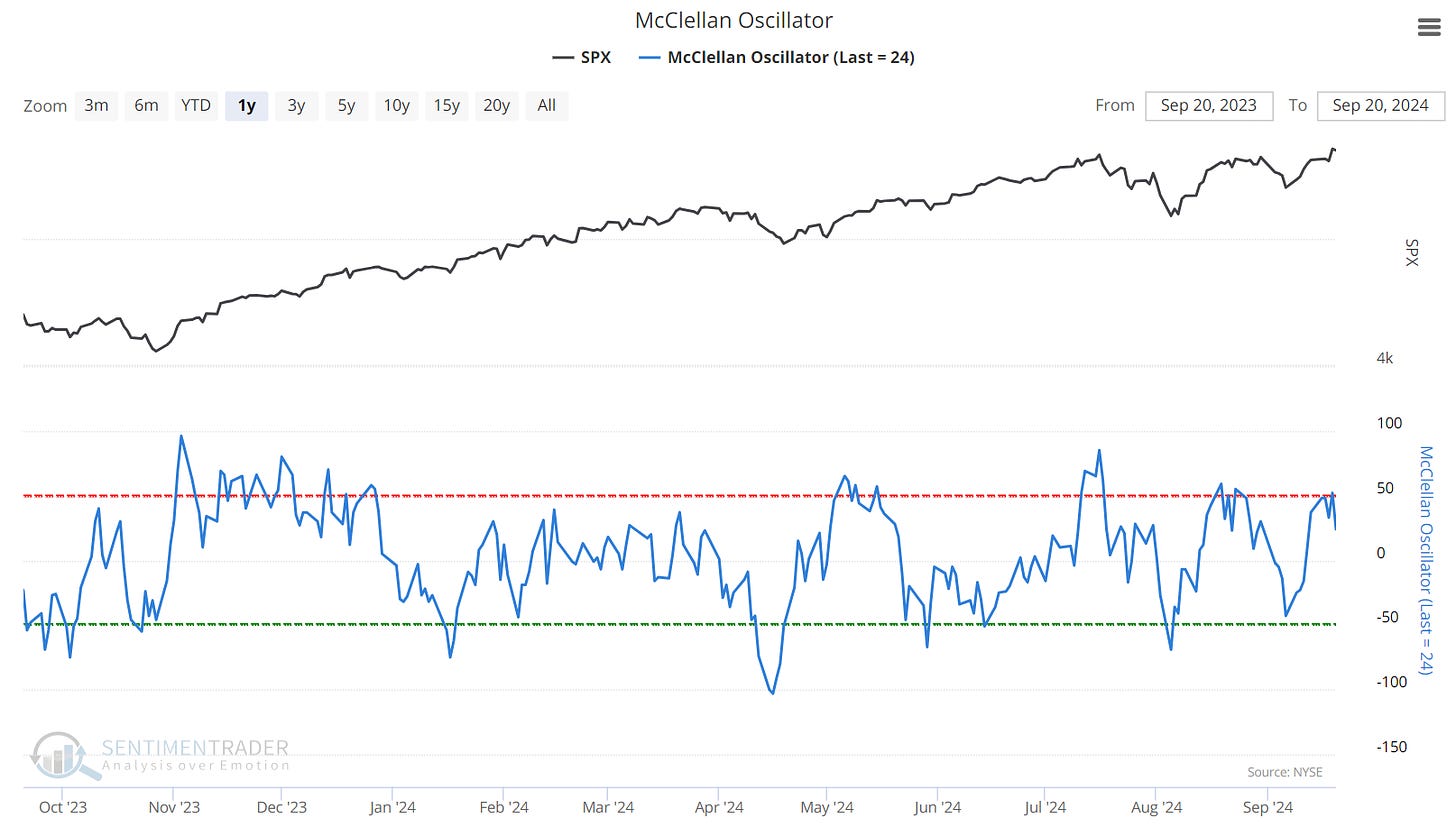
Finally, the McClellan Oscillator is at an extreme and hints at a pullback or a sideways digestion period for the stock market. Being patient to buy a dip to support could prove much more lucrative than FOMO’ing in at the high.
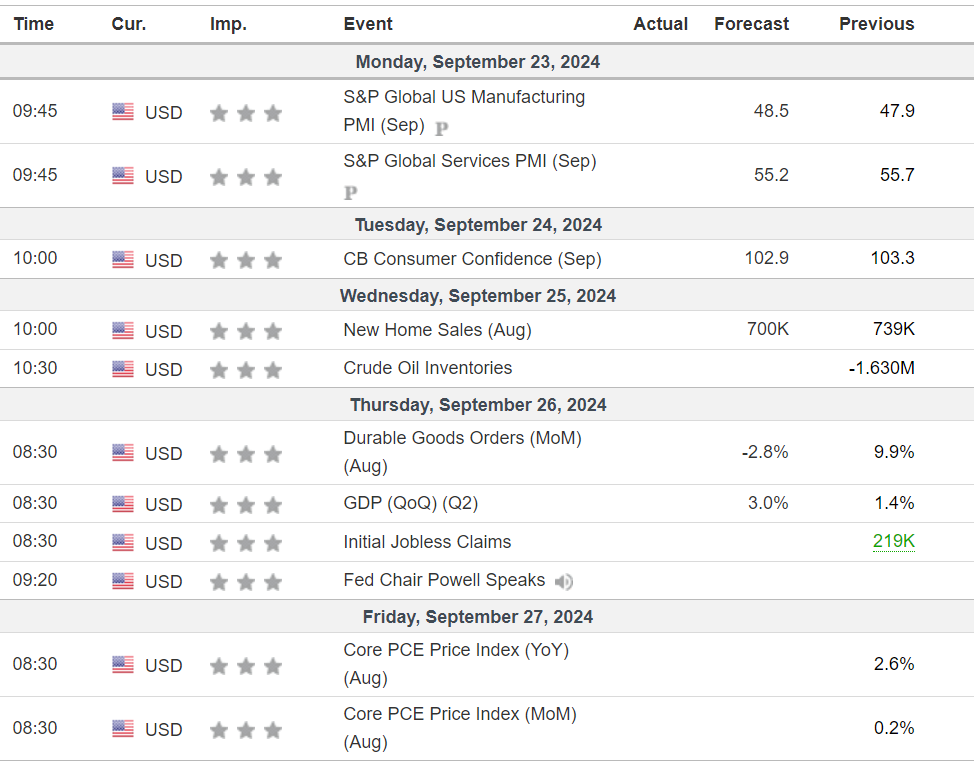
Next week will have a lot of economic news, so expect the market to move. Thursday is especially heavy with Durable Goods, GDP, Initial Jobless Claims, and Fed Chair Powell speaking. On Friday, Core PCE will be another important news release.
Conclusion
The trend is up and powered by Economic Fuel. However Sentiment is a bit overheated and Sector Rotation is defensive (late cycle). We believe that the uptrend has more to go, but entering at short-term pullbacks is key. Next week’s heavy economic news calendar could provide plenty of opportunities. Cycles appear to be re-calculating and in the Premium Section we’ll revisit the new Cycles and Seasonality.
We just completed our 4Q2024 Cycle Forecasts which will be on sale next week here. We send our Cycle Forecasts to Founding Members early so consider becoming one. Til next time.


