

February 2026 Cycle Forecasts

We’re offering 15% off our Cycle Forecasts, making this an ideal time to use cycle-driven insights to guide your investment decisions for the rest of the year. Check it out here: https://cyclesedge.com/
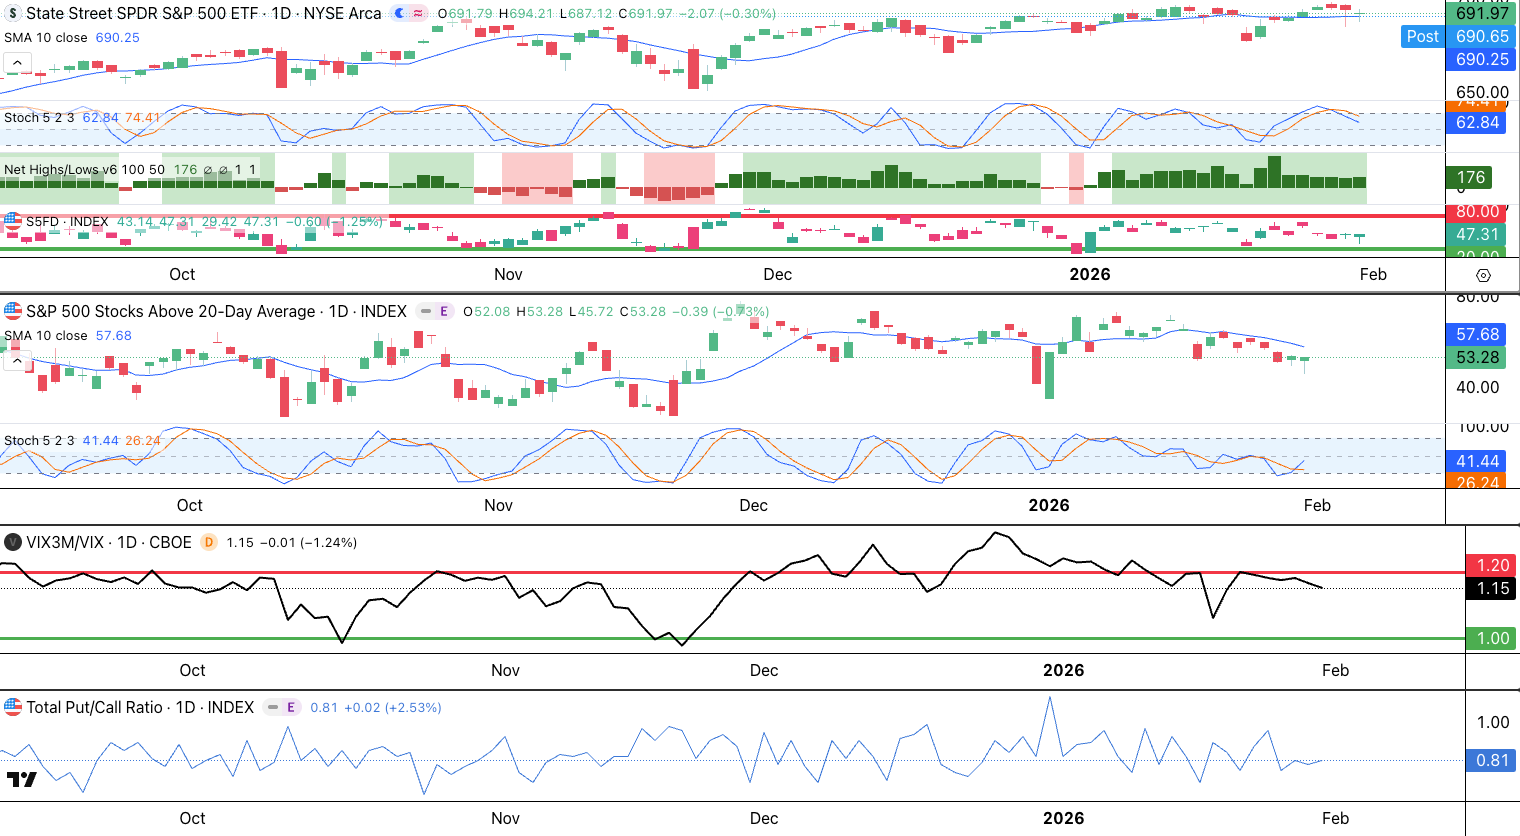
Let’s start by looking at our SPY Market Timing Model. The chart below shows:
The S&P 500 (SPY) Stochastics was overbought and a natural/normal pullback is now underway.
The SPY is still holding above the 10 simple moving average (SMA) showing that the market is still acting right and not falling apart.
The S&P 500 Stocks above the 5 -day simple moving average (S5FD) are stabilizing, and looking ready for another run higher. The S&P 500 Stocks above the 20 SMA has a similar look, with the Stochastics indicator looking ready for a new uptrend.
The VIX Curve was overbought and is pulling the market lower. When this reverses higher, the market will be ready to rebound.
The Put/Call Ratio is overbought so the market may need to fall more to create fear, before a bullish oscillation begins.
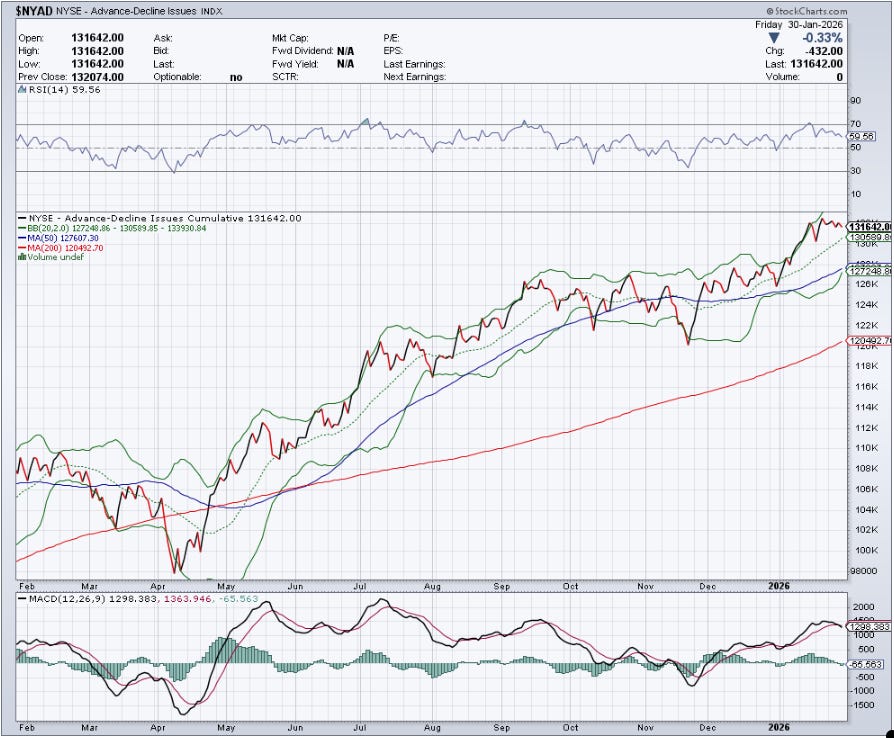
The NYSE Advance/Decline Line ($NYAD) is having a pause/pullback in an overall uptrend following a breakout. Odds are for this to continue higher after a pause. That would be supportive for the stock market’s broad-based rally.
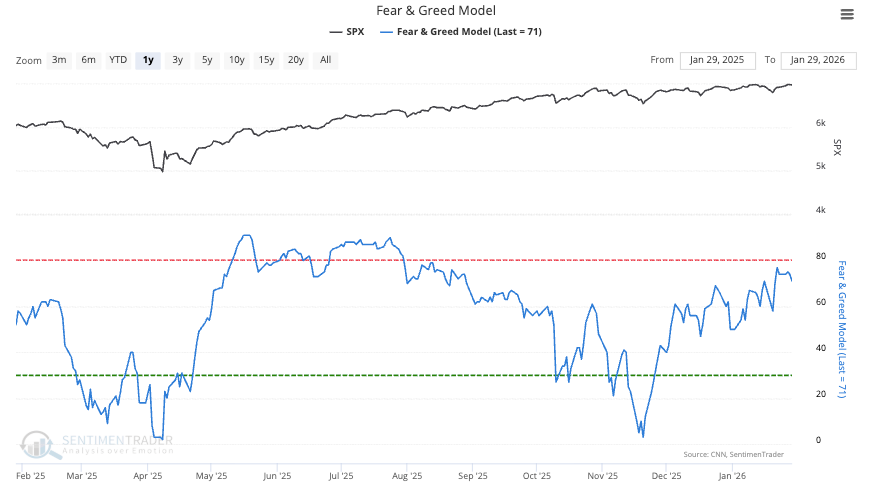
Sentiment, as measured by the Fear & Greed Model, is climbing a wall of worry. It is not yet overbought so there is more room to run.
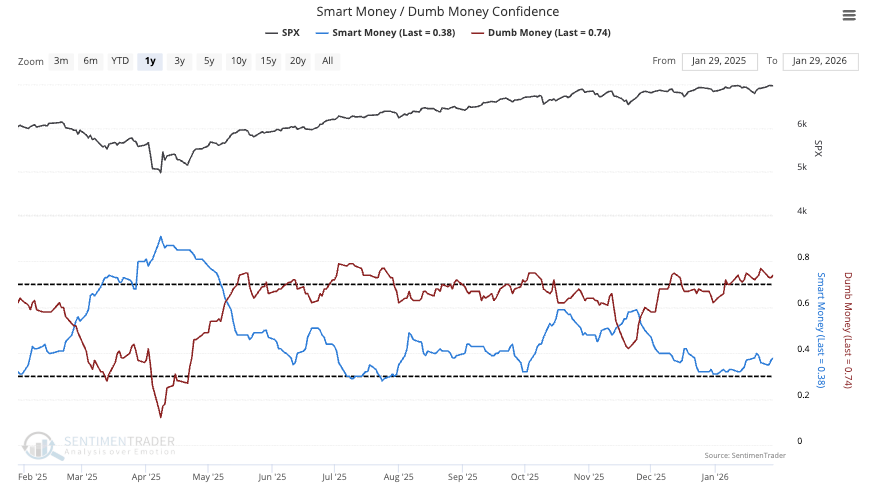
Smart Money is buying the dip as Dumb Money refuses to sell. As Smart Money buys, the market should remain supported.
Relative Strength
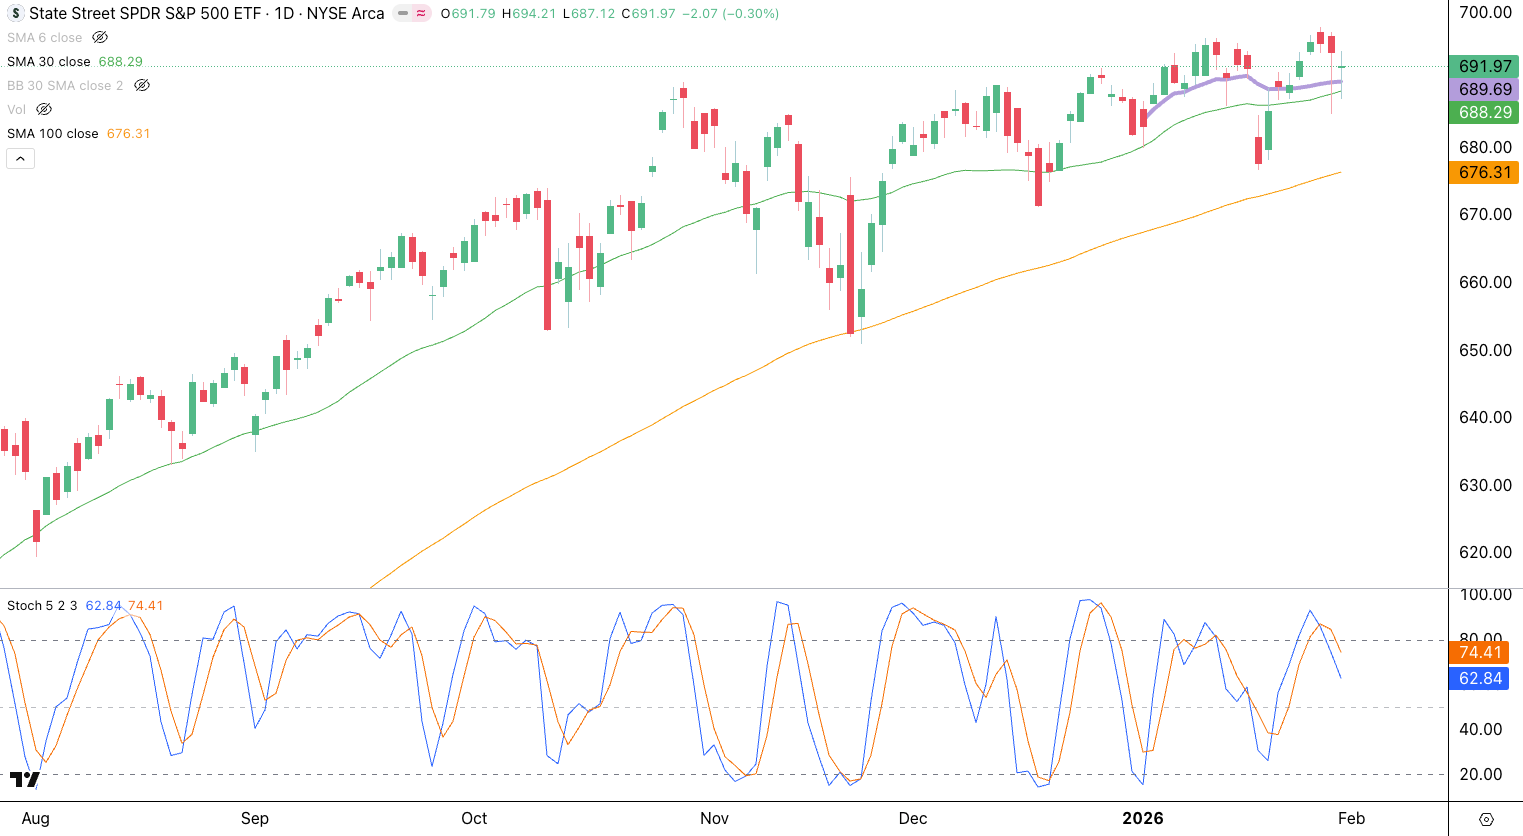
Let’s compare areas of the market to find relative strength. First, here is a simple chart of the SPY. Notice how the overbought Stochastics led to a pullback. Price is holding above the 30 SMA (green) and the Year-to-Date AVWAP (purple). If price continues lower, as long as the 100 SMA (orange) hold, the uptrend is intact.
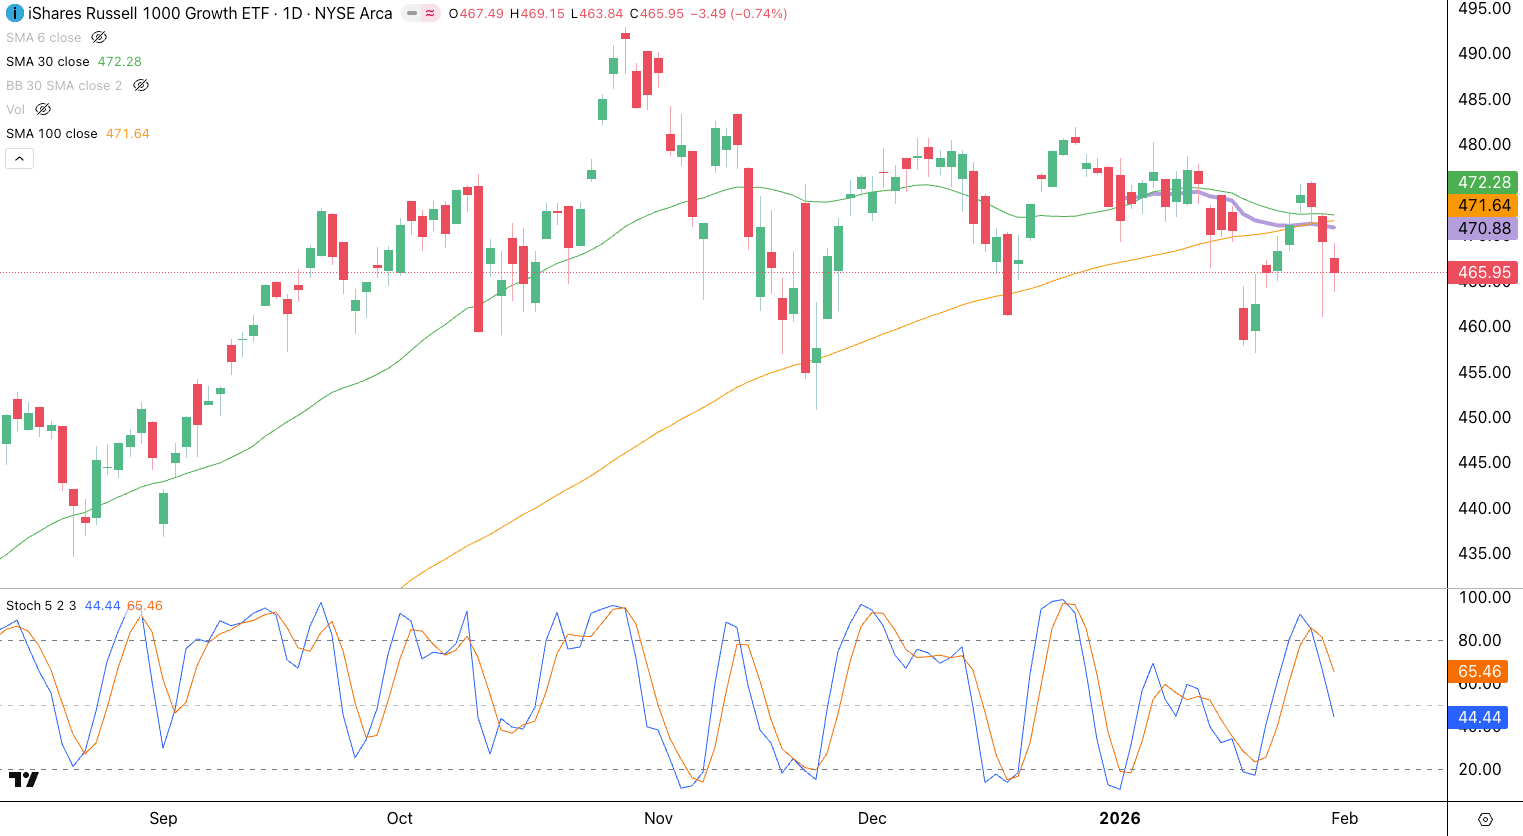
Growth (IWF) is floundering as it fell below the 100 SMA and the YTD AVWAP. Capital can be better employed in other areas. The underperformance in growth is driven by technology.
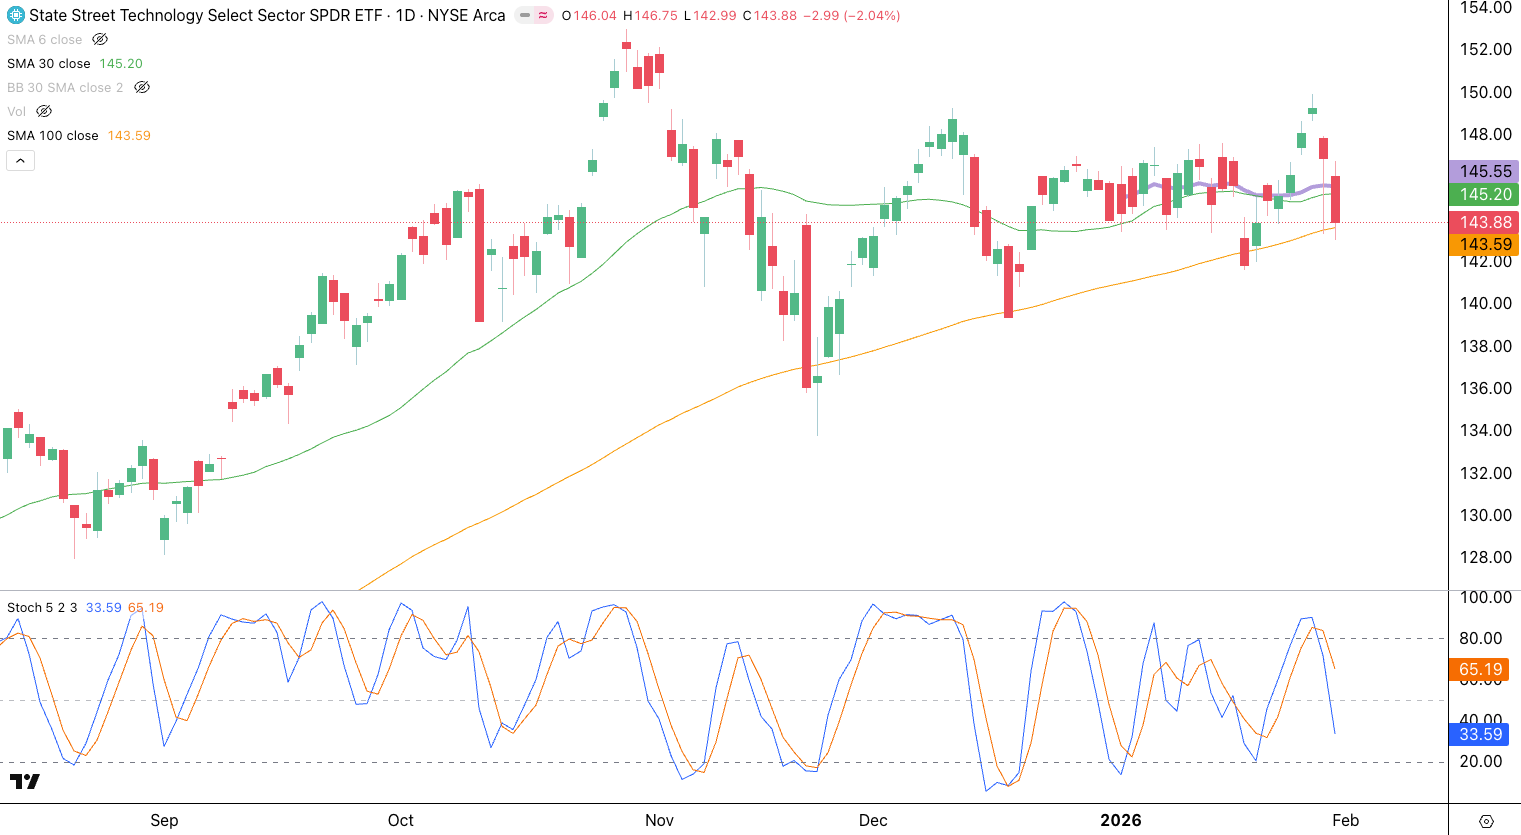
Technology (XLK) is holding on by a thread as it closed just above the 100 SMA. It is trading below the YTD AVWAP so this picture is far from strong. The Tech picture is bifurcated…
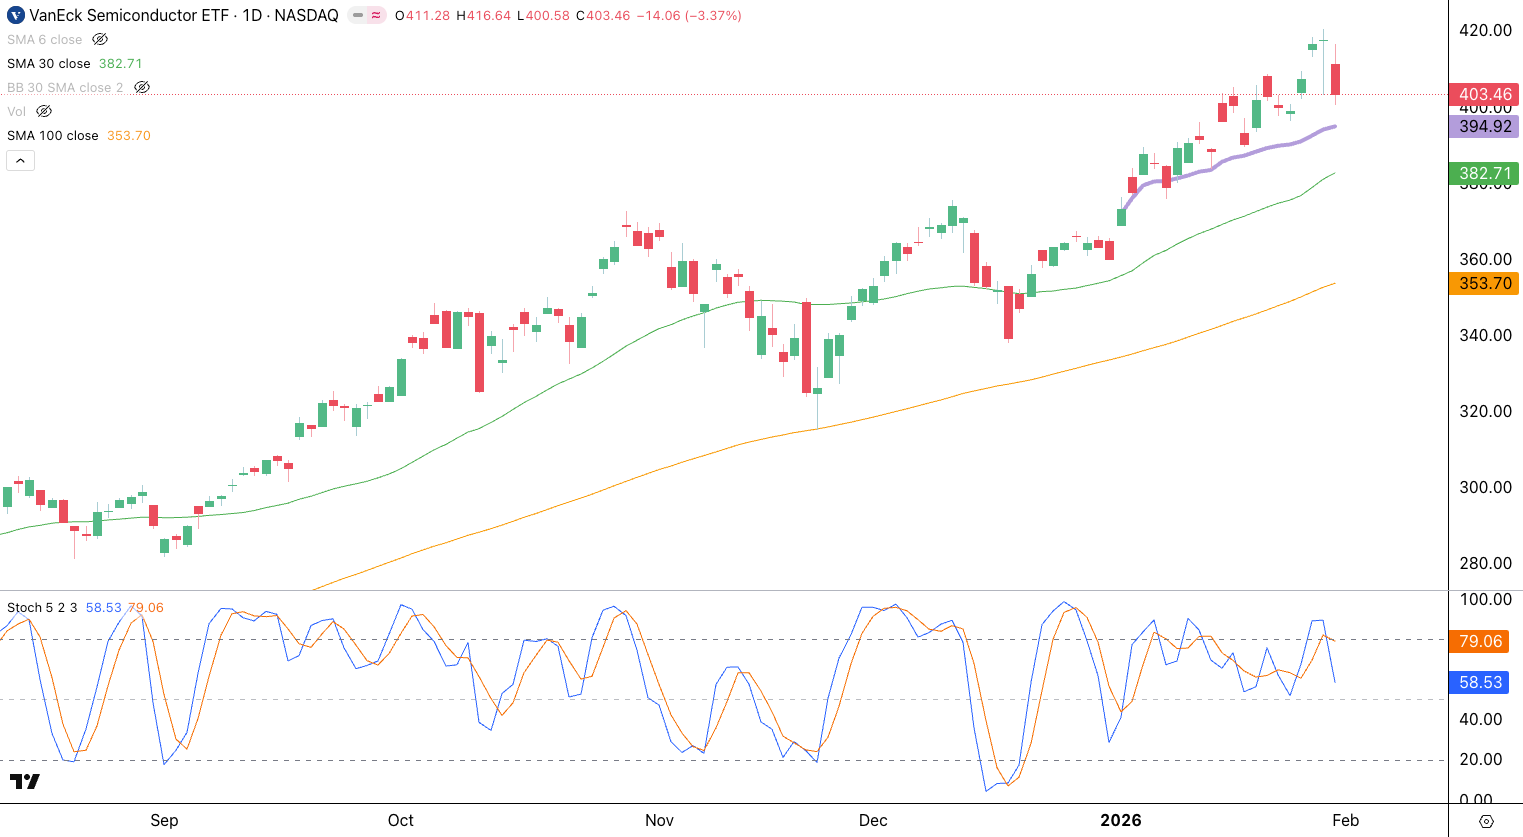
…Semiconductors (SMH), which is seen as the backbone of Artificial Intelligence, is actually quite strong as price trends above the YTD AVWAP and the 30 SMA.
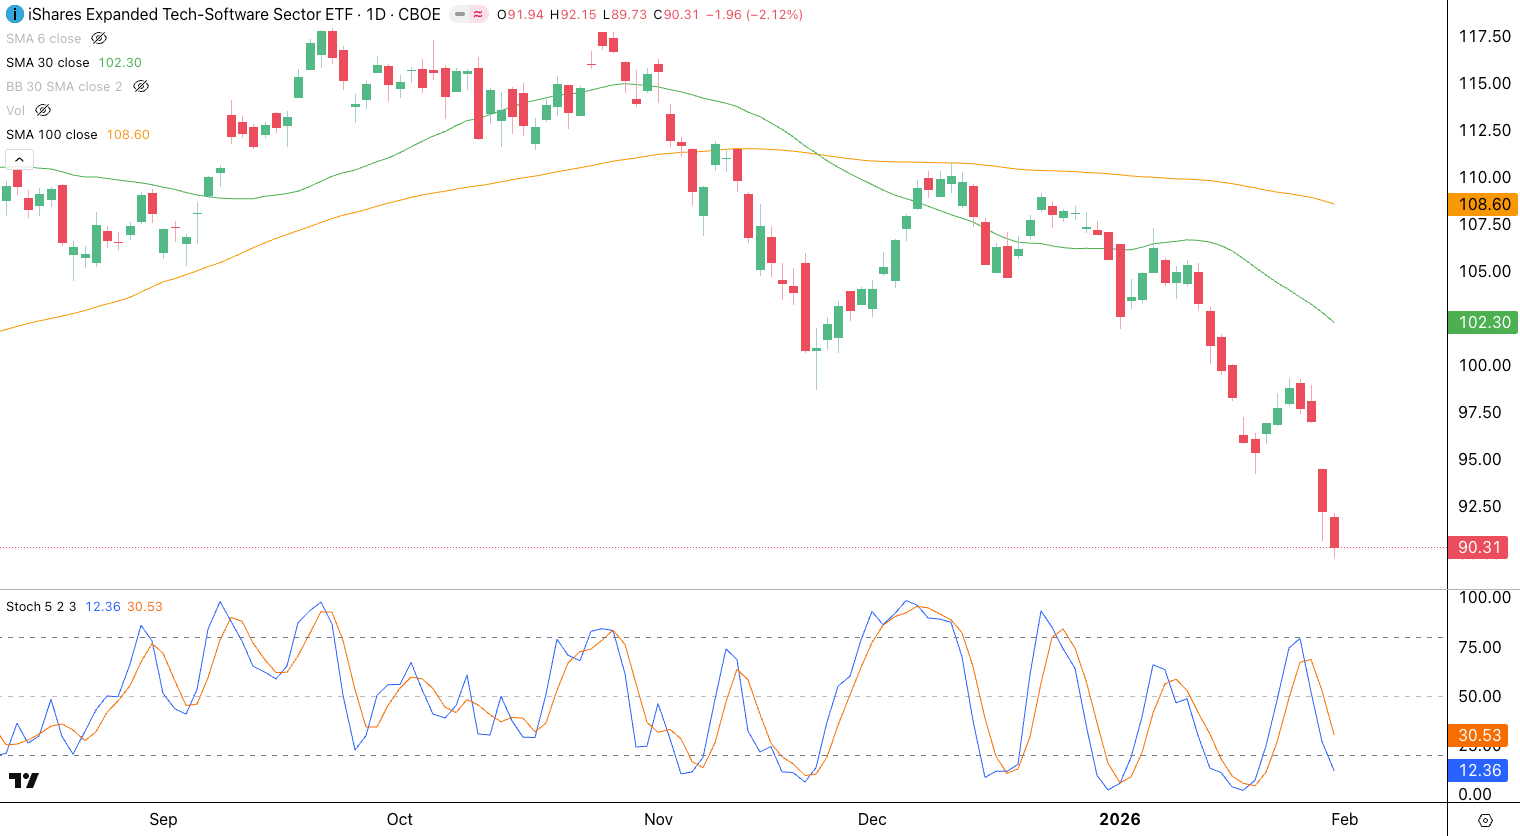
Unfortunately Software (IGV) is flopping hard as AI is expected to substitute many software offerings.
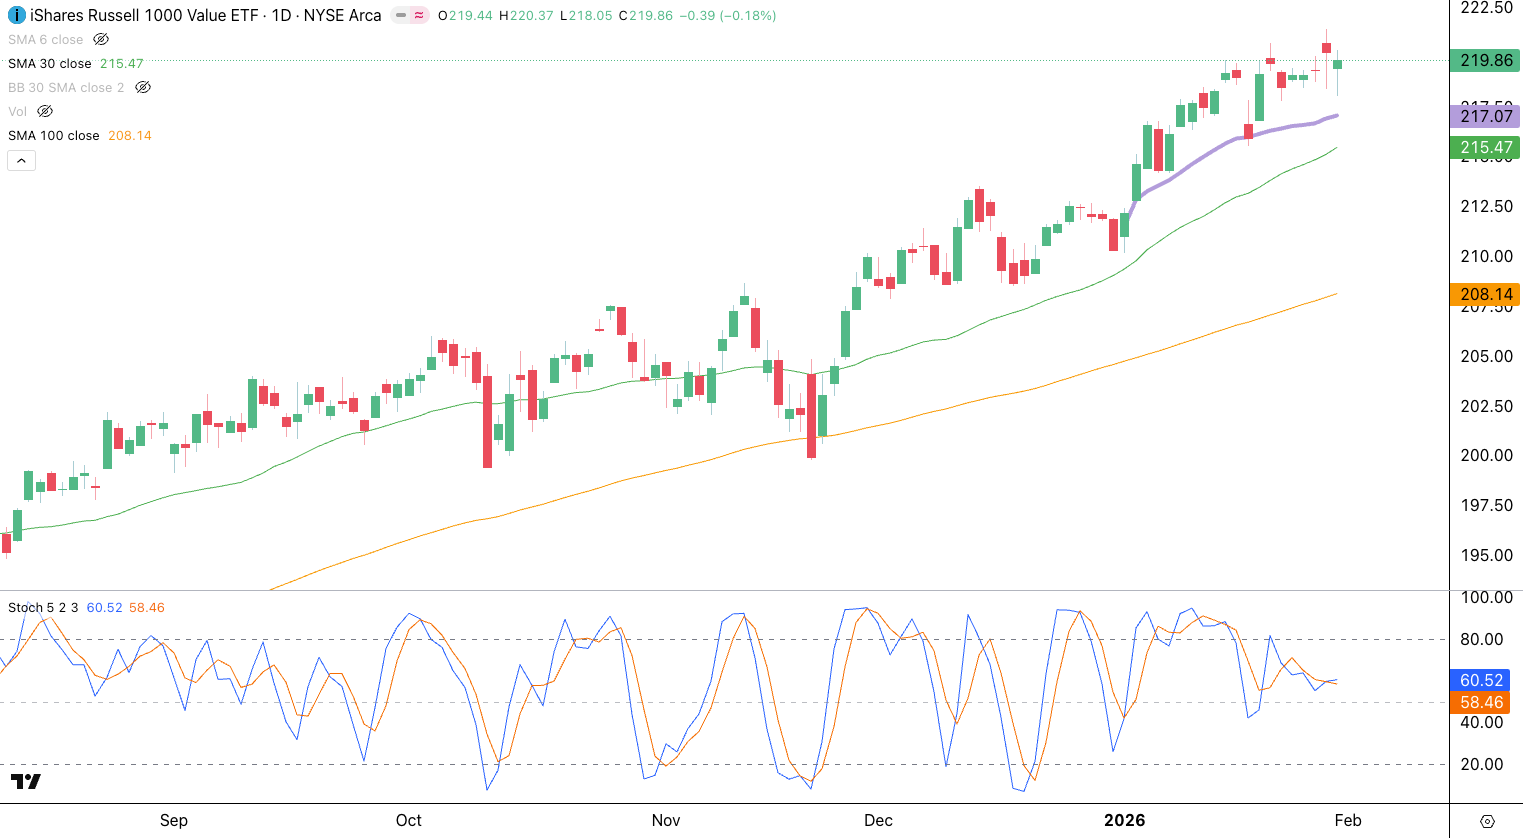
We mentioned previously how 2026 is the year of rotations. Value (IWD) is treating last week’s pullback like a nothing-burger, as price stays above the YTD AVWAP and 30 SMA.
Same with Energy (XLE)…
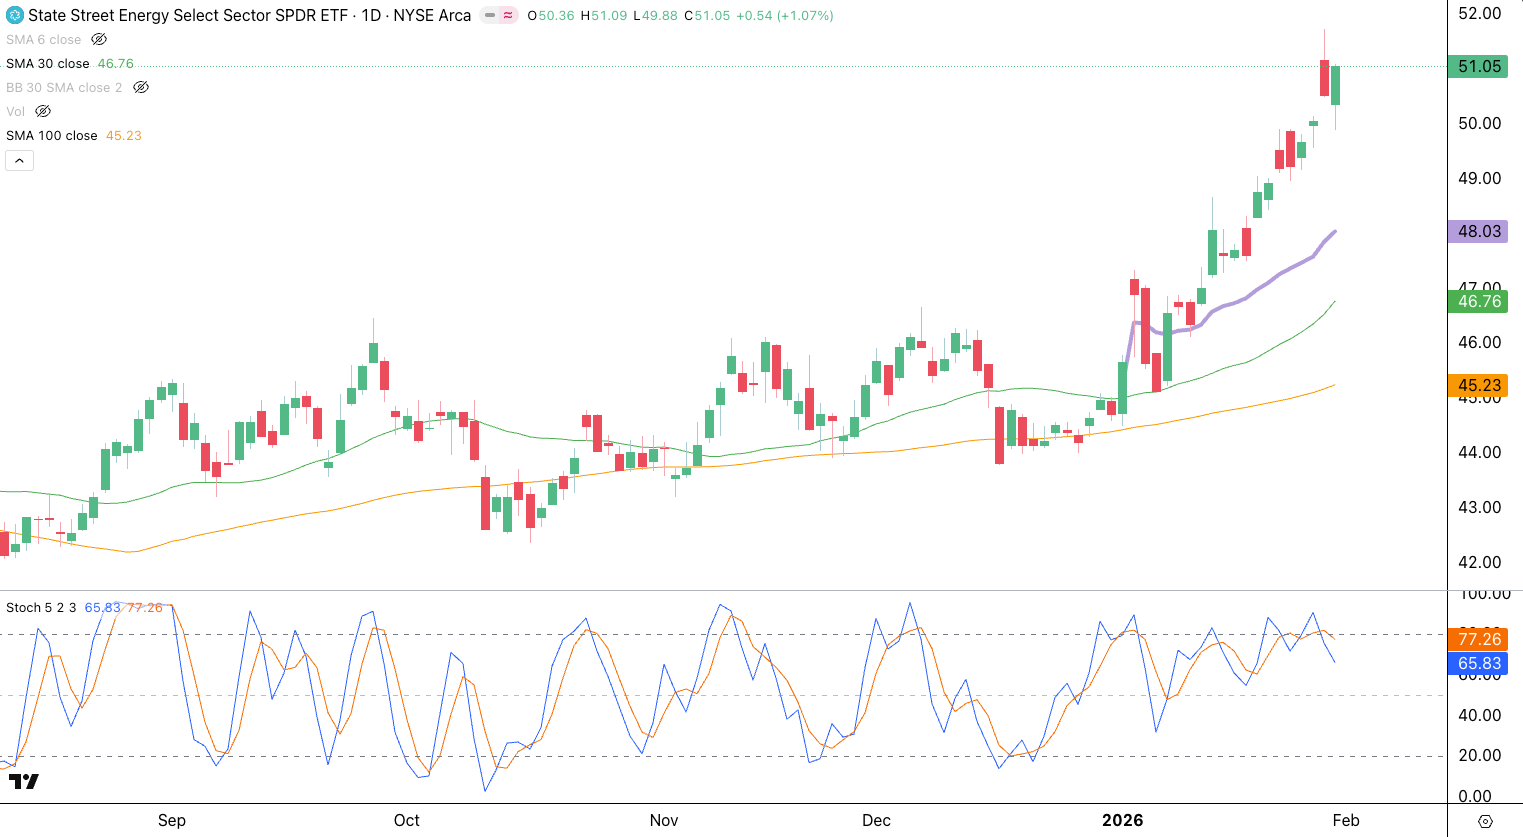
…Industrials (XLI) are going through a pause that refreshed, setting up another leg up.
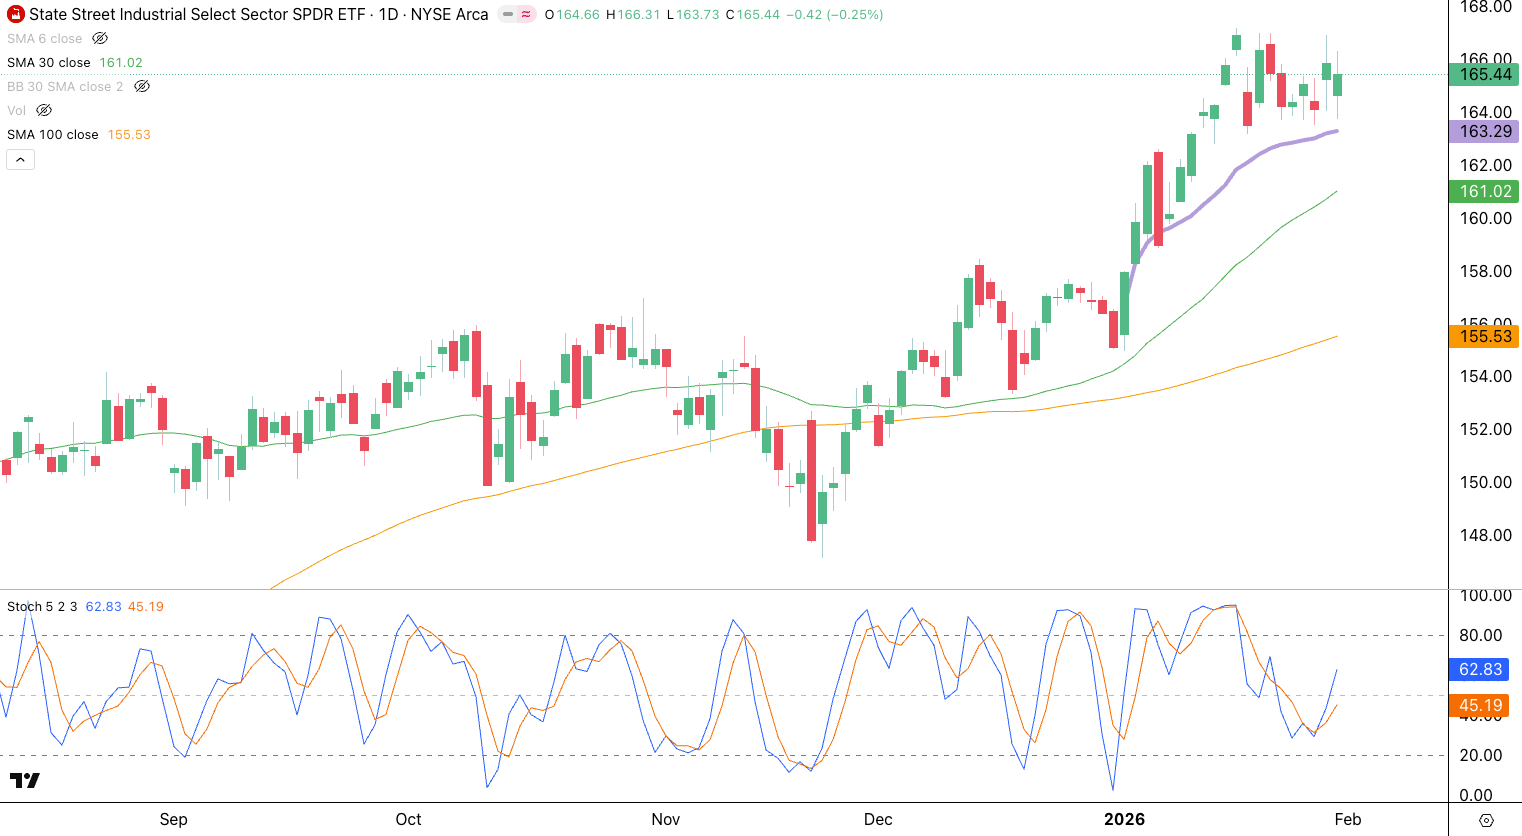
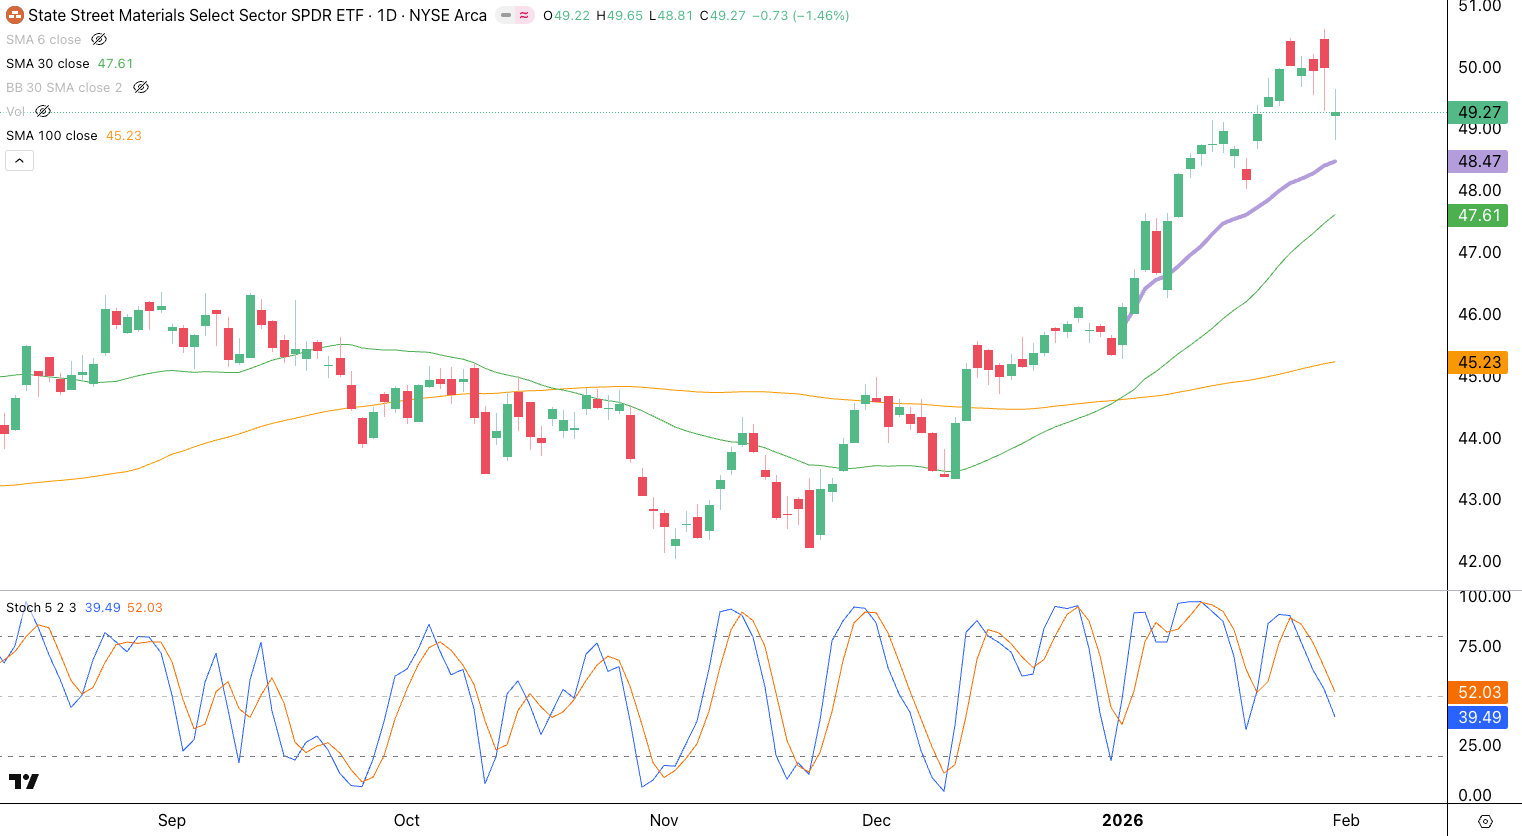
Materials(XLB) however are running into some more resistance. XLB is still above the YTD AVWAP and 30 SMA so it’s still a strong area of the market.
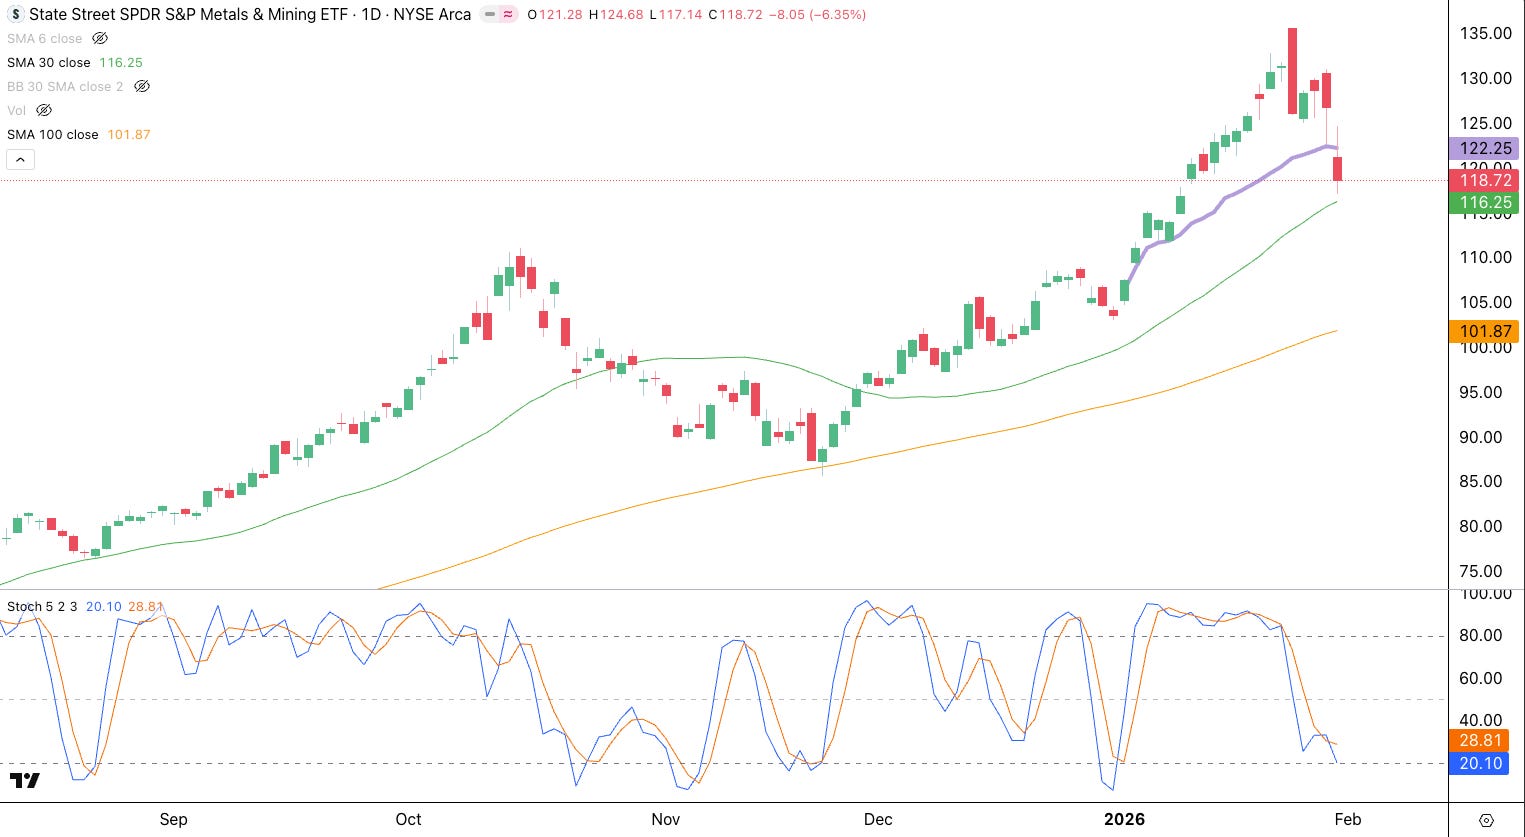
This is because Metals (XME) ran too hard and is pulling back. So far it is holding the 30 SMA, but broke below the AVWAP. This does weaken the picture for XME.
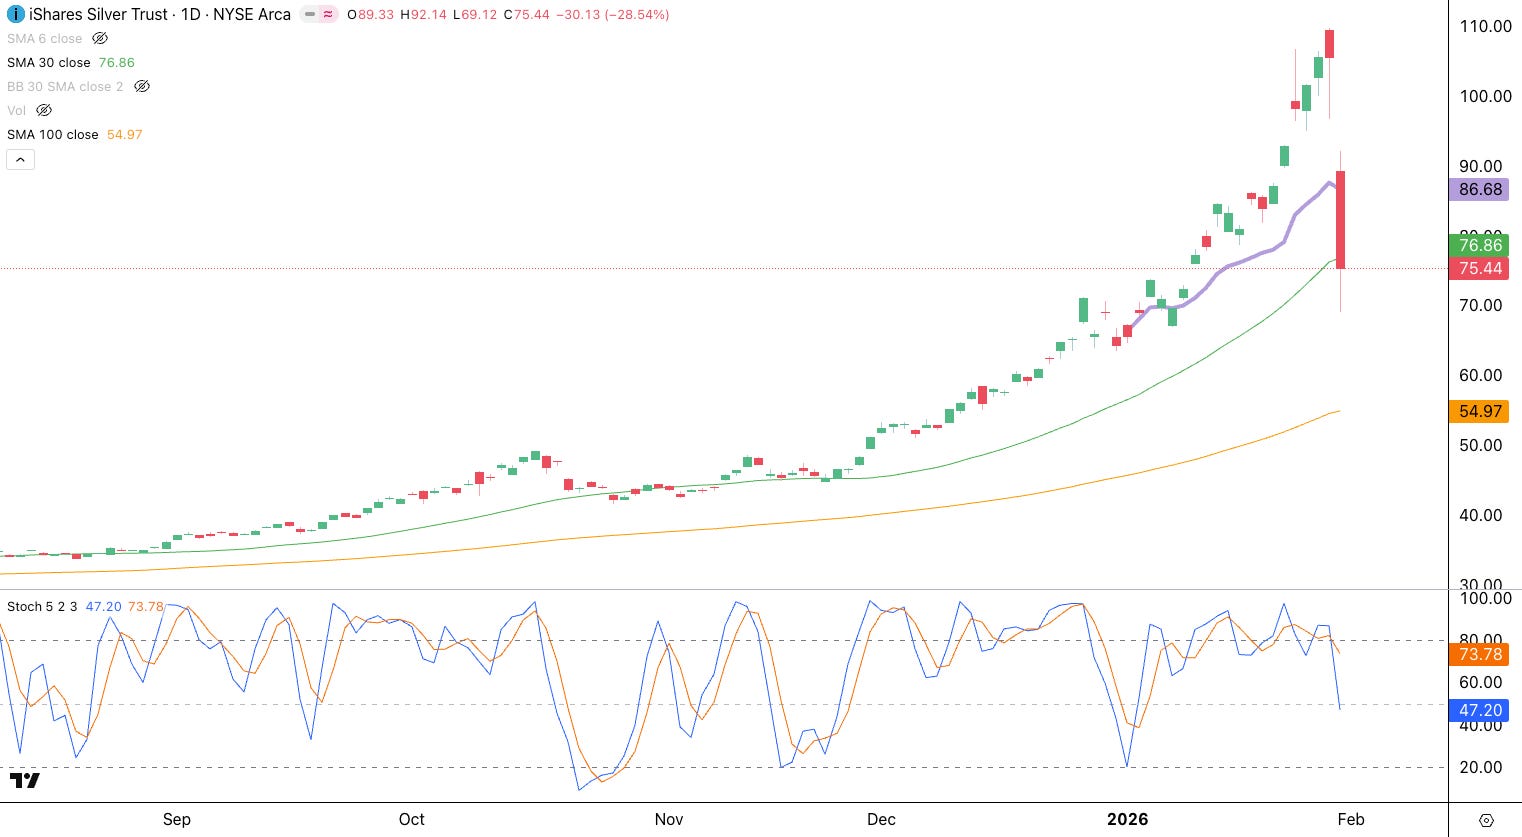
Silver (SLV) went parabolic, and parabolic moves are always followed by nasty pullbacks. SLV is now below the 30 SMA and AVWAP. For those who want to buy SLV, wait for the Stochastics (5,2,3) to make a bullish crossover before considering buying.
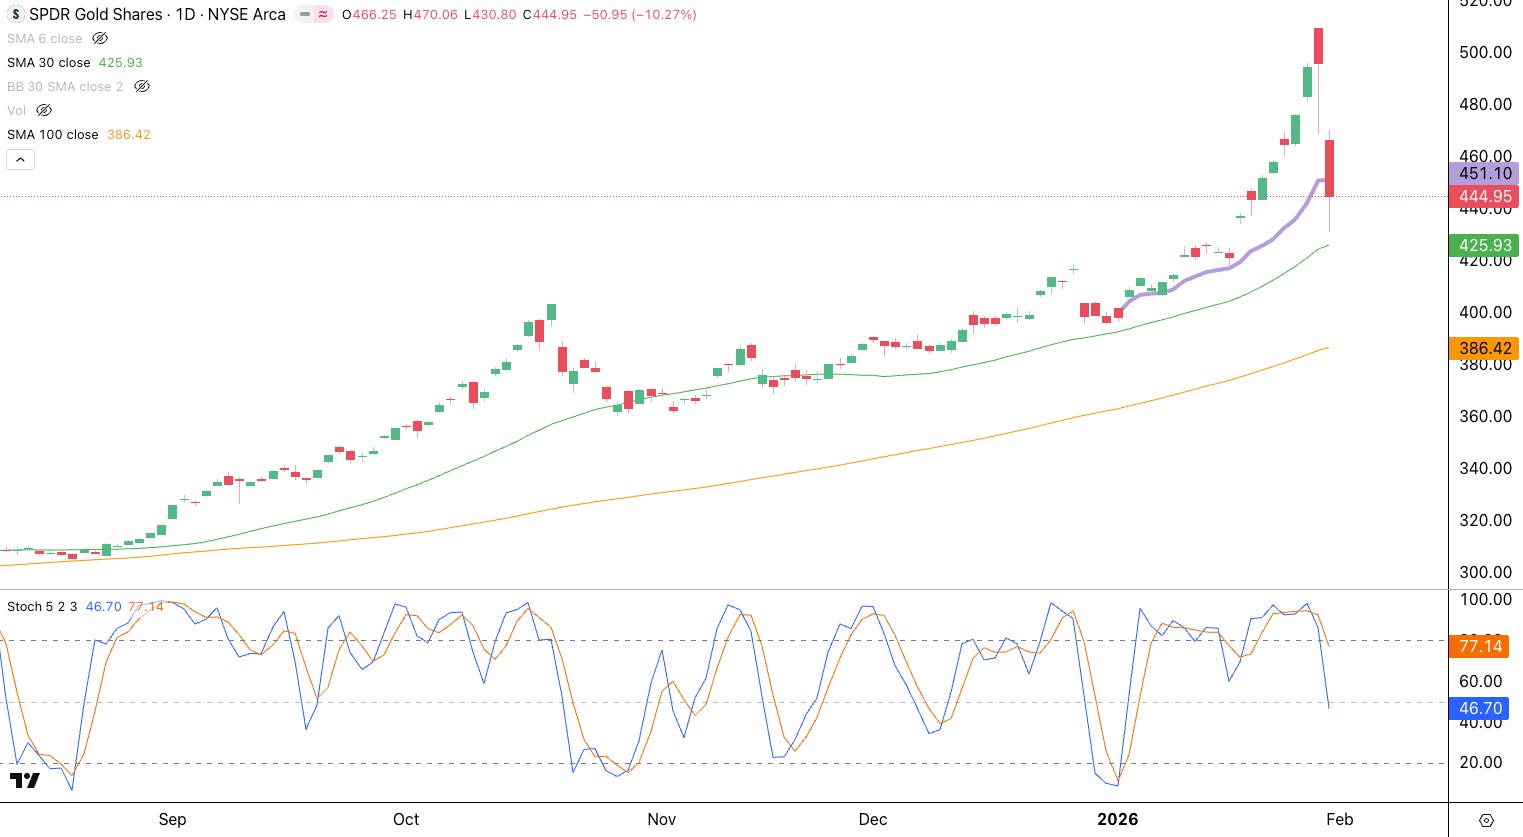
Gold (GLD) has a similar nasty pullback. It is a bit stronger as it is holding above the 30 SMA. For those looking to buy, wait for the Stochastics to make a bullish crossover.
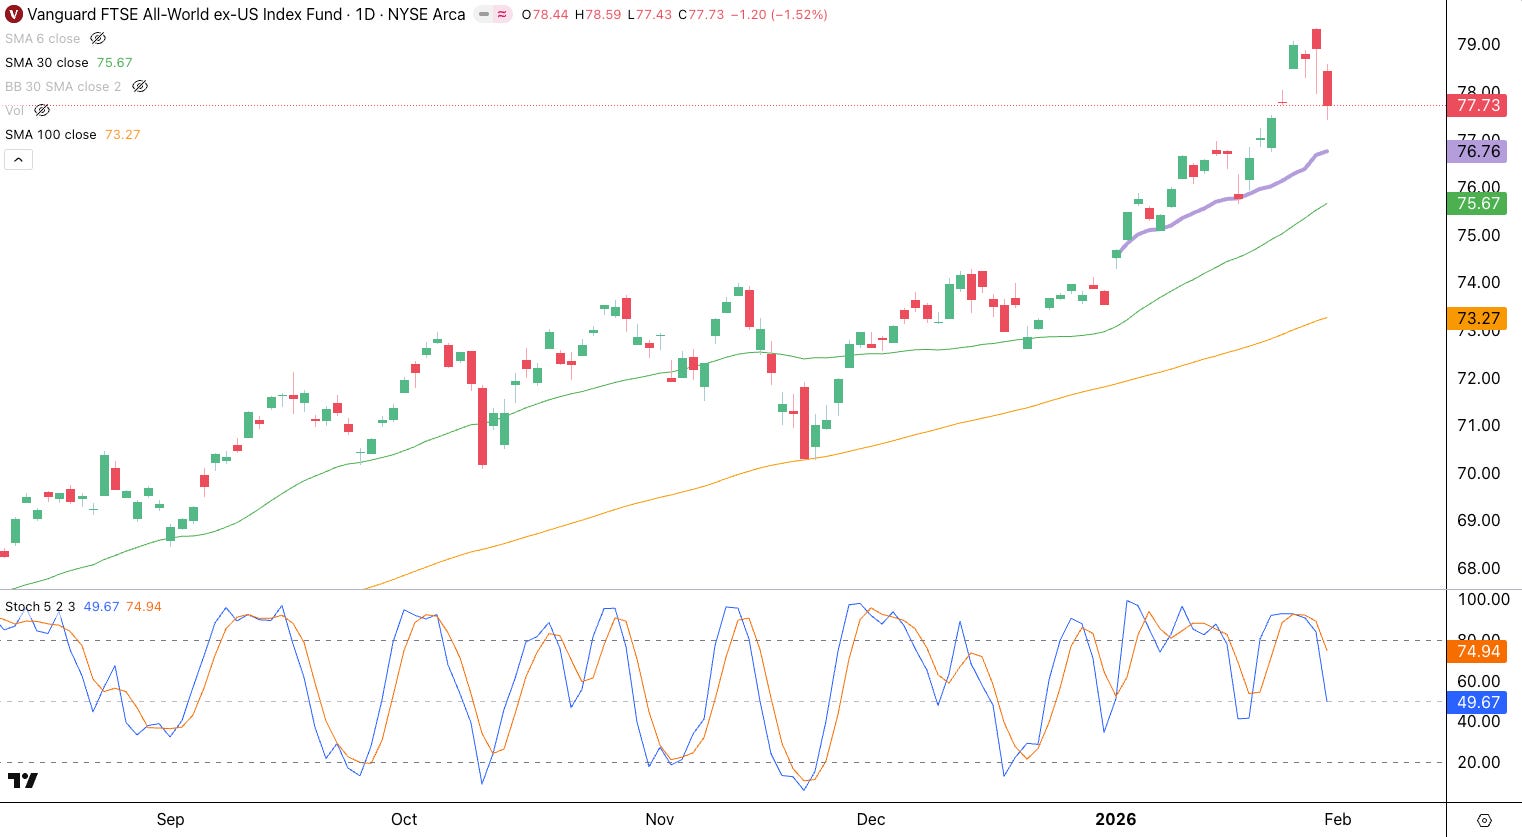
International (VEU) stocks got a bit extended as well and are pulling back as the US Dollar recovers. VEU is still above the YTD AVWAP and 30 SMA so its just having a pullback within an uptrend for now.
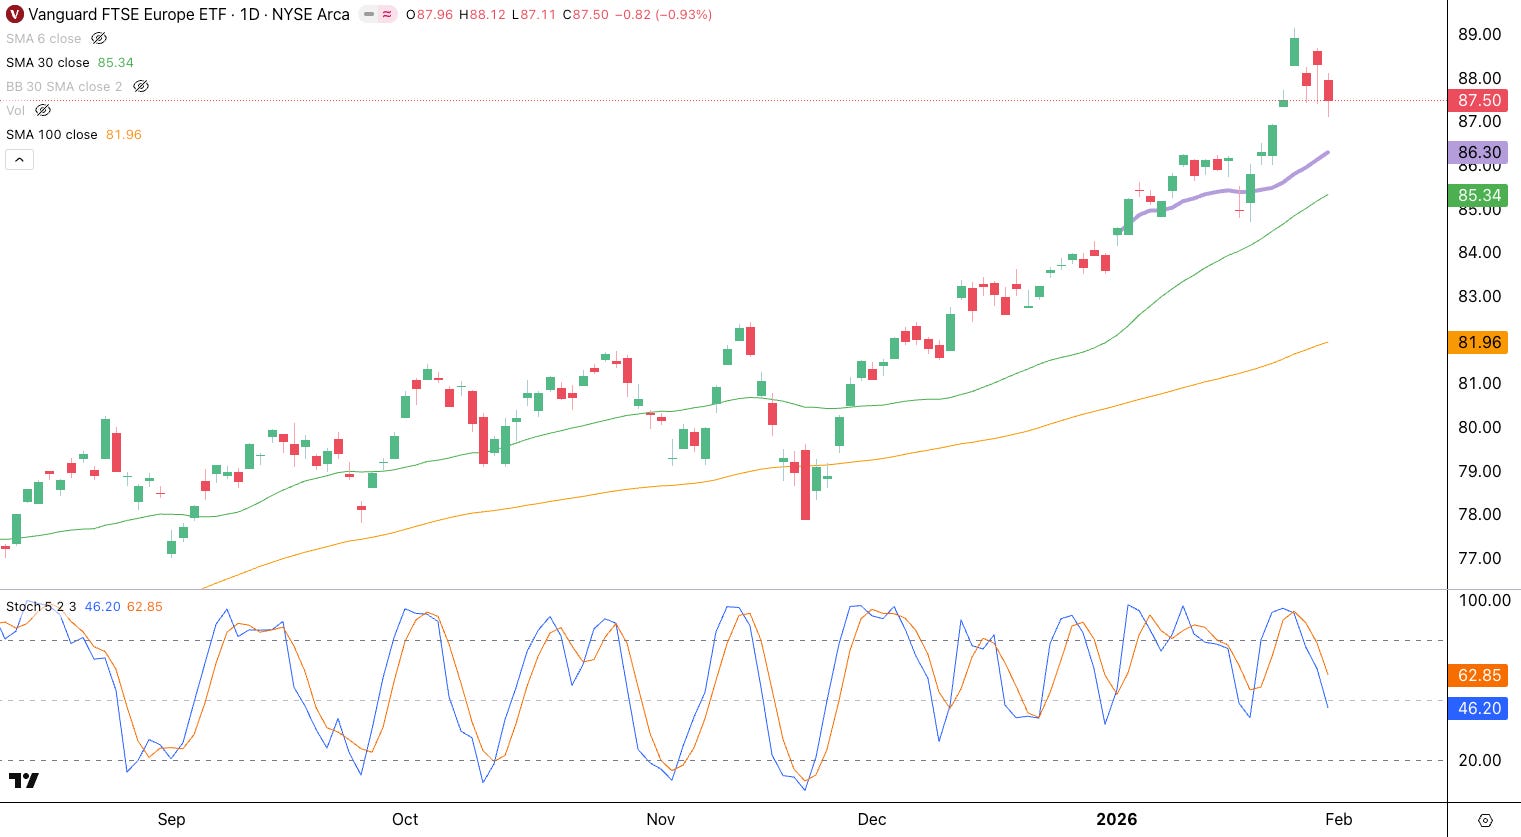
Europe (VGK) looks is an area of relative strength. notice how price is still above the YTD AVWAP.
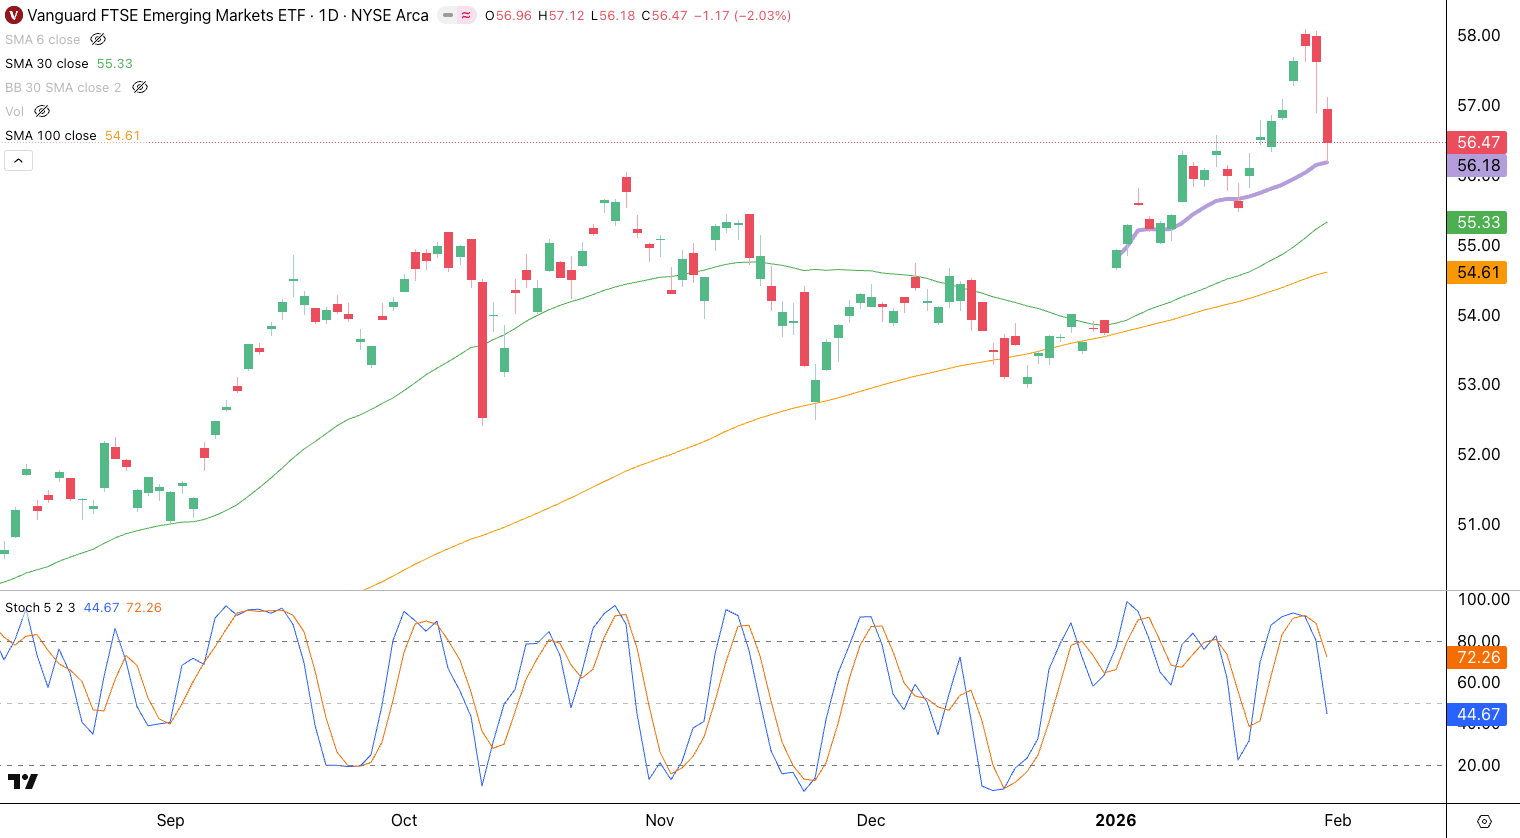
Emerging Markets (VWO) are a tad bit weaker as it tested the YTD AVWAP. Thus far, the uptrend is still intact though.
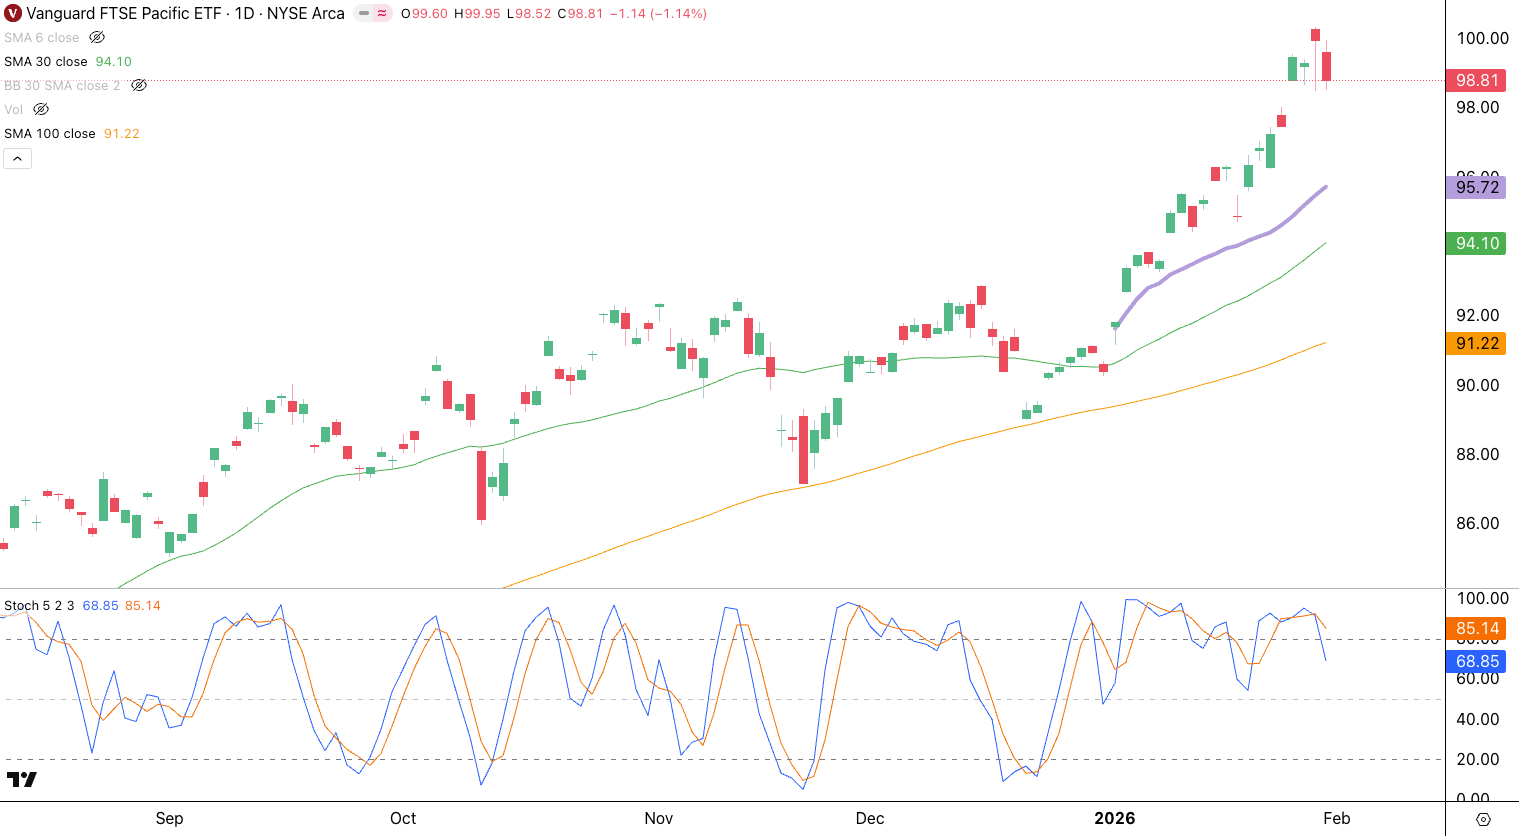
Asia (VPL) appears to be somewhere in the middle.
2026 is starting out to be a year with broad opportunities. We hope this analysis helped. In the Premium Section we’ll go over the February 2026 Cycle Forecasts for our main asset classes.
Disclaimer - All materials, information, and ideas from Cycles Edge are for educational purposes only and should not be considered Financial Advice. This blog may document actions done by the owners/writers of this blog, thus it should be assumed that positions are likely taken. If this is an issue, please discontinue reading. Cycles Edge takes no responsibility for possible losses, as markets can be volatile and unpredictable, leading to constantly changing opinions or forecasts.