This is the right time to remind yourself that dogmatic economic opinions rarely make money in the market. The best ones get you either a spot on CNBC to squabble for a few minutes or a job as an economist (a job title not tied to making big money in the market). All jokes aside, the people who actually make money in the market are attuned to what the market is actually doing.
Technical Analysis:
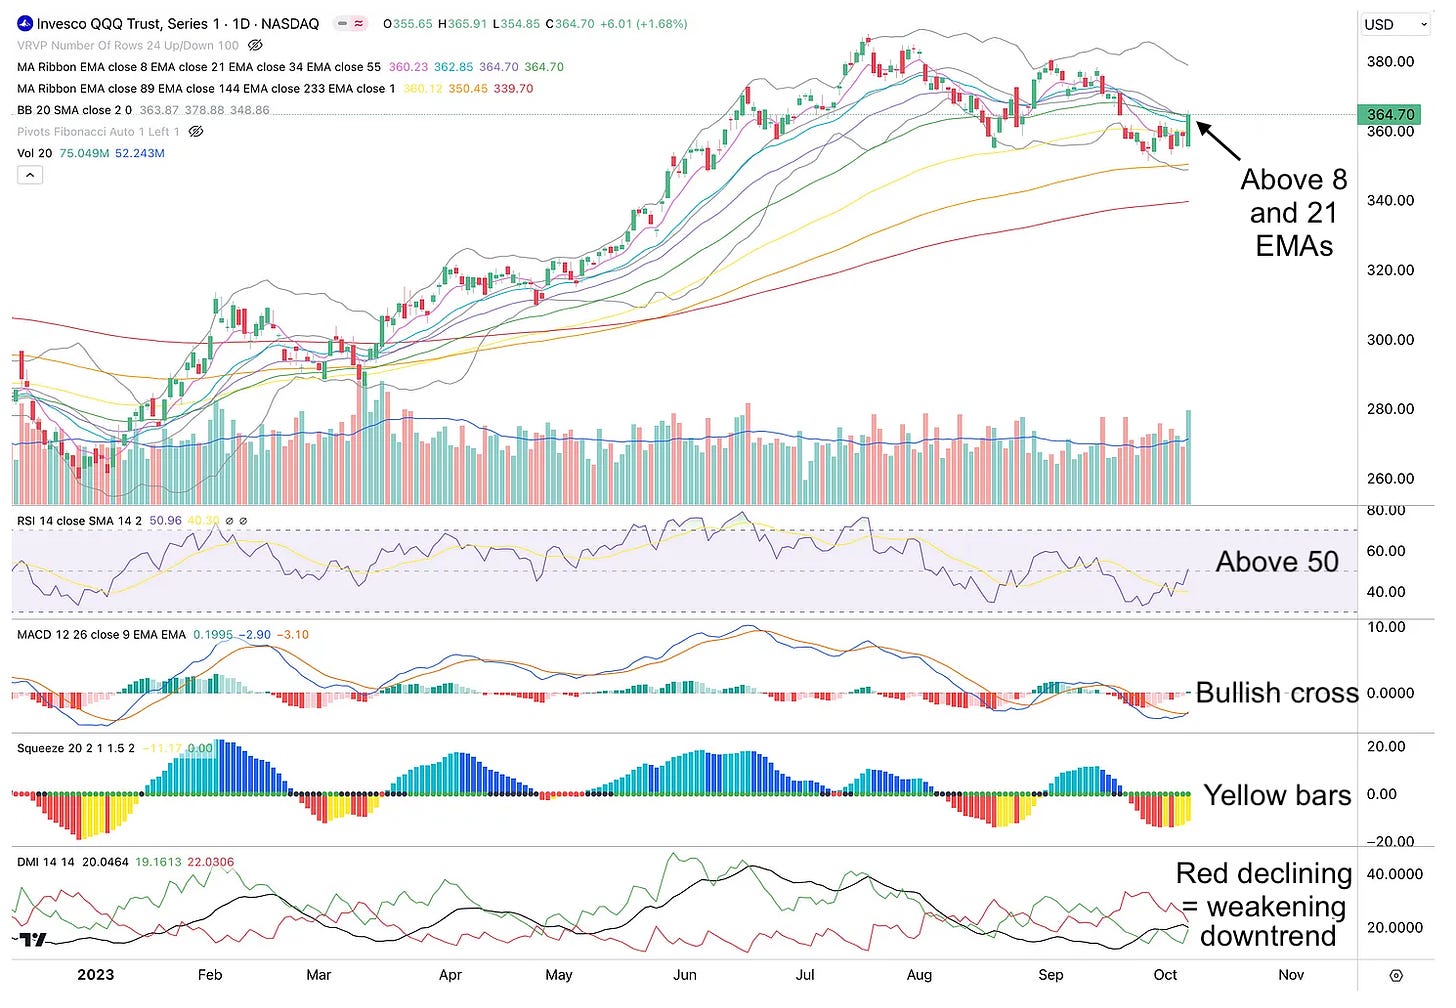
The Nasdaq 100 had a “follow-through day” on Friday, which is a gain of 1% or more on higher volume than the previous day or at least 4 days from the low. These days are a possible sign of a bottom, albeit some of them do fail. Nonetheless, the market is showing signs of a bullish complexion after an oversold downtrend.
Notice in the chart below how QQQ price is above the 8 and 21 EMAs while coming off the lower Bollinger Band. Often, when that happens, price makes its way to the upper Bollinger Band around $379. Other key developments of note are:
RSI crossed above 50
MACD with a bullish crossover
TTM Squeeze is yellow, showing waning bearish pressure
DMI is showing a weakening downtrend
The technical signals are lined up for the market to move higher as the market makers prepare to eat the bears soon.
Market Internals:
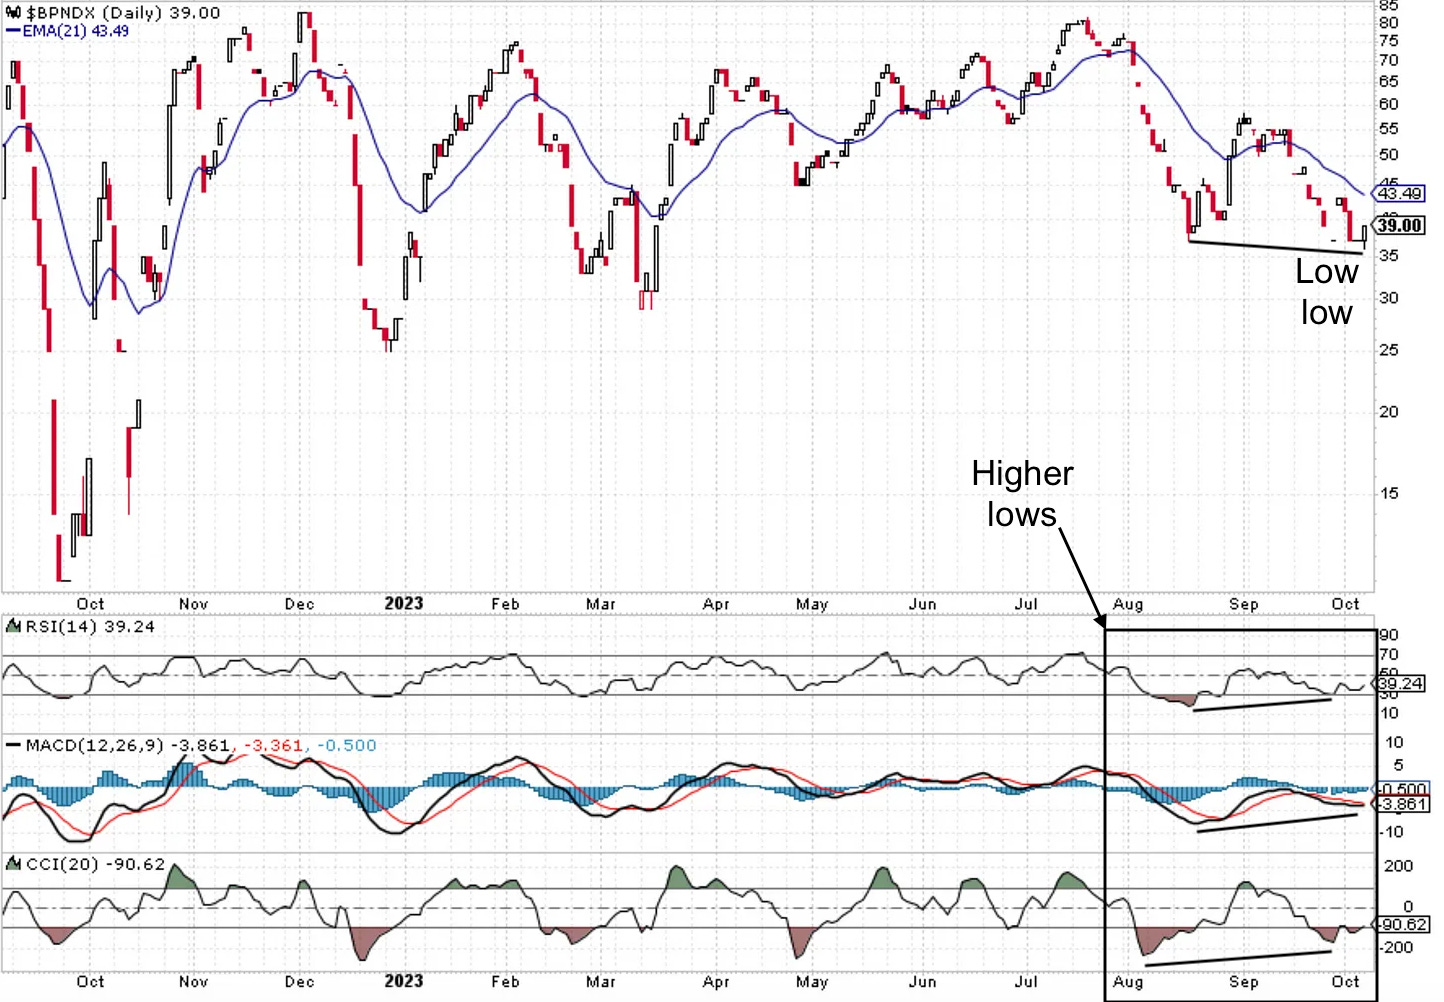
The Bullish Percent Index for the Nasdaq 100 (BPNDX) is showing bullish divergence from oversold levels on the RSI, MACD and CCI indicators. This is often the precursor to a new uptrend.
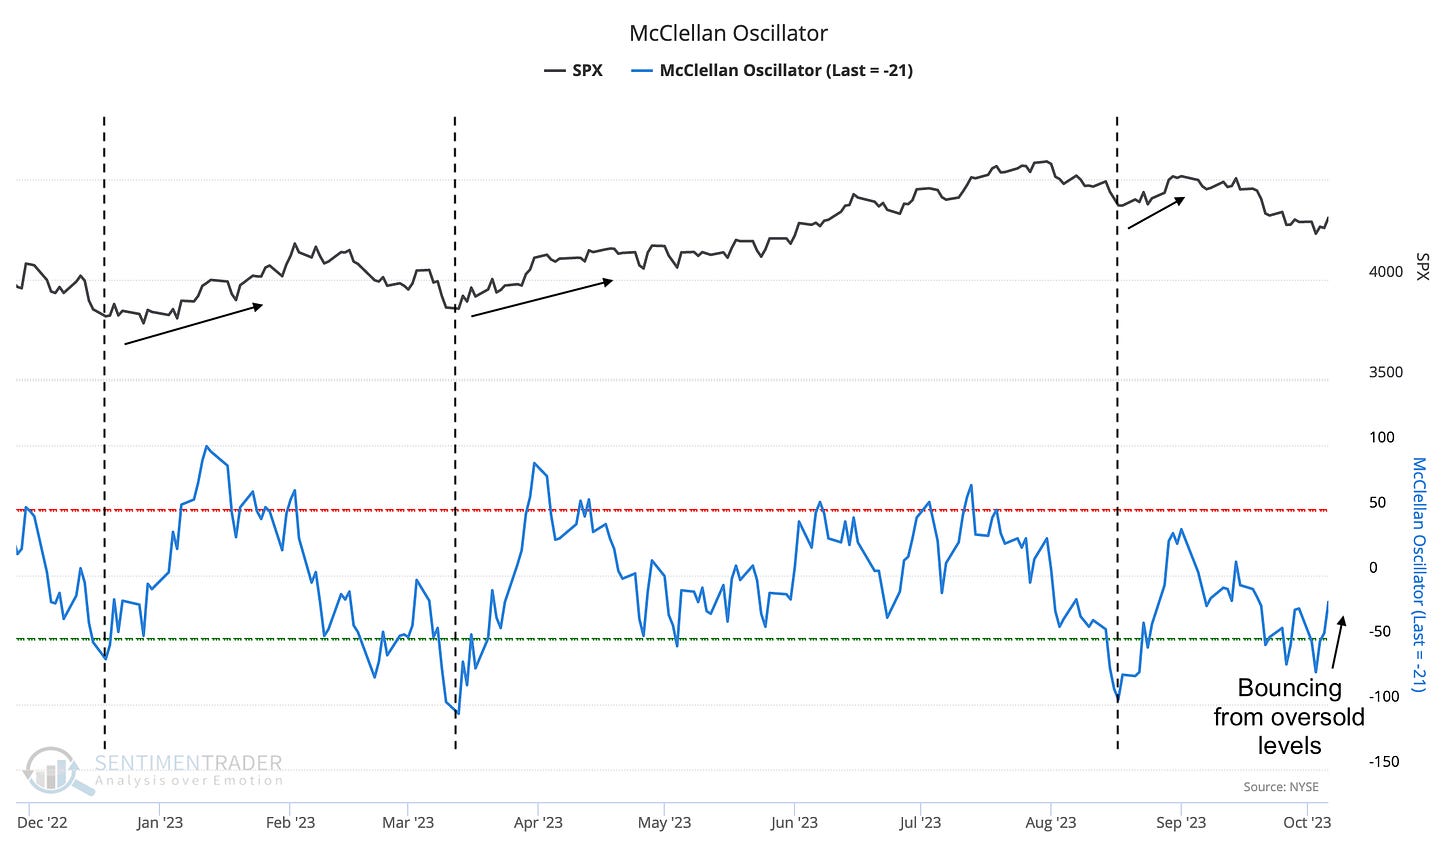
Supporting the idea that breadth is turning positive is the way that the McClellan Oscillator is now up trending from oversold levels. Similar developments have typically marked market bounces.
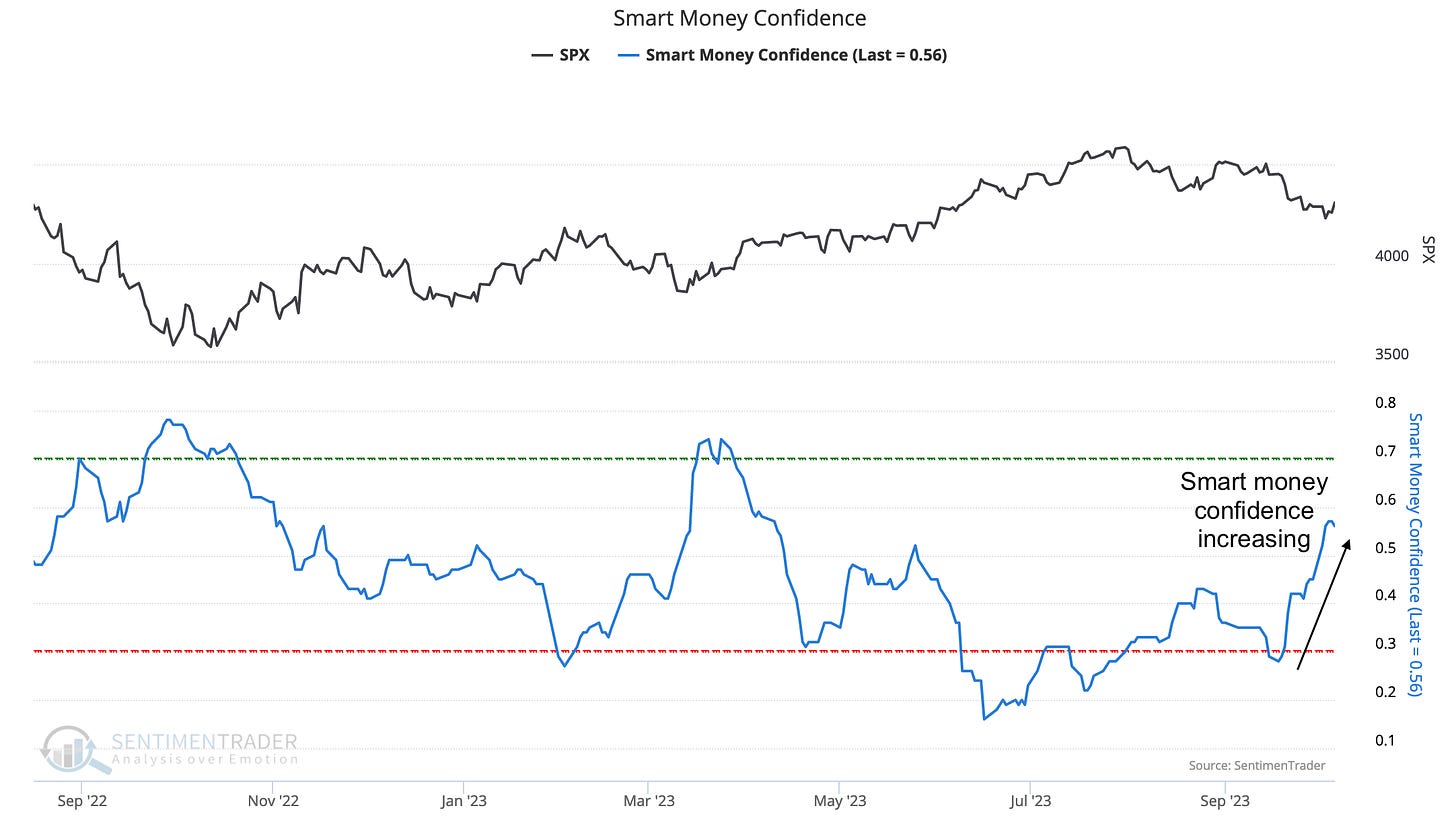
This is probably driven by Smart Money buyers who are buying early, before the uptrend is too obvious and while there is still overweighted fears in the minds of investors.
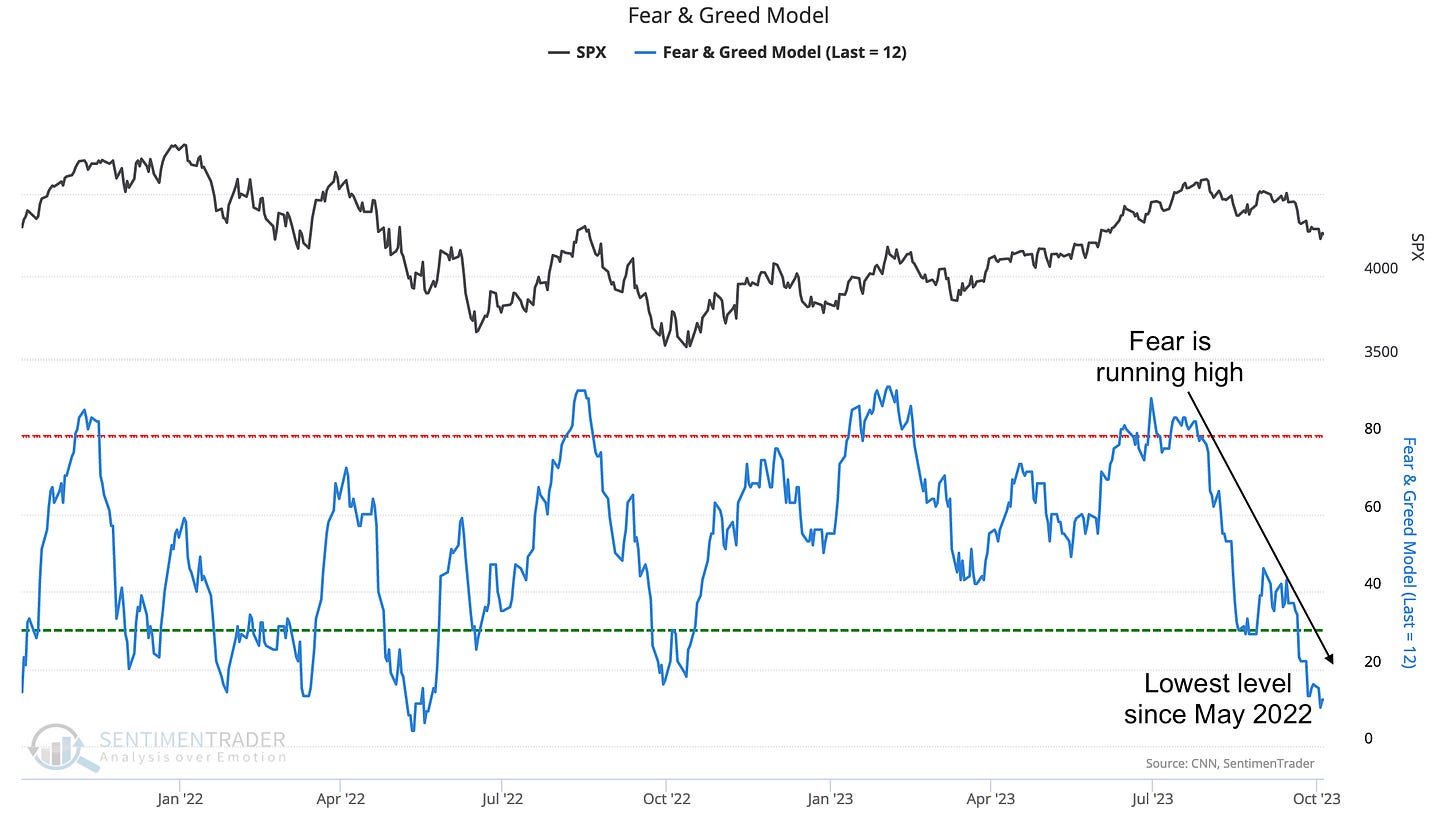
The Fear & Greed Model shows how fear is at very high levels, despite the S&P 500 still being in a longer-term uptrend. This metric has hit 12, the lowest level since May 2022.
Cycles:
Seasonality is making a transition from being bearish to bullish. Every year, mutual funds sell the stocks they don’t want to hold in September and October to prepare for capital gain distribution estimates that are prepared in late October and finalized in early December. Mutual funds also begin to window-dress their holdings, buying the stocks that they want to hold into year-end. This process, driven by tax rules, creates a pretty reliable tendency for a good buy-the-dip market in October until year-end.
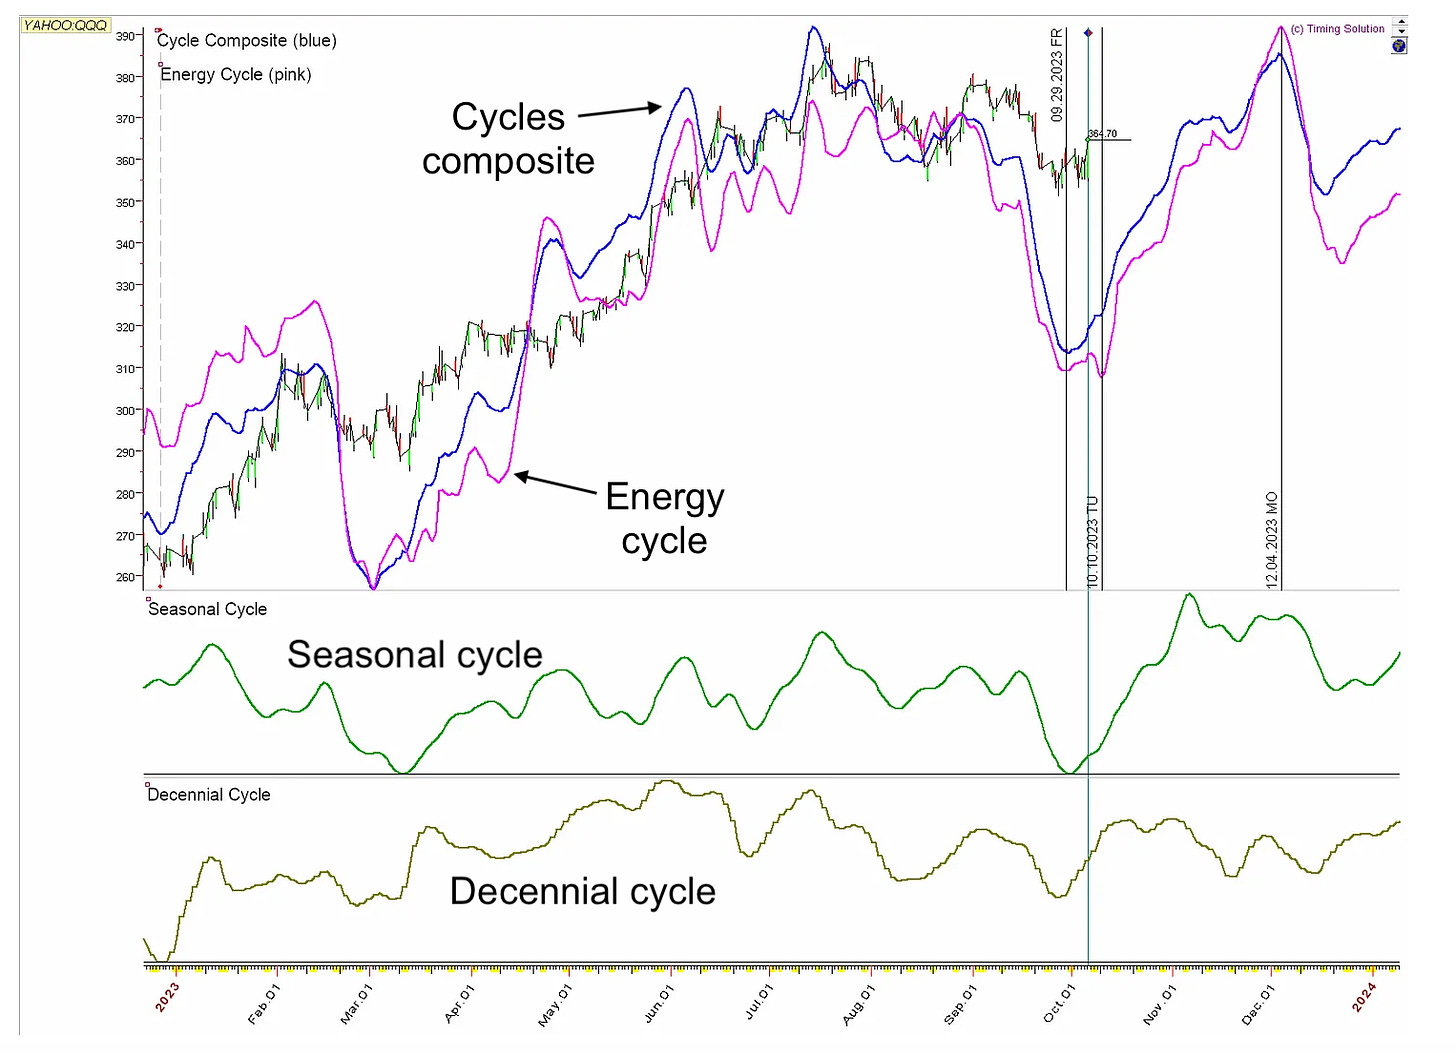
Looking at the Cycles chart of the Nasdaq 100 ETF (QQQ) below, we can see that:
Seasonal Cycle (green forecast) has already turned higher. This is confirmed by the strong performance of the Magnificent 7 this past Friday
The Decennial Cycle (brown forecast) also supports the concept that we’ve hit a bottom and it’s time to reload your portfolio
The Cycles Composite (blue forecast - our secret sauce!) shows a bottom on 9/29
The Energy Cycle (pink forecast) predicts another dip and a possible double bottom around 10/10, before the QQQ starts a strong uptrend until 12/4
New readers can find the basics of the above cycles here.
Considering the Technical, Market Internals and Cycle factors, data suggests it’s a good time to have a watchlist and start accumulating equity exposure for a likely year-end rally. Look out for a follow up article showing 5 key money-making setups!


