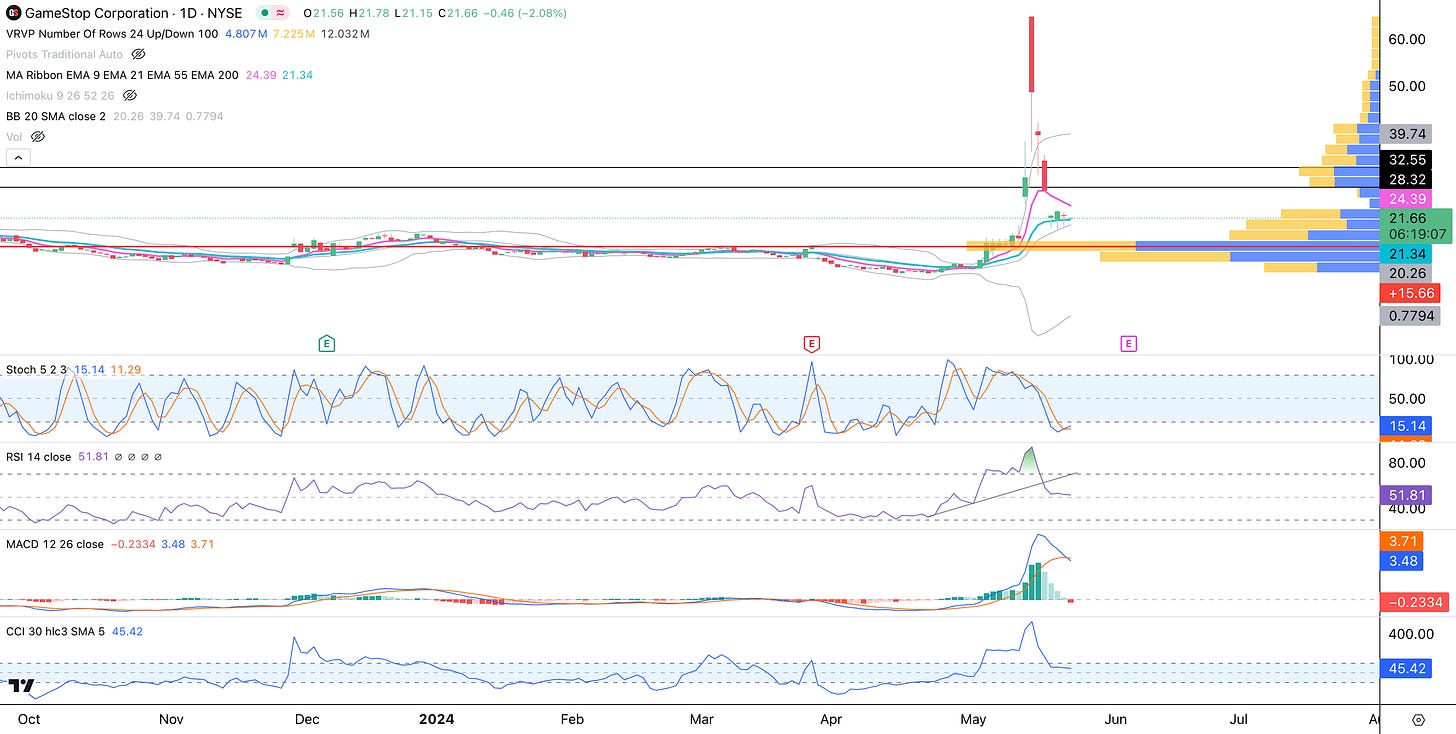
Gamestop (GME) is a highly manipulated meme stock with unattractive fundamentals. Starting 5/10 it increased by 271% over two days and then fell 65% to where it is now. It is highly unpredictable, thus a cycle bracket analysis in not applicable. The most applicable indicator are the Bollinger Bands. You can see that the upthrust exceeded the Upper Bollinger Band by a good amount. It then fell right back down to the Bollinger Band midpoint or the 20 SMA. If this stock wants to make another leg higher and trend above the 21 EMA (blue line) it may find resistance at around $24.93 or the 9 EMA , $28.32 and $32.55 which are high volume nodes (often provide strong support or resistance) on the Volume Profile. The Stochastics looks oversold and ready for a move higher and the CCI remained over 0 hinting at an uptrend. The RSI reading is mixed. It remains above 50 which tells us it still has strength, however it appears that the uptrend on RSI is broken. MACD is above 0 (bullish), but made a bearish crossover, while the histogram turned red (both bearish.
© 2024 Cycles Edge LLC
Substack is the home for great culture


