Gold has been on an aggressive run-up from the beginning of 2025 itself, rising as high at 14% (currently at 11.5%).
Demand for Gold has clearly been showing up, especially through Central Banks.
We had already know that India and China’s Central Banks have been buying record amount of Gold.
But now, demand has also been coming from US Gold imports that have seen an incredible spike in the past few weeks.
As a side note, this is also the reason that Atlanta Fed’s real GDP model has flipped negative.
Imports are subtracted from the GDP, so with record Gold imports, the value of that has caused the GDP to flip negative for now.
In other words, this move on the Fed’s real GDP model is not a recession warning, in our opinion (at least not yet).
On the weekly timeframe, Gold has been riding its 9 and 21-EMAs.
There is potential for weekly bearish RSI divergence (a downside reversal pattern), but that can only be confirmed if price has a weekly close below the 9 EMA (currently at $2830).
If it does confirm, then Gold could retrace all the way to either the weekly 21 or 55-EMAs (currently at $2737 and $2535 respectively).
On the other hand, if Gold continues riding the upward momentum (and taking the weekly RSI higher with it), then we’ll be looking for $3200 (2.618 Fib extension of the recent consolidation) as our next upside area of interest (target 1 of $2945 has already been met).
One chart that suggests that any upside on Gold can be limited is this one.
It’s the monthly Gold chart with the 5-EMA.
Gold usually tends to stick to this moving average and if it gets too overextended in either direction, then price either goes sideways or in the opposite direction to at least tag the 5-EMA again, like it did in the rectangle box.
Right now, Gold is relatively getting over-extended (especially IF it moves up to $3200).
So a pullback/consolidation isn’t too far off (maybe one more leg up).
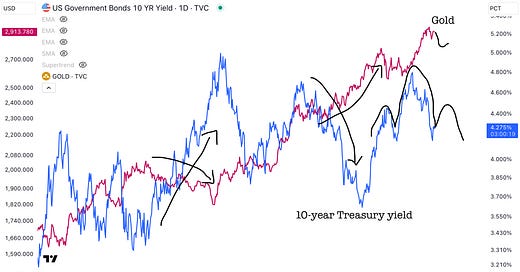
Intermarket Analysis: 10-year Treasury Yield And Gold
One way that Gold could decline in the near-term is if the 10-year Treasury yield bounces after a sharp decline it’s had.
Gold and yields are inversely correlated, so a bounce in yields could lead to a pullback in Gold.
But yields could very well be forming a potential head and shoulders pattern and if that’s the case, then a breakdown from it could be an upside catalyst for Gold after a pullback.
Silver Analysis
Silver, on the other hand, has been battling the $32.63 resistance level after holding the $28.84 support level, like we anticipated (cause of the bullish RSI divergence that formed that time).
If Silver can convert this $32.63 resistance as support and have a bullish MACD cross simultaneously, then we’ll be looking for $35.11.
But a rejection here, could see Silver retest the February lows around $30.75.
One reason Silver could pullback first is because of the US Dollar.
Silver and USD have an inverse relationship, so when USD rises Silver tends to fall, and when USD falls Silver tends to rise.
The recent rise in Silver (from $28.84 to $32.65) coincided with a sharp decline in the US Dollar.
USD also broke below a head and shoulders pattern (bearish structure), indicating that momentum has switched to the downside.
But that doesn’t mean USD will see a straight line down and after such a breakdown it’s common to retest the breakdown to confirm a rejection.
This potential bounce in USD (IF it happens) could cause a short-term pullback in Silver.
In the next section, we’ll look at Gold in detail to understand how likely a pullback really is for Gold and if there is one then how big can it be.
We’ll look at Gold’s risk-adjusted returns to understand how Gold is placed from a risk-reward standpoint.
We’ll also provide you with Gold’s Seasonality and breakdown of the monthly returns, so that our members are positioned to maximize their gains and limit their losses.
Then, we’ll provide you with our proprietary Cycle Forecasts for Gold and Silver to help you get a Timing Edge this month!
Lastly, we’ll answer the question: who will outperform in March, Gold or Silver?
Find our membership cost/benefits below. If you’re serious about Making Money (our primary goal at Cycles Edge), then the Premium Sections are key for you!


