Gold has just broken out of a massive inverse head and shoulders pattern, with a target of $2665. This would be a 23% + move from current prices, which would also imply that the precious metals space as a whole is likely to see significant upside in the coming months. Remember, necklines (at $2075 region for Gold) are often retested as support in most instances, which would present an attractive buying opportunity.
A major resistance line is on the verge of being broken, with bullish momentum and rising volatility (our “Secret Sauce” indicator in the bottom panel). The confluence of these 3 factors suggests that this move is real and has legs!
Central Banks Accumulating Gold
Central banks have been loading up on Gold in 2022 and 2023, hitting record levels. This has been an extremely bullish sign, pointing towards accumulation happening by smart money.
The top 3 Central Banks to accumulate Gold in 2023 were China, Poland, and Singapore. China has been buying Gold for quite some time, and the same holds true for a lot of the BRICS countries (Brazil, Russia, India, China, South Africa).
Intermarket Analysis
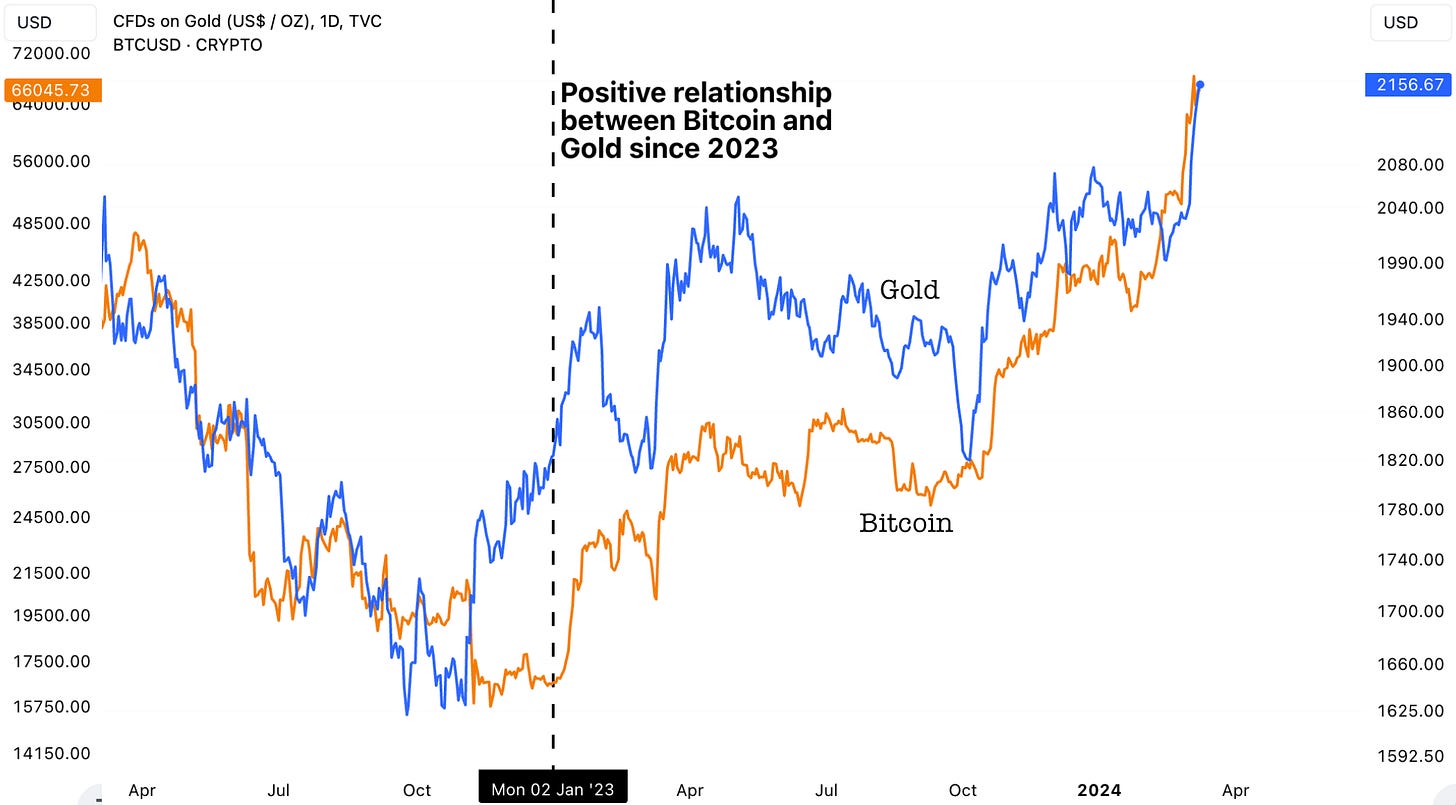
Gold has been positively correlated to Bitcoin since the beginning of 2023. With both attempting to break its all-time highs, the confluence is a promising intermarket sign.
Also, Gold has typically been negatively correlated with real 10-year Treasury yields (inflation-adjusted 10-year Treasury yield) or 10-year real yield. This can be found on the FRED website here. The blue line in the chart below is the inverted 10-year Treasury real yield i.e., when the blue line rises then real 10-year Treasury yield is actually falling and vice-versa.
Since 2022, real 10-year Treasury yields have mostly been falling (until very recently) as the Fed was raising rates and inflation was falling. However, despite the decline in real 10-year Treasury yields, Gold has still been able to diverge from its existing correlation and rise significantly. This speaks volumes towards underlying strength, especially given that the relationship hold intact since 2008 to 2022 (14 years).
Gold Cycles Forecast
The Cycles Forecast for the Gold spot equity called “SPDR Gold Trust” ($GLD) is showing sideways/downside for Gold until 23rd July 2024. This could mean one of 2 things:
1) Gold either enters a sideways consolidation period or a pullback and retests the inverted head and shoulders neckline
2) OR there is a Cycle Inversion at play (more on the concept of Cycle Inversion can be found here, after clicking on link please search for “Inversions”). If true, then Gold will end up rallying throughout until 23rd July 2024 i.e., the exact opposite of the Cycle.
At this point, price action is king and such a promising breakout cannot be ignored. As far as Gold holds above $2075 on a weekly closing basis, this breakout indicates a Cycle Inversion at play. However, a confirmed break back below the neckline would put the first option back on the table. We’ll be keeping a very close eye at the $2075 level.
Gold Cycles Bracket
The Cycles Bracket for Gold ($GLD) shows more upside until 19th March followed by sideways/corrective behavior until 5th April, where the next local bottom is likely to occur.
For our paid members, we cover 2 very important topics: Gold Miners (with setups and Cycles Forecast) and Silver relative to Gold. While Gold is one of the most trusted precious metals, it doesn’t necessarily mean that it has the most upside in a precious metals runup. However, timing is key, and that’s what the next section helps with.


