Rate cuts are coming this month, and a lot of investors are expecting Gold prices to rip because of lower rates. But, does technical analysis, intermarket analysis, statistical analysis, and Cycle Forecasts confirm this outcome as a very high probability one? That’s exactly what we’ll explore in this article. We’ll also take a look at Silver and Copper.
Gold Technical Analysis
From a big picture view, Gold is nearing a major resistance line. This line dates back to 1980 and currently sits around the $2675 level, which will be a key resistance to monitor. It’ll be quite tricky to break above it in the first attempt, so we do expect a pullback if Gold does tag this level.
Recently, Gold broke above its consolidation range (orange box) and has moved past the $2434 resistance level. This should not act as support on pullbacks.
IF Gold fails to hold above it on a weekly closing basis, then this move would become a classic bull trap/deviation and it would likely mean lower prices are coming.
For the upside target, we’re still looking at the inverse head and shoulders target of $2575 and then the $2675 region based on the previous chart.
The reason we’re emphasizing on closely watching the $2434 level is because of the 2 drives of daily bearish RSI divergence that’s formed. This hasn’t confirmed yet, but a close below $2434 would very much confirm it.
Gold has already broken below its 9-daily EMA, but is still above the 21-daily EMA (at $2482). If the 21-daily EMA also gets broken, then the 55-daily EMA comes into play, which also coincides with the $2434 support level. Therefore, watch this level closely because it’s a make or break region for the near-term.
Silver Technical Analysis
Silver’s weekly chart isn’t looking too compelling at the moment. It failed to hold the $28.84 support level and is now slightly below the weekly 21-EMA as well (sitting at $28.43). The bearish MACD continues to fall following last week’s price action.
IF this week’s close is below the weekly 21-EMA, then a move back to the weekly 55-EMA at $26.57 or to the support level at $26.13 is possible.
However, if Silver is able to reclaim the $28.84 support level, especially on a weekly closing basis, then further pullback bets are off.
On the daily chart, the MACD is about to flip bearish as Silver potentially confirms a break below the $28.84 support level. The next minor support would come in at $27.44. IF this level holds, then that could be a higher low forming, but an upward trend won’t be confirmed until Silver can then make a higher high. The first sign for this would come with a reclaim of the $28.84 support level.
We still believe in more medium-term upside for Silver with $35.11 as our first big upside area of interest, so if Silver does end up with a further pullback now, then it can be used as a buying opportunity.
Copper Technical Analysis
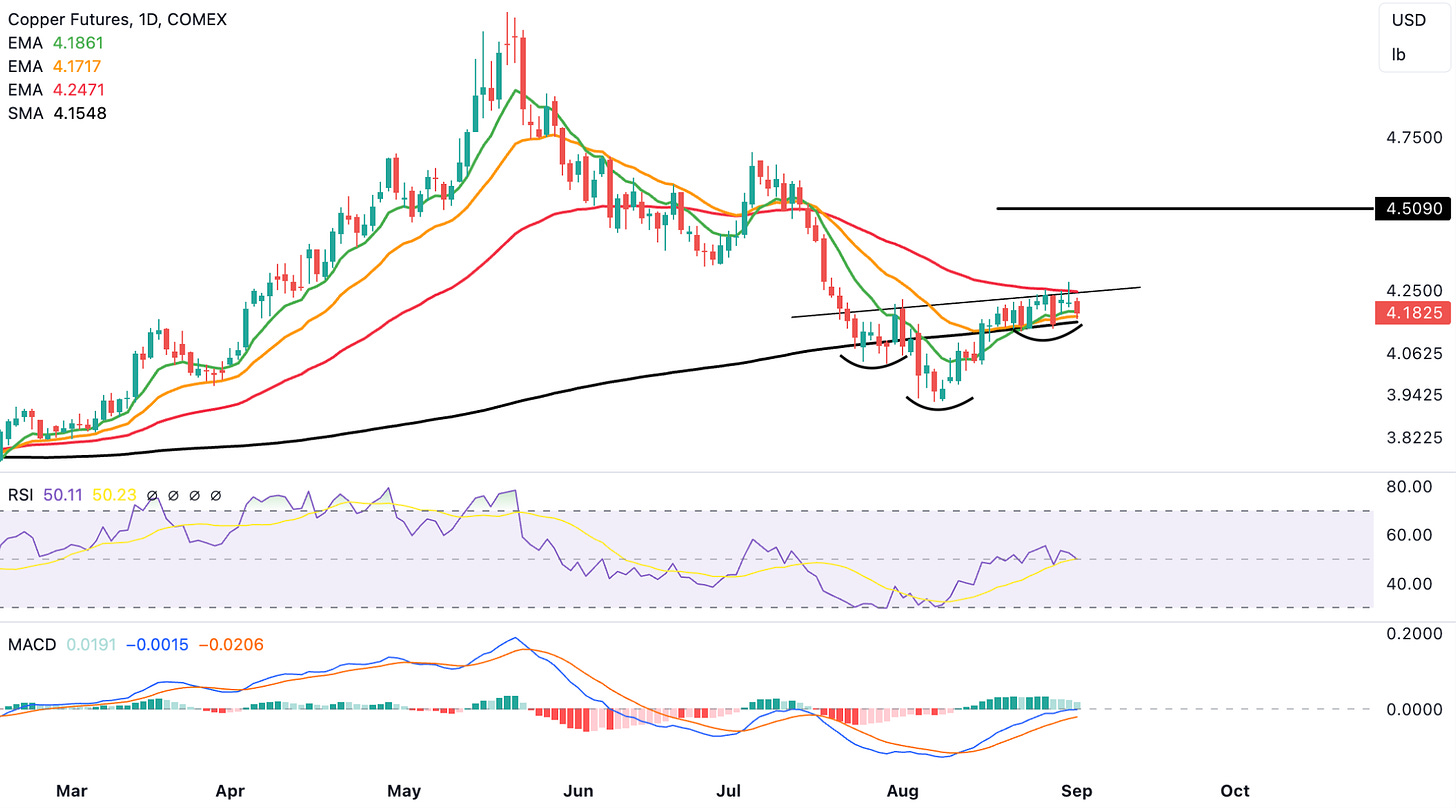
Copper, on the other hand, is beginning to put in a potential inverse head and shoulders bottoming pattern. As far as daily price doesn’t close below $4.03, this pattern is still in the works. A confirmed daily close above $4.25 (also coinciding with the 55-day EMA) would signal a breakout, with a target of $4.51.
In the Premium Section for our Paid Members, we’re going to cover:
Statistical data on Gold – A reliable dataset that would dictate Gold’s medium-term trend (You don’t want to miss this data!)
Intermarket Analysis for Gold and Silver
Our proprietary Cycle Forecasts for Gold, Silver and Copper to get a directional bias for the month of September
Statistical Data On Gold (Very Important)


