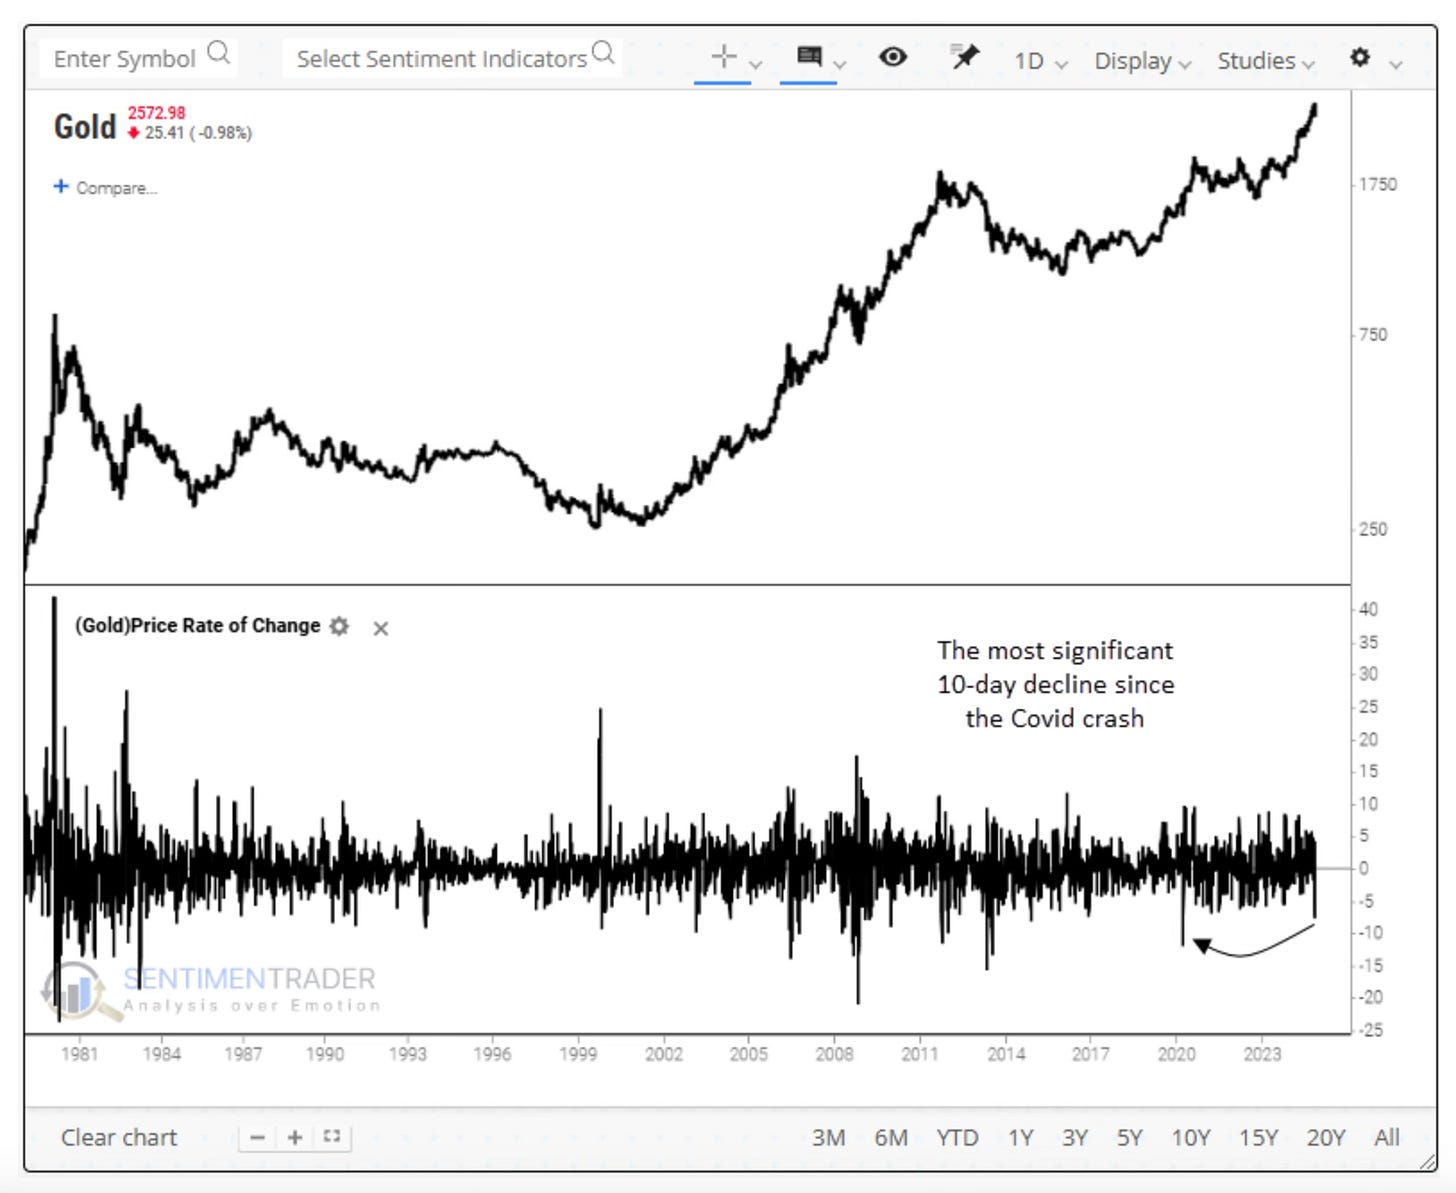
Since 31st October 2024, Gold has now declined by 9%.
In fact, Gold has seen the most significant 10-day decline since the Covid crash.
This should not come as a surprise to our members, given that we’ve been calling for a Gold pullback since around $2700.
But, what can we expect next for Gold? And what about other Precious Metals like Silver and Palladium?
That’s exactly what we’ll answer in this article.
Gold Technicals
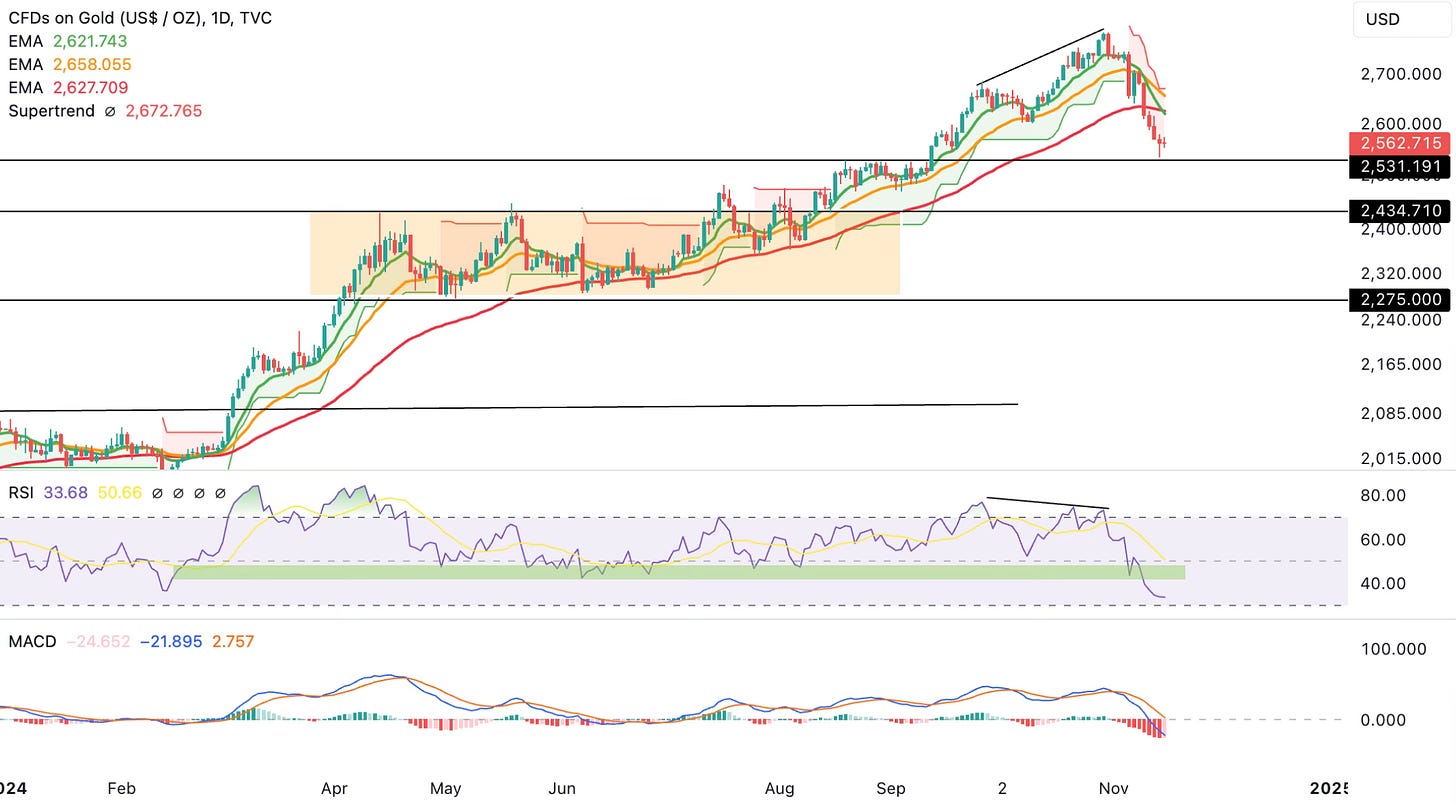
Gold has seen a rapid decline following 2 drives of daily bearish RSI divergence.
Price has now fallen to the $2531 support level, which should very likely provide a profitable bounce.
But, any bounces that fail to reclaim $2675 level (red Supertrend resistance) is very likely signaling either a retest of the $2531 support or even a potential break below it to the $2435 support level.
One important change in character to note is the break of the daily RSI below the green zone, which has acted as support throughout the run-up since March 2024. It’s too early to tell if this is an ominous sign, but we’re monitoring this closely.
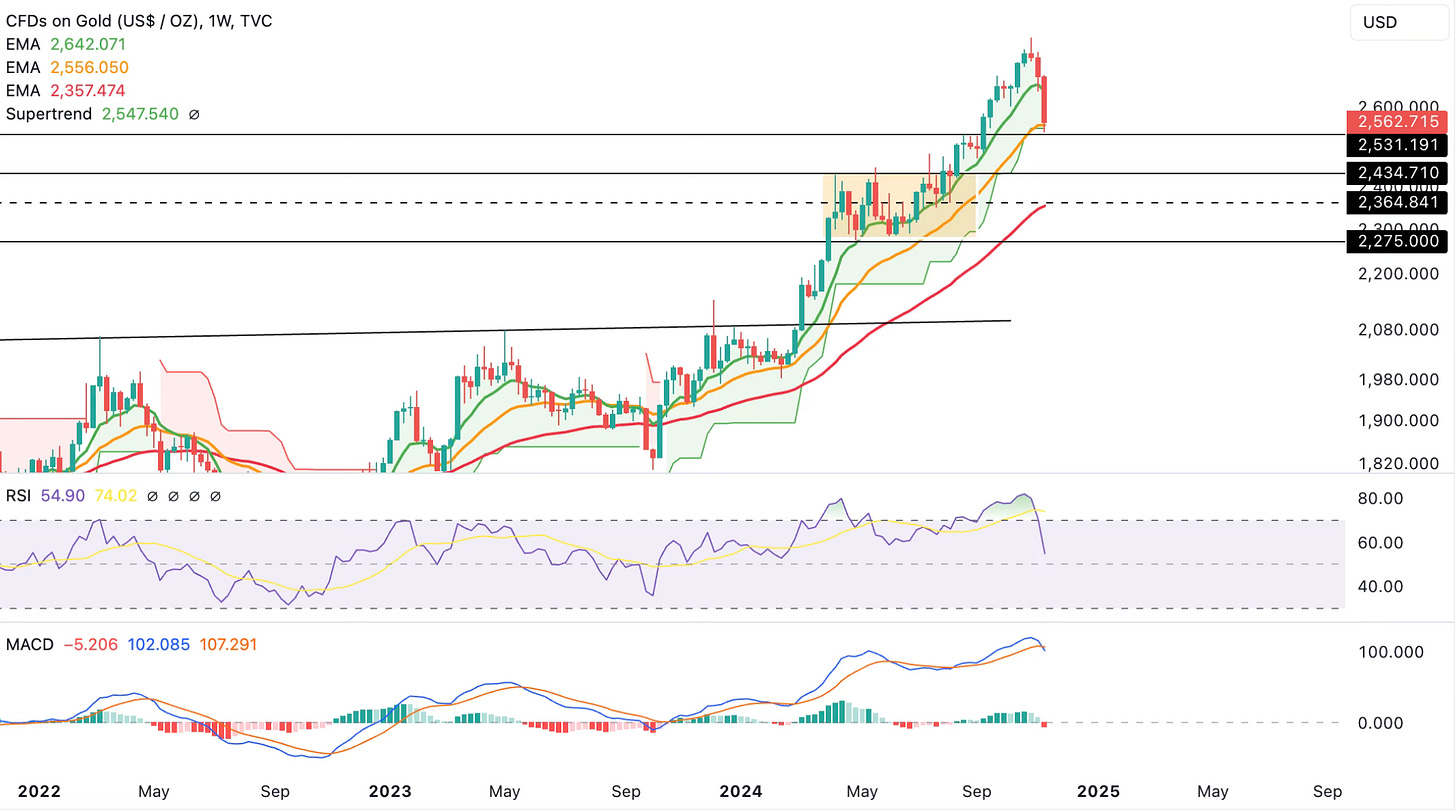
On the weekly timeframe, Gold has pulled back to the 21-EMA that also coincides with the weekly green Supertrend support.
Such a level often provides a bounce, but the weekly MACD has flipped bearish, so if the bounce fails to reclaim the weekly 9-EMA (currently at $2642) then it could signal lower prices.
Intermarket Analysis – 10-Year Treasury Yield And US Dollar
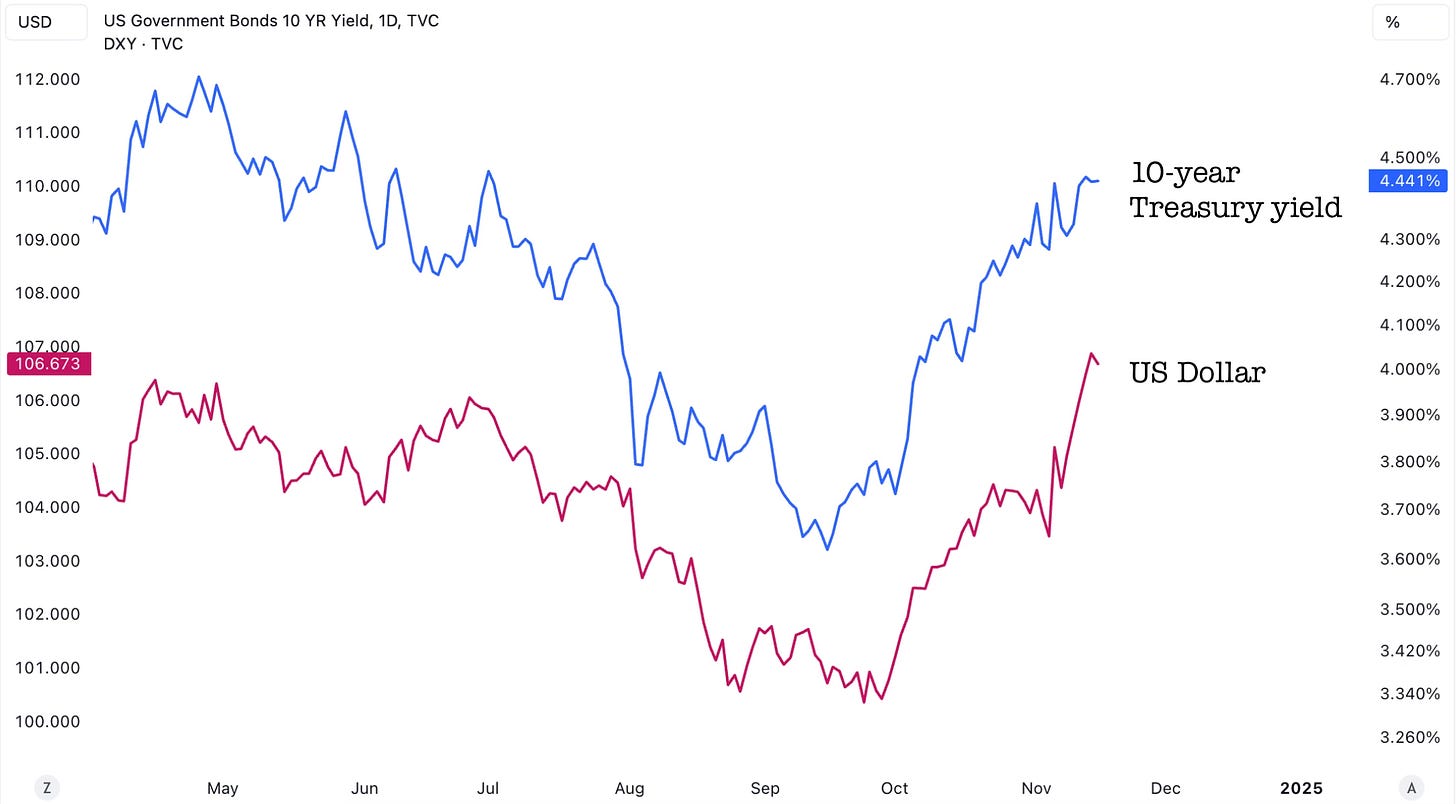
The key reason for Gold’s decline has been the run-up in the 10-year Treasury yield and US Dollar following Trump’s win.
These 2 factors have risen in anticipation of Trump’s pro-growth policies, like tax cuts, which some believe to be inflationary. Thus, it is putting upward pressure on yields and strengthening the US Dollar. However, something similar also happened when Trump won in 2016, but yields and US Dollar eventually cooled off, allowing Gold to move higher.
The recent rise in the US Dollar has also put downward pressure on Silver that we’ll cover next.
Silver Technicals
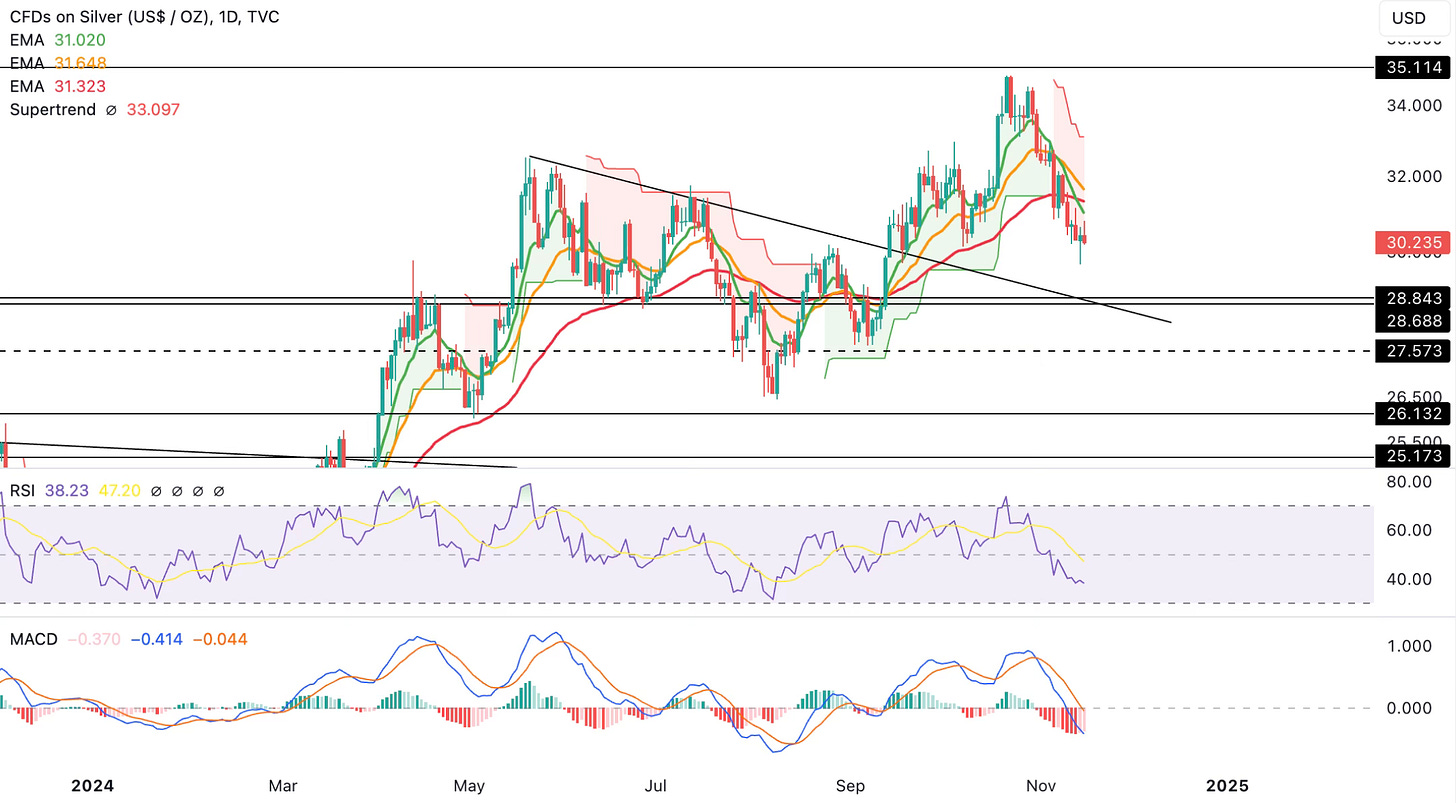
Silver missed our initial upside target of $25.11 by a hair’s breadth!
Now Silver has pulled back to Sept and Oct lows. If these lows ($30) is broken on a daily closing basis, then the next major level of support comes in at $28.84.
On the other hand, if Silver bounces around these regions (more likely), but fails to reclaim $32.21 on a daily closing basis, then that could be a warning sign because a potential head and shoulders pattern would be forming then.
While a bounce is looking more likely here than continued pullback (based on the 4-hour bullish RSI divergence), the strength of the bounce would be telling for the next bigger move.
Silver/Gold Ratio
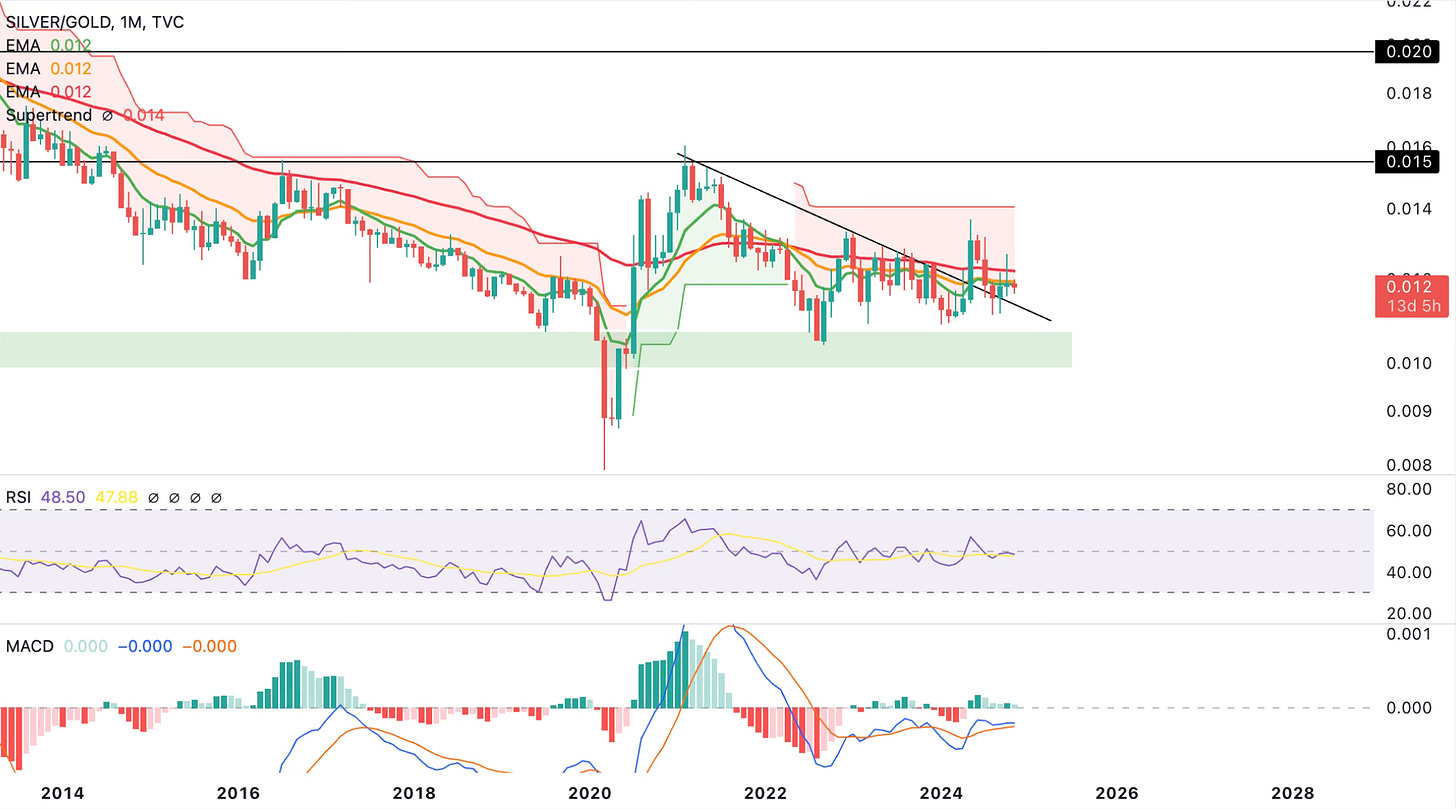
Quickly looking at the Silver/Gold ratio, it is evident that this ratio’s chart is still favoring upside, given the break + retest of the downtrend line and the bullish monthly MACD.
Remember, upside for this ratio = Silver outperforming Gold.
In the next section, we’ll first provide an update on Palladium. Then, we’ll provide a Timing Edge on Gold, Silver, and Palladium via our proprietary Cycle Forecasts. We’ll also look at the US Dollar’s Forecast to confirm the directional bias from an intermarket standpoint. Lastly, we’ll provide 2 attractive names, one Gold-focused and the other Silver-focused, that are looking attractive right now.
Find our membership cost/benefits below. If you’re serious about Making Money (our primary goal at Cycles Edge), then the Premium Sections are key for you!


