Gold, Silver & Uranium Are Confusing Investors (Part 1) – Commodity Piece
Key Intermarket Relationships To Monitor
Gold, Silver, and Uranium have consolidated/pulled back in the past couple of weeks. Is this a trend change or just another higher low before the next leg up? That’s exactly what we’ll address in this article. In the Follow Up Part 2 for this article, we’ll then analyze Gold, Silver and Uranium miners to check if it’s time to Buy, Hold, or Sell. Let’s dive in!
Gold
Following a breakout from an inverse head and shoulders pattern in March 2024, Gold had a +15% move in just a month. Thereon, Gold had started a sideways consolidation, which is still ongoing. The target for this pattern lies at $2575, so there’s still room for at least +10% from current levels.
The recent consolidation has gotten many worried if Gold is forming a local topping pattern before a deep pullback occurs. For us, until Gold breaks below $2270, the deeper pullback is just speculation. With the current consolidation (in the orange box below), the MACD has been reset.
Moreover, there’s a hidden bullish RSI divergence that has been built (you can read more about this type of divergence in an Educational Piece here), which is signaling underlying strength. This could help push Gold back up above the 9 and 21 daily EMAs, which would be a promising sign. However, $2430 is the key level to break for a move to the $2575 inverse head and shoulders target. Until a close below $2270 or a close above $2430 occurs, Gold’s structure is a typical range based consolidation.
Silver
The technicals for Silver has also been reset. In the recent small pullback, Silver has found support on its previous higher high at $28.84, which is also very close to the 55-daily EMA. While the MACD and RSI are both reset, the best part is that they both are still very much in the bullish control zone.
If Silver can hold the $28.84 level as support, which is looking more likely by the day, then the next move up can see the $35.11 resistance level being hit. However, IF Silver confirms a breakdown below the $28.84 then the next DCA level lies at the $26.44 support level. Our current bias is for Silver to hold the $28.84 support level and make a move to the $35.11 resistance level, which would be a +20% move from current levels.
Silver/Gold Ratio
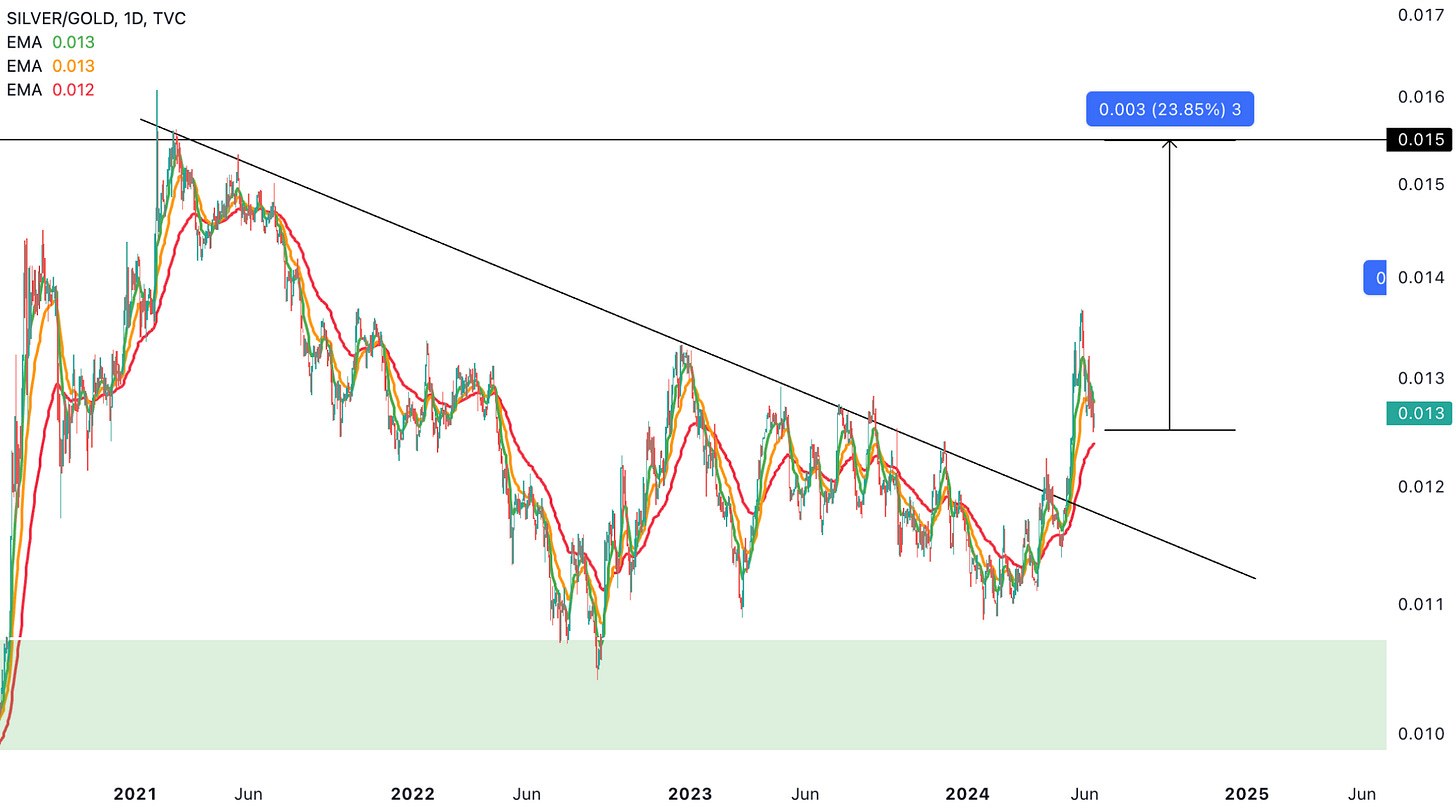
Such a move for Silver would mean that Silver would significantly outperform Gold, which is very much possible, given the Silver/Gold ratio. In our previous Gold and Silver Commodity Piece (found here), we had mentioned for the possibility for a short-lived pullback and that’s exactly what has been happening. However, now the ratio is very close to the 55-day EMA, and we believe that this pullback is nearing its end. This would mean that Silver would begin to outperform Gold once again. The best part is that there’s ample amount of room left (+20% from current levels) before the Silver/Gold ratio hits a major resistance level.
Uranium
Uranium has been in consolidation mode between $26.12 and $33.79. Of particular note, the recent high has ended up being a lower high and price is at risk of putting in a lower low. That would be a warning signal that would require close monitoring thereon. However, there’s support at $26.12 and $24.01 + the parabola support. Until $24.01 isn’t broken in a confirmed manner (2 or more daily closes below it), we’re still maintaining our bullish posturing for Uranium.
One of the key reasons being that supply is still very tight in the Uranium market and Uranium plants are not sensitive to the price of Uranium because that’s a very small % of their overall operating costs. It also takes a lot of time for Uranium Miners to come online and start Uranium production, so in a tight supply market there could be a sharp squeeze in prices even if demand remains the same, let alone IF demand starts to increase.
In the next section (only for Paid Members), we’re going to show you our Cycles Forecast for Gold, Silver and Uranium for the rest of June. We’re also going to take a look at key intermarket signals for Gold and Silver, which will help us better understand what to look out for and if the intermarket dynamics is confirming the technical analysis picture. For those that are not aware of intermarket analysis, it is basically a method of analyzing markets by examining the relationship/correlation between different asset classes.


