Note: We have a 4th of July special offer running from today until the end of this week (7th July). All people who sign up for a Paid Membership during this period can request us for a Cycles Forecast chart for any asset of their choice (any US or international stocks, commodities or cryptos). We do not believe in doing price discounts, but rather believe in adding more value whenever we can. If you join us as a Founding Member, then you’ll have the ability to request these type of charts (Cycles Forecast and technical charts) on a regular basis. Our Founding Members are also in for a surprise in the month of July!
It’s a Hot Summer indeed, and if you followed our guidance on the Summer Rally here and here, you should have plenty of profits to pay for BBQs all Summer! The S&P 500 (SPY) rose 1.91% and the Nasdaq 100 (QQQ)was up 3.56% for the week.
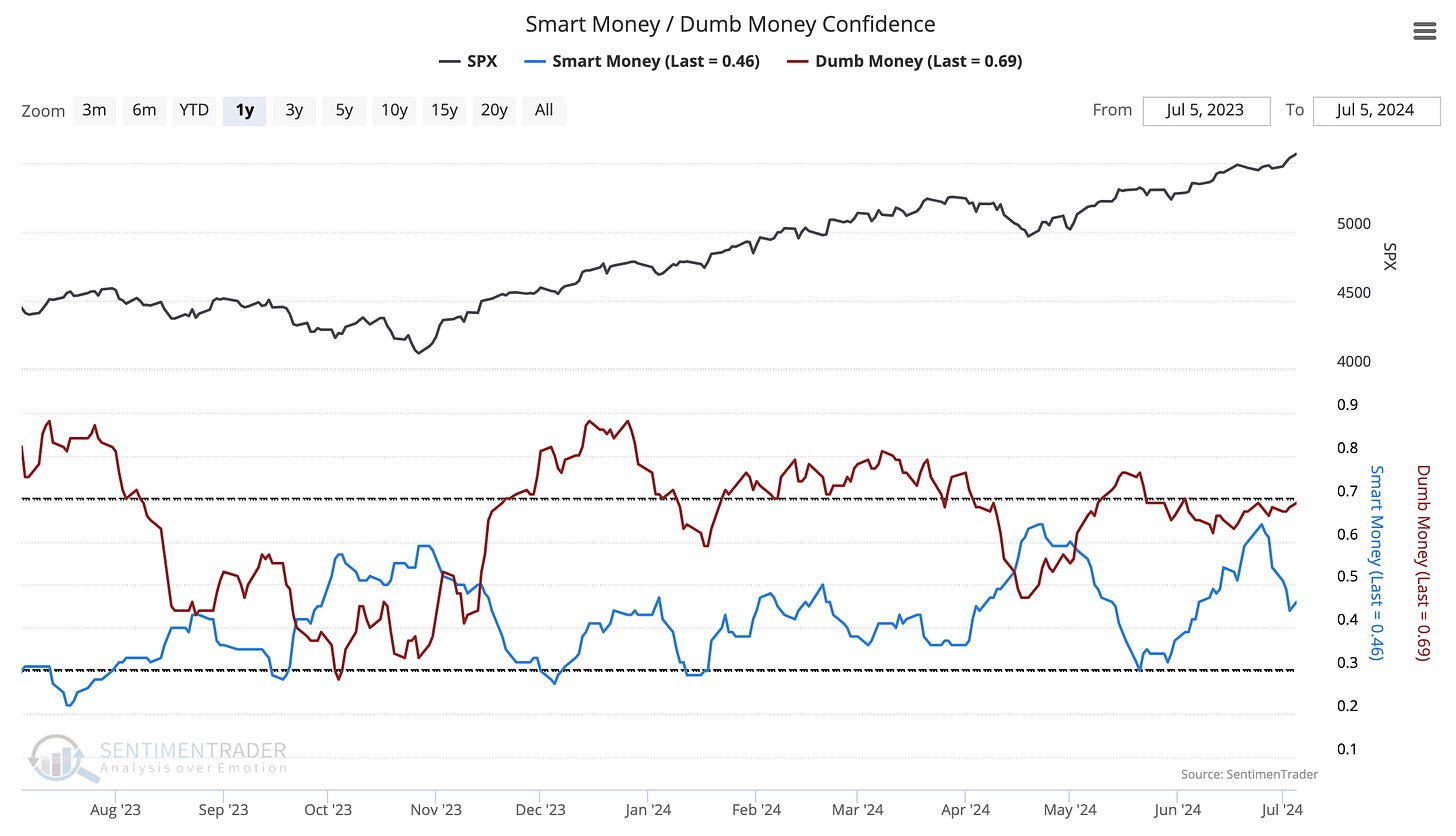
Wall Street/Smart Money appears to be selling into into strength and taking their cash-money to the Hampton Summer party circuit! Meanwhile Dumb Money is dipping their toes in the water. If the rally continues, it will probably be Dumb Money leading the charge.
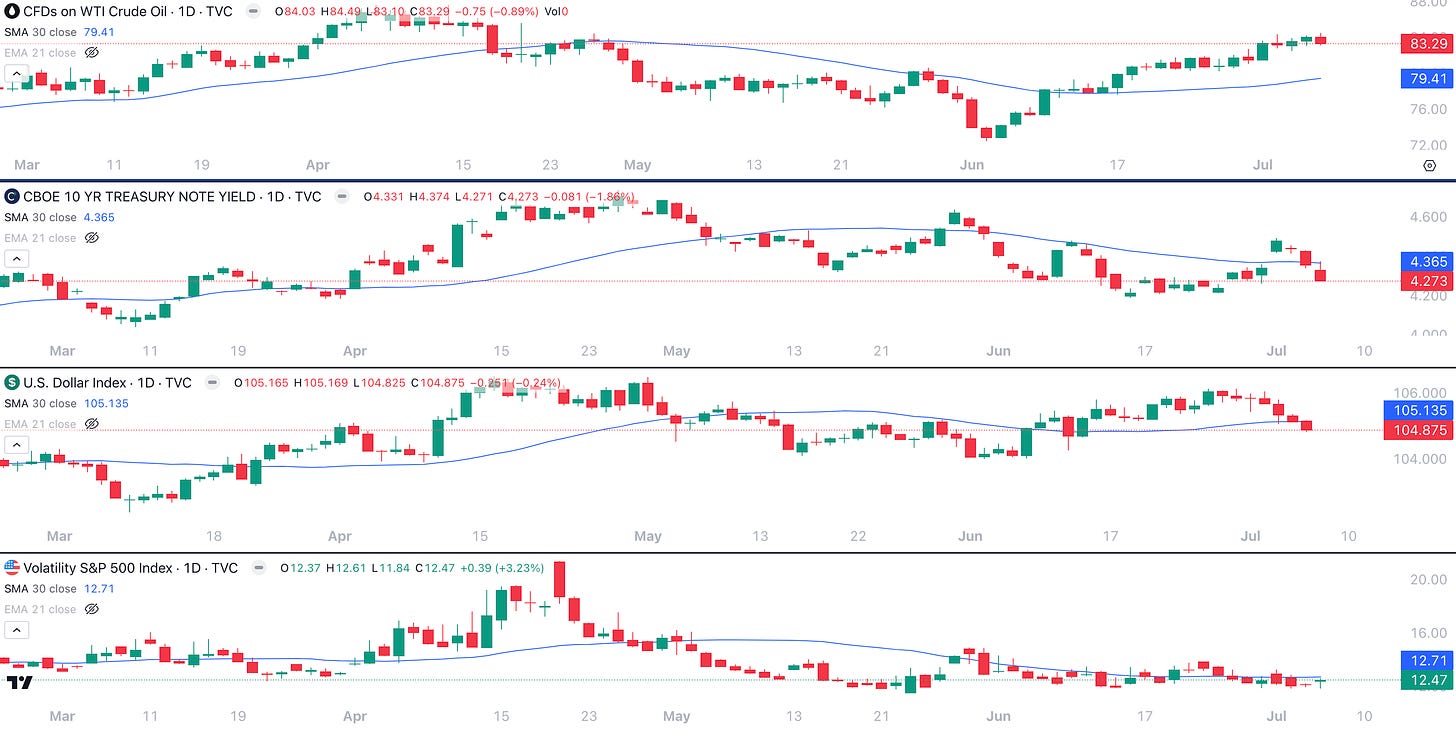
Intermarket conditions are supportive for the rally to continue as the US 10-year Treasury rate (TNX) and the US Dollar (DXY) fell. Lower Rates + Lower US Dollar = Risk On Rally. Meanwhile the VIX remains docile as oil lags. These are all perfect Intermarket conditions for a rally!
And a Risk-On Rally is what we have going on as Technology, Communication Services and Consumer Cyclicals led. As these offensive sectors lead, odds are in favor of a continued rally.
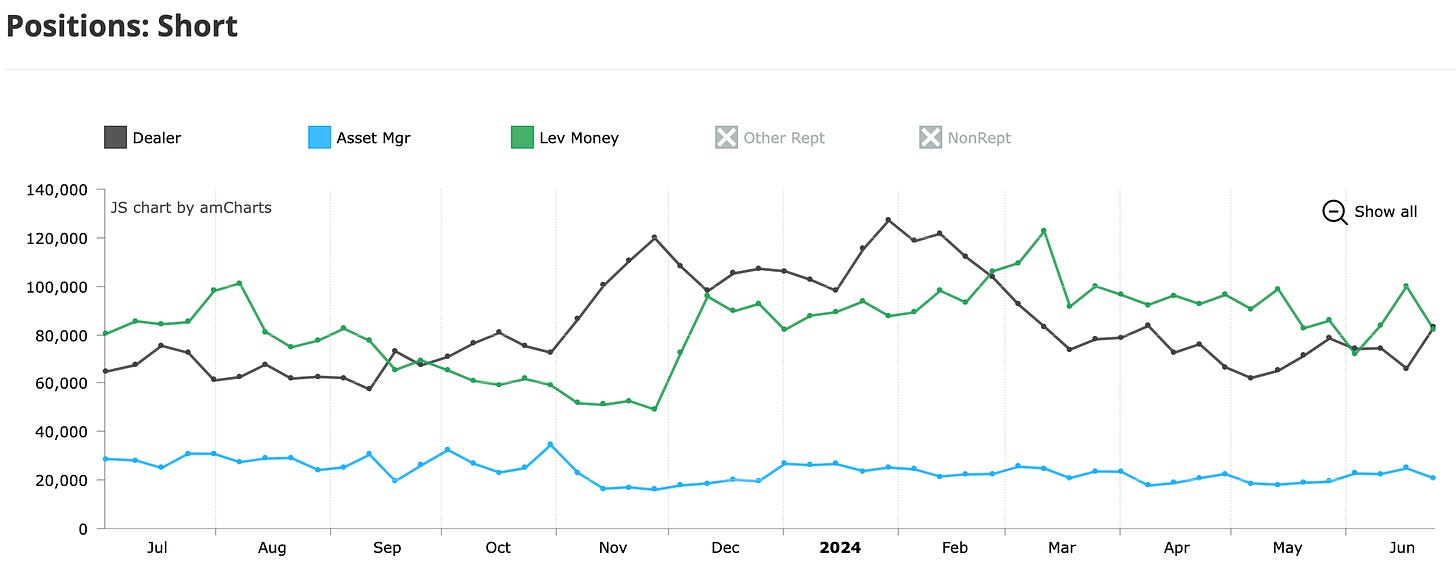
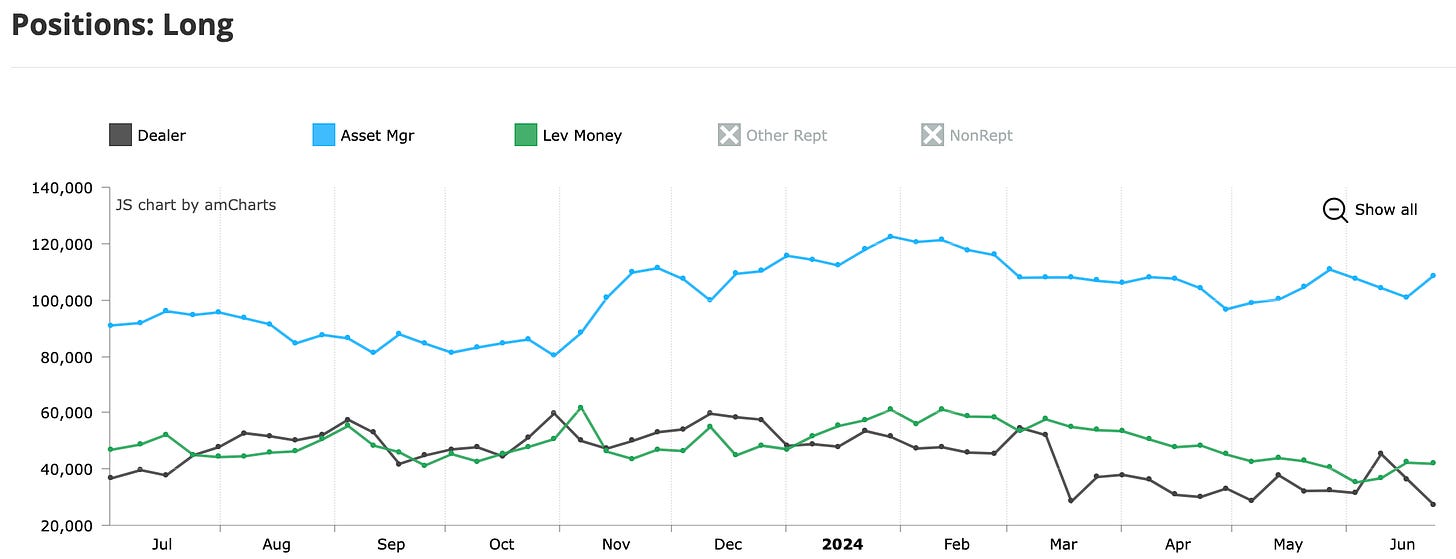
Another driver for the market going higher is that Leveraged Money (Hedge Funds) just got short squeezed. Yes, hedge fund analysts have CFAs and Ivy League degrees, but the market can trick anyone! Notice in the COT Report for the Nasdaq 100 below that Leveraged Money (green line) just exited their shorts in a rush last week.
Meanwhile, Asset Managers (blue line) continue to add long Nasdaq 100 exposure. The combination of these two factors provided a steady stream of buyers.
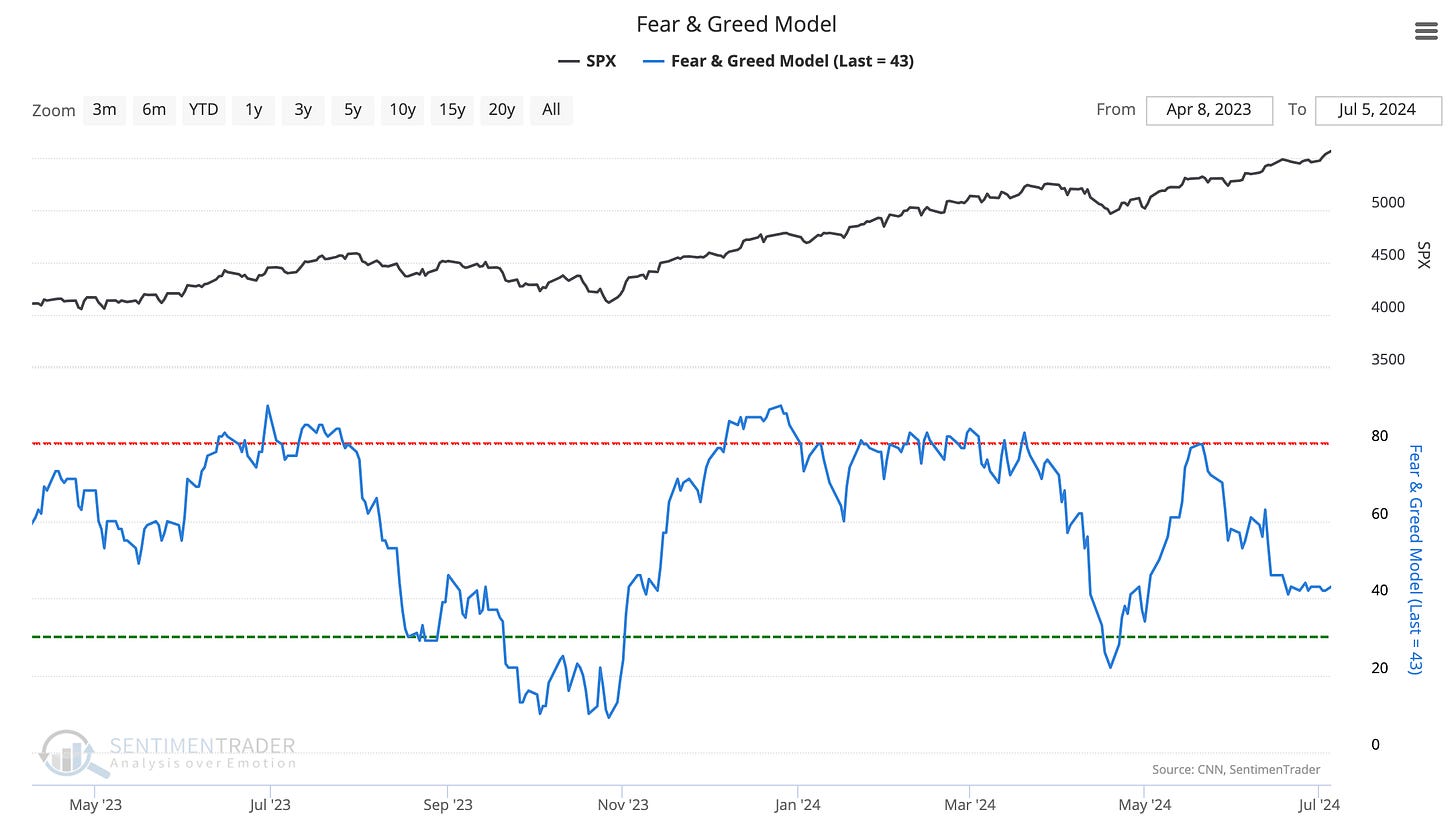
Even as the Summer Rally occurs, the Fear and Greed Model appears to be stuck in Neutral. This is probably because the masses don’t see most of their stocks going up. We warned you that Summer Rallies tend to be low breadth and low volume rallies. On the bright side, if this model could rotate to the Greed side as Dumb Money wager their bets, this rally could surprise to the upside.
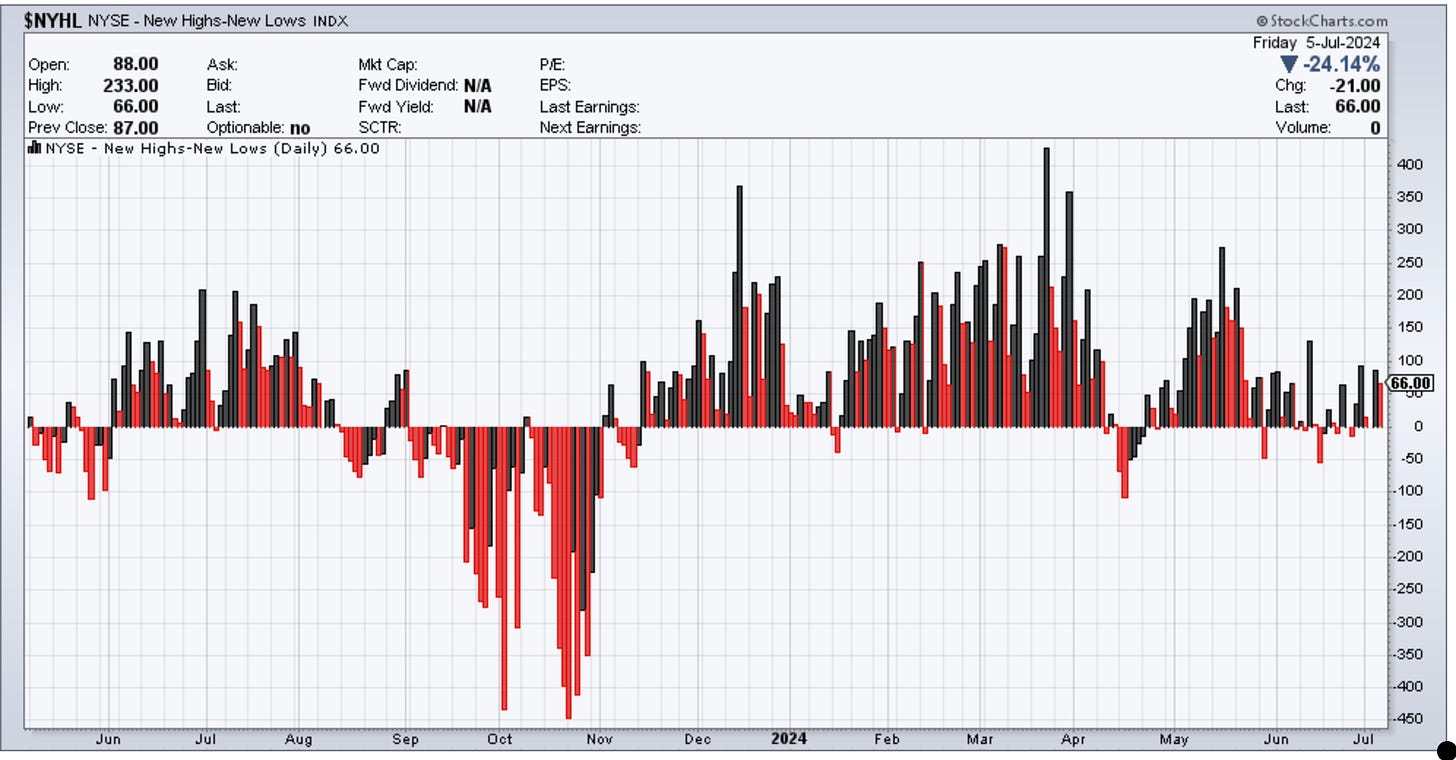
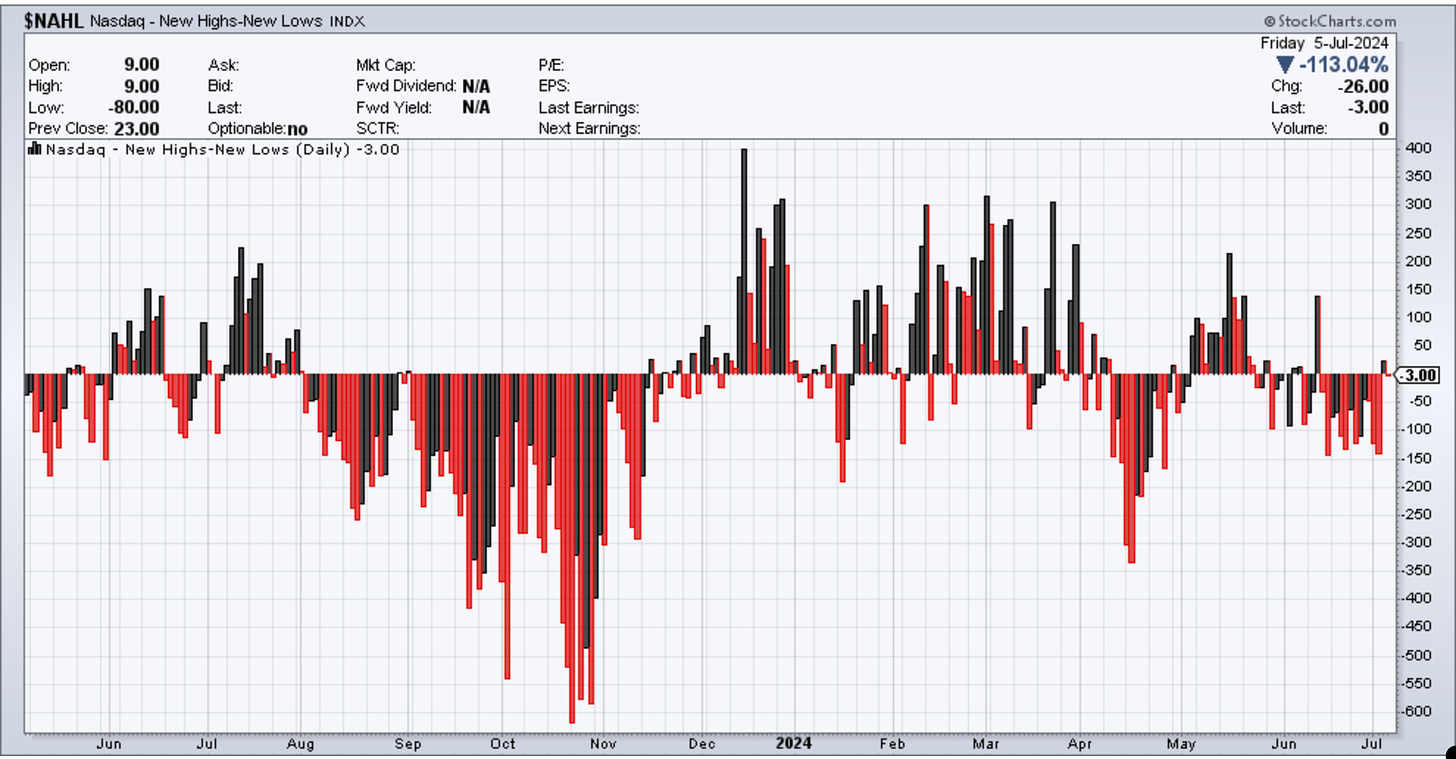
The next two charts shows the Net New Highs & Lows for the NYSE and Nasdaq. There is a paltry and declining amount of New Highs for the NYSE ($NYHL), while Nasdaq had Net New Lows ($NAHL) on Friday. This is definitely not a stock-pickers market and we previously warned our subscribers that it will be easier to make money in ETFs than in stocks. Also note that last Summer the number of Net New Highs were significantly higher for both $NYHL & $NAHL. If you made money in individual stocks last year, you’ll probably notice that it’s harder to do so this year.
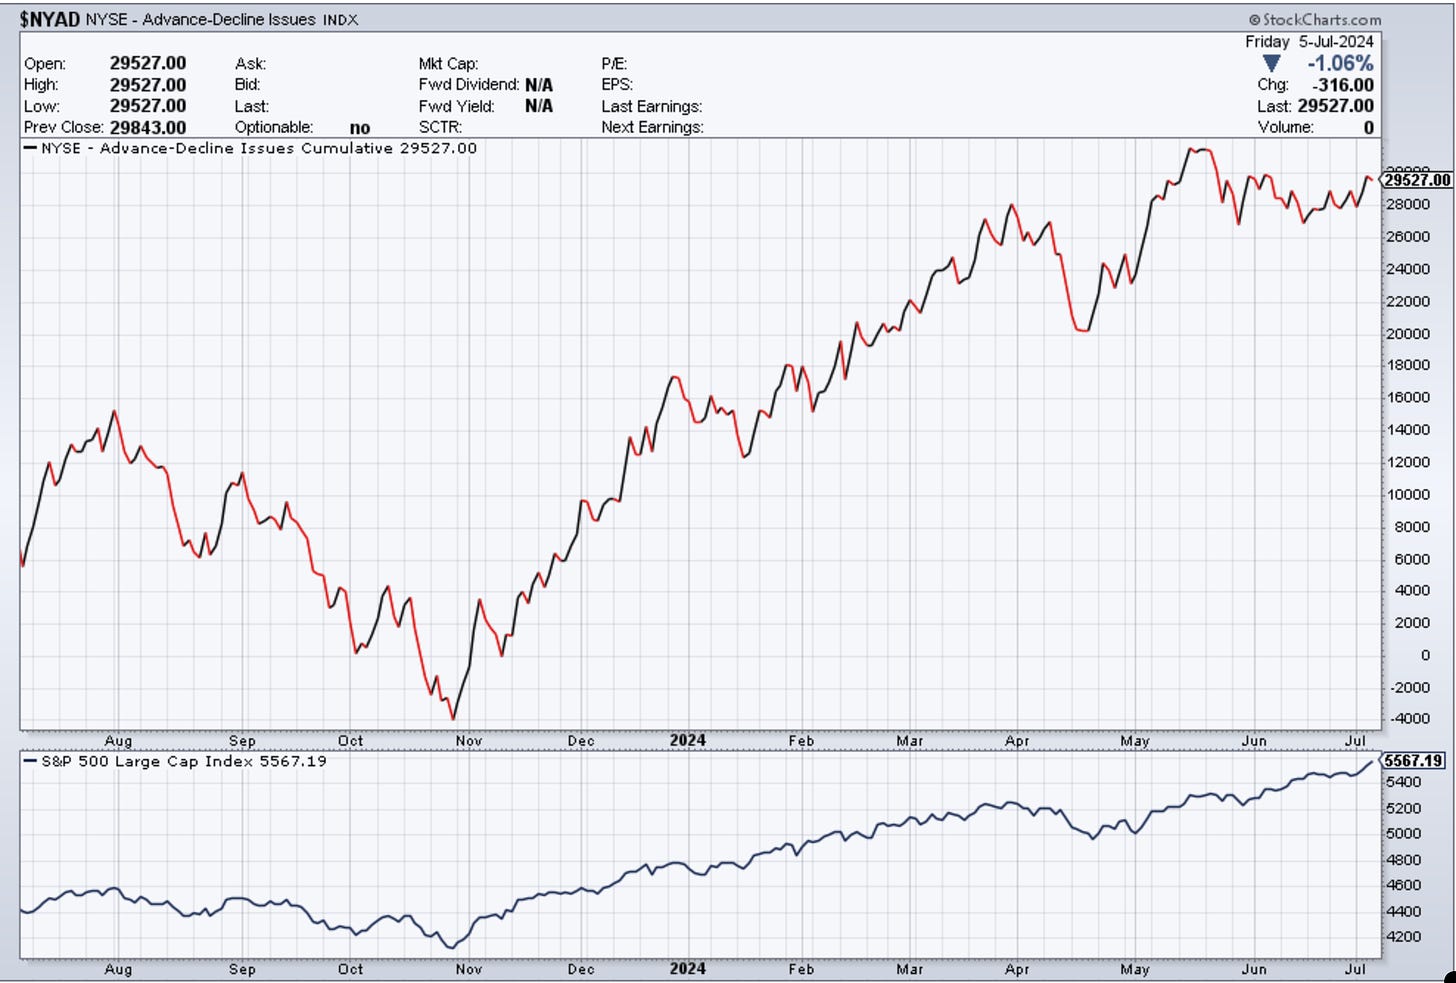
We also notice a negative breadth divergence where the SPY made a new high, but the NYSE Advance/Decline Line ($NYAD) was unable to make new highs. The breadth situation is definitely a sobering item to consider and implies an inherent weakness in the rally. On the flip side, Summer Rallies tend to be low breadth/low volume melt-ups at their best.
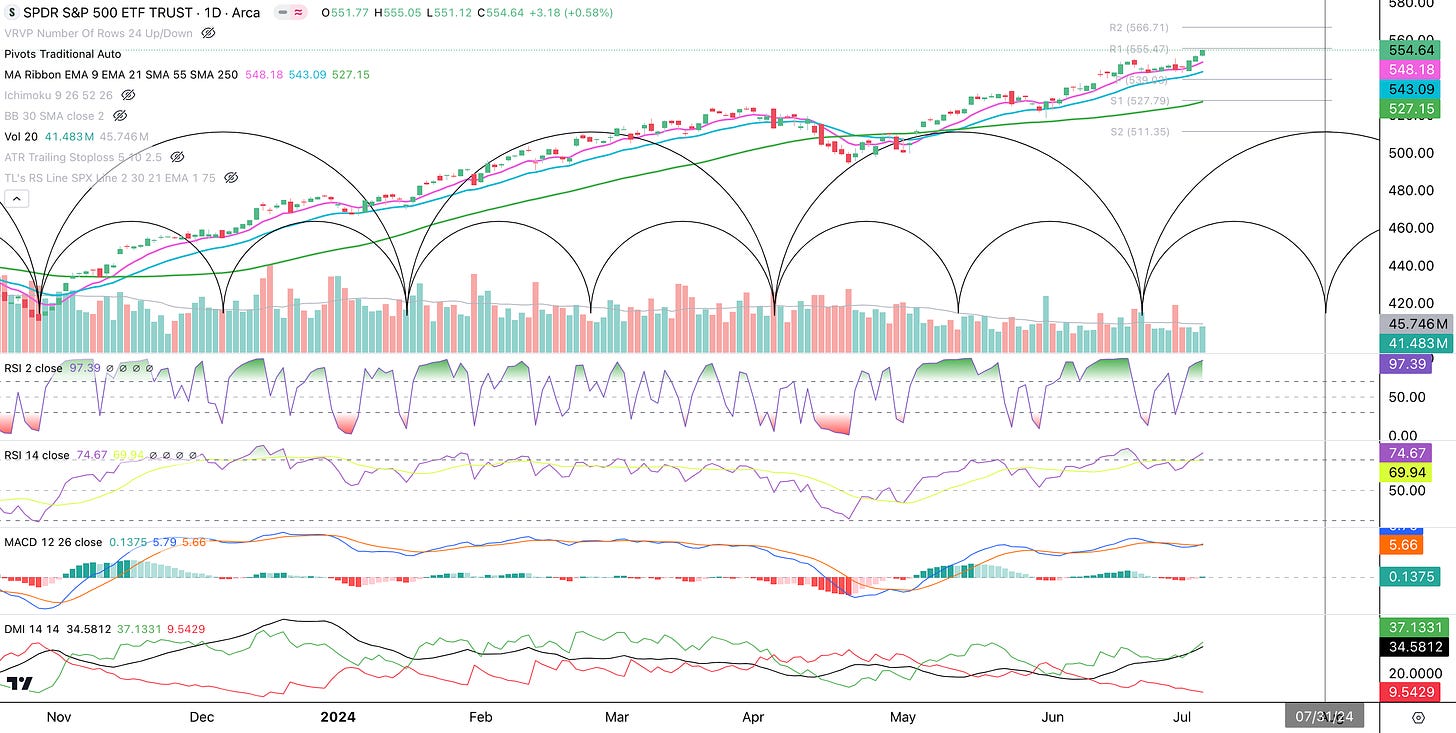
The SPY rose 1.91% last week as it bounced off the 9 EMA (pink). Both the 2-period and 14-period RSI point to the market being overbought. However with the MACD signaling a bullish crossover, overbought conditions could last for a while . With a reading of 34.58, the ADX indicator points to strength in this trend (above 25 is very strong). SPY could find resistance at the $555.47 R1 Pivot Point next week, but given the factors discussed in this analysis, the odds are in favor of the SPY reaching the $566.71 R2 Pivot Point. That is, unless cyclical or seasonal factors get in the way. The cycle brackets point to a half-cycle low around 7/31, so this implies the SPY should continue higher until about 7/21 and then make a low around 7/31.
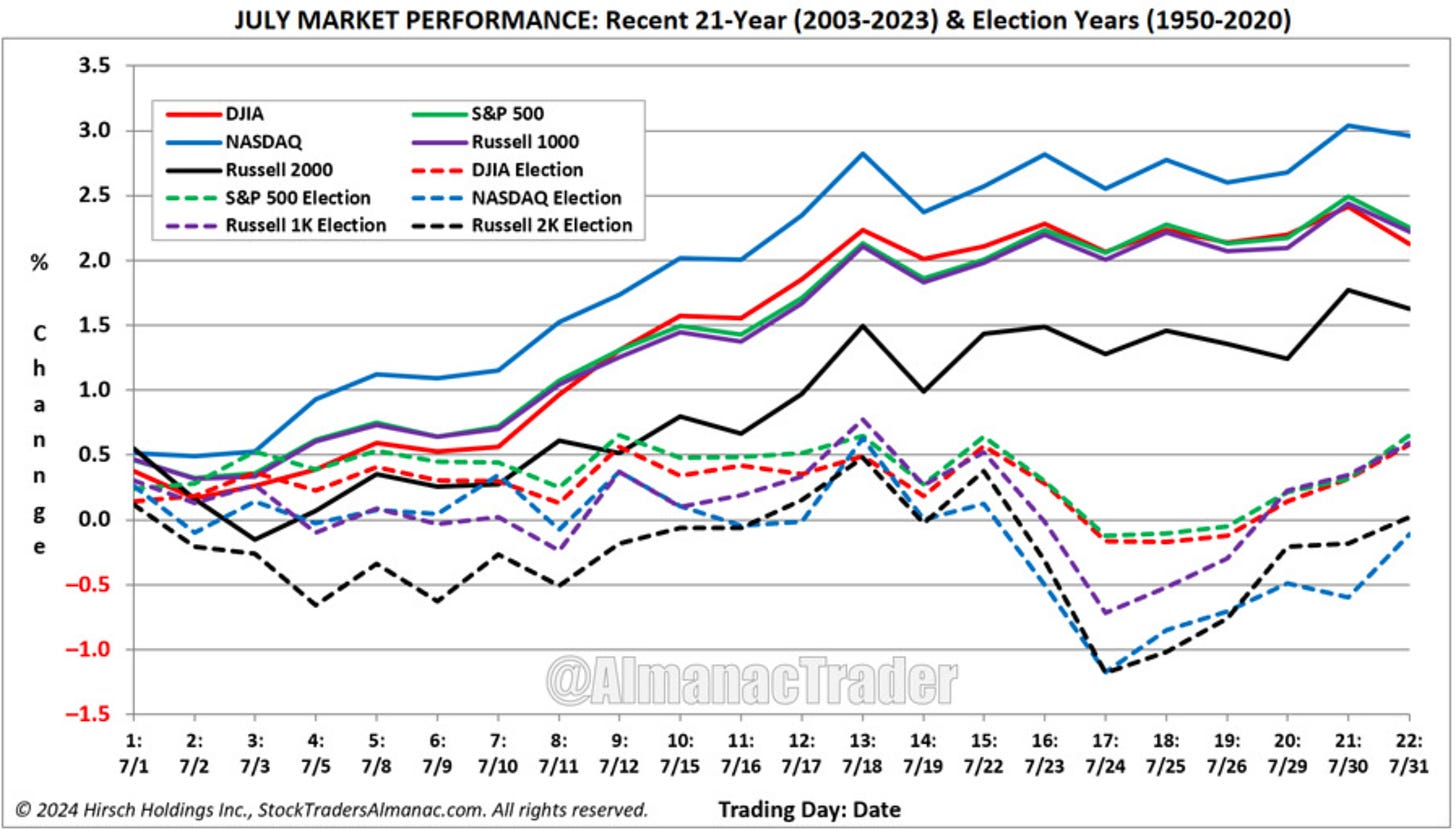
Seasonality also points to strength until a short-term topping pattern that could occur between 7/18 and 7/22, before some selling occurs.
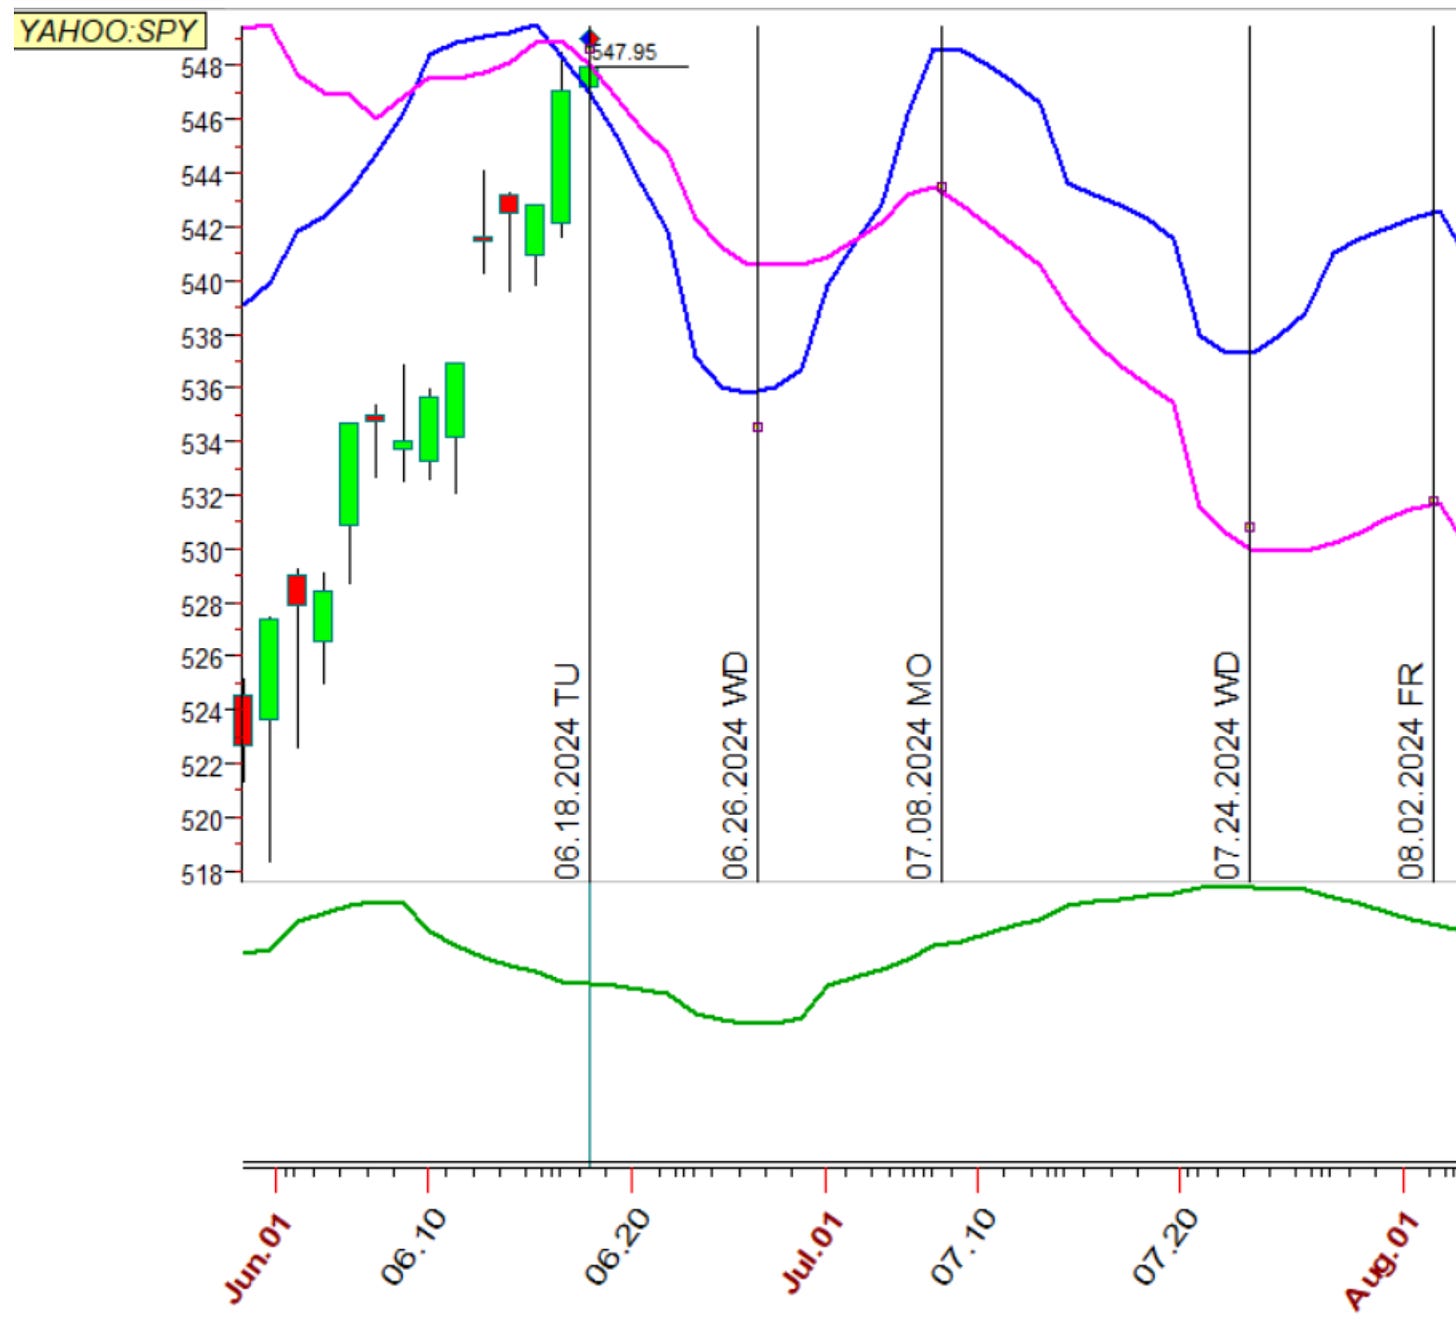
Our cycle chart for SPY points to a down-cycle occurring after a possible 7/8 top. Whereas it is possible that the market tops around 7/8 and falls apart, I believe that it is more likely for the SPY to continue higher above the 9 & 21 EMAs, but cracks to begin to appear in the different areas of the market. After 7/8 look for the market to slow down (grind up instead of jump) and for low-quality areas of the market to diverge before the SPY begins to break down.
In the Premium Section we’ll go over strategies to manage profitable positions. We’ll also analyze Affirm (AFRM) and Enphase (ENPH).
NOTE: Our Q3 2024 Cycle Forecasts is now available for sale on cyclesedge.com. We are covering multiple different Indexes, Sectors, Commodities, Cryptos and Leading Stocks using our proprietary Cycles Forecast. Founding Members have already been emailed ALL the Q3 2024 Cycles Forecast. This is one of the many benefits of being a Founding Member, so consider upgrading your membership. In case any of our Founding Members have not received the full Q3 2024 Cycles Forecast set, please reach out to us via email or Substack message. We also have another surprise in the works for our Founding Members, which will be released later in July.
Disclaimer - All materials, information, and ideas from Cycles Edge are for educational purposes only and should not be considered Financial Advice. This blog may document actions done by the owners/writers of this blog, thus it should be assumed that positions are likely taken. If this is an issue, please discontinue reading. Cycles Edge takes no responsibility for possible losses, as markets can be volatile and unpredictable, leading to constantly changing opinions or forecasts.


