Last week, the market broke down from a 7-week uptrend, as U.S. election seasonality demonstrated that it still has influence. This week, we’ll first cover Market Conditions, and then in the Premium Section we’ll conduct a Technical Analysis Deep Dive to assess how low the market might go.
Market Conditions: Weakness Continues
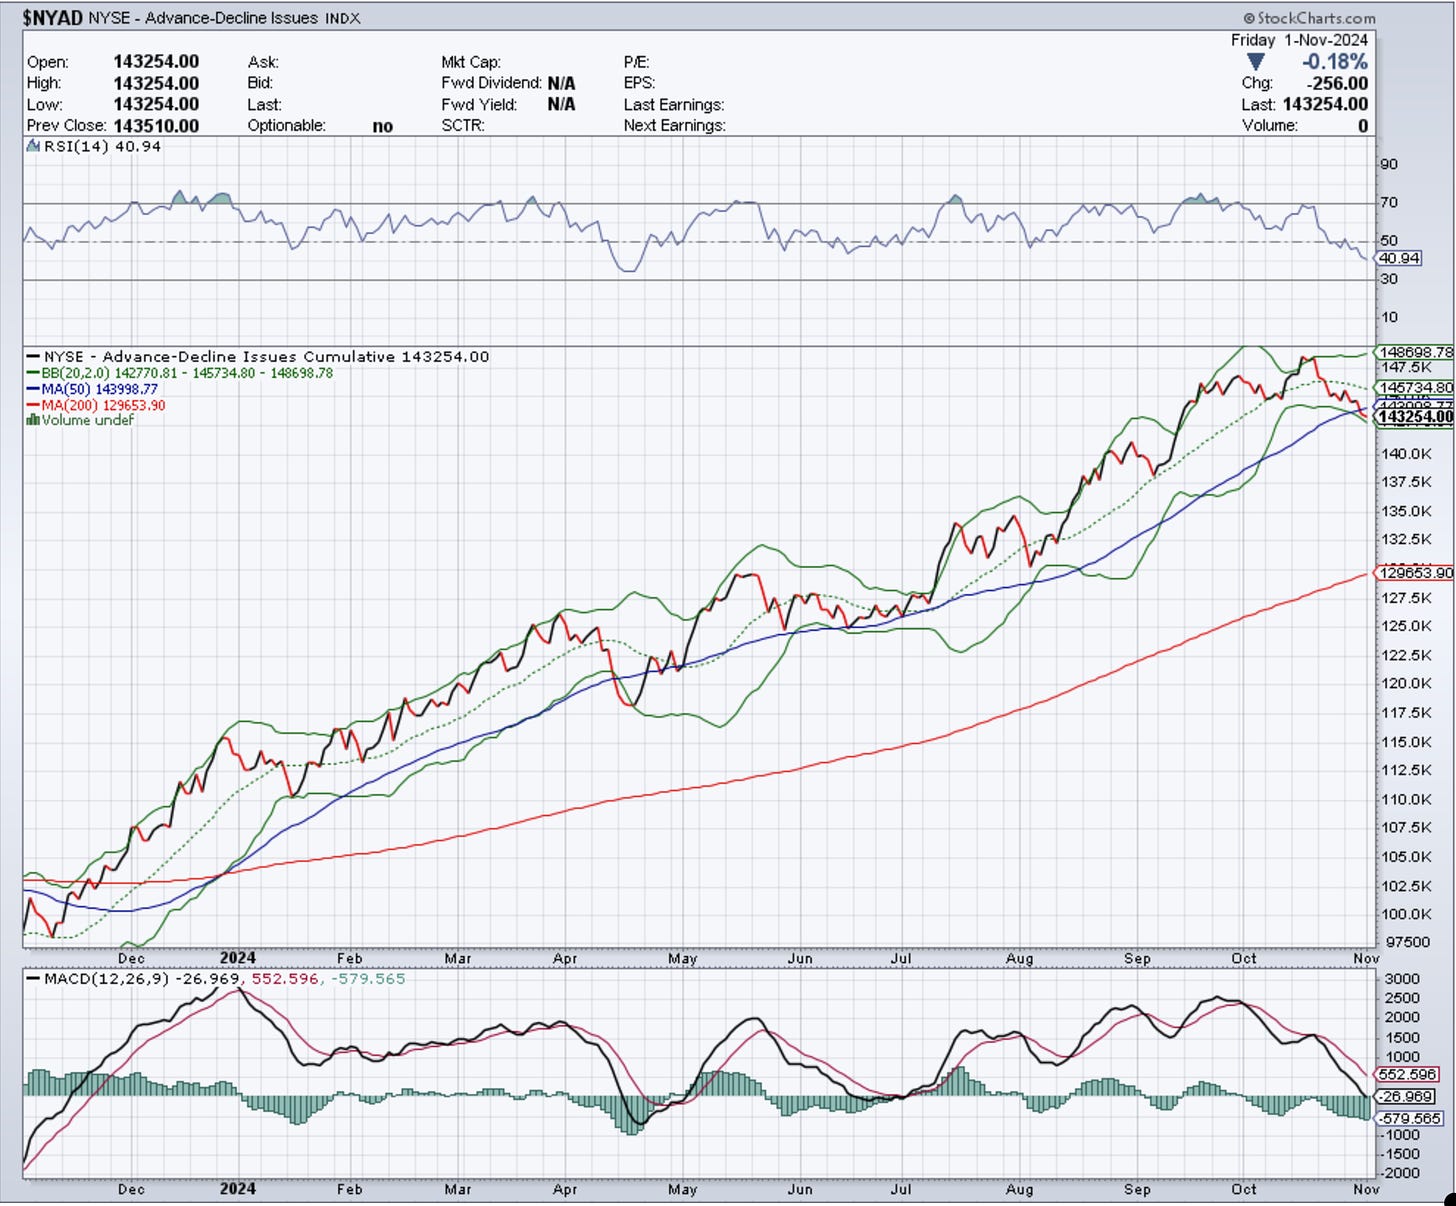
Breadth: Let’s start with breadth. The Advance/Decline Line continues to decline below the 50 SMA (blue) while pushing the Lower Bollinger Band (green) down. Meanwhile the RSI is declining and below 50 as the MACD breaks below 0. These indicators highlight the downside momentum that breadth is experiencing at the moment. With RSI not oversold (near 30 mark) the downtrend in breadth is expected to continue.
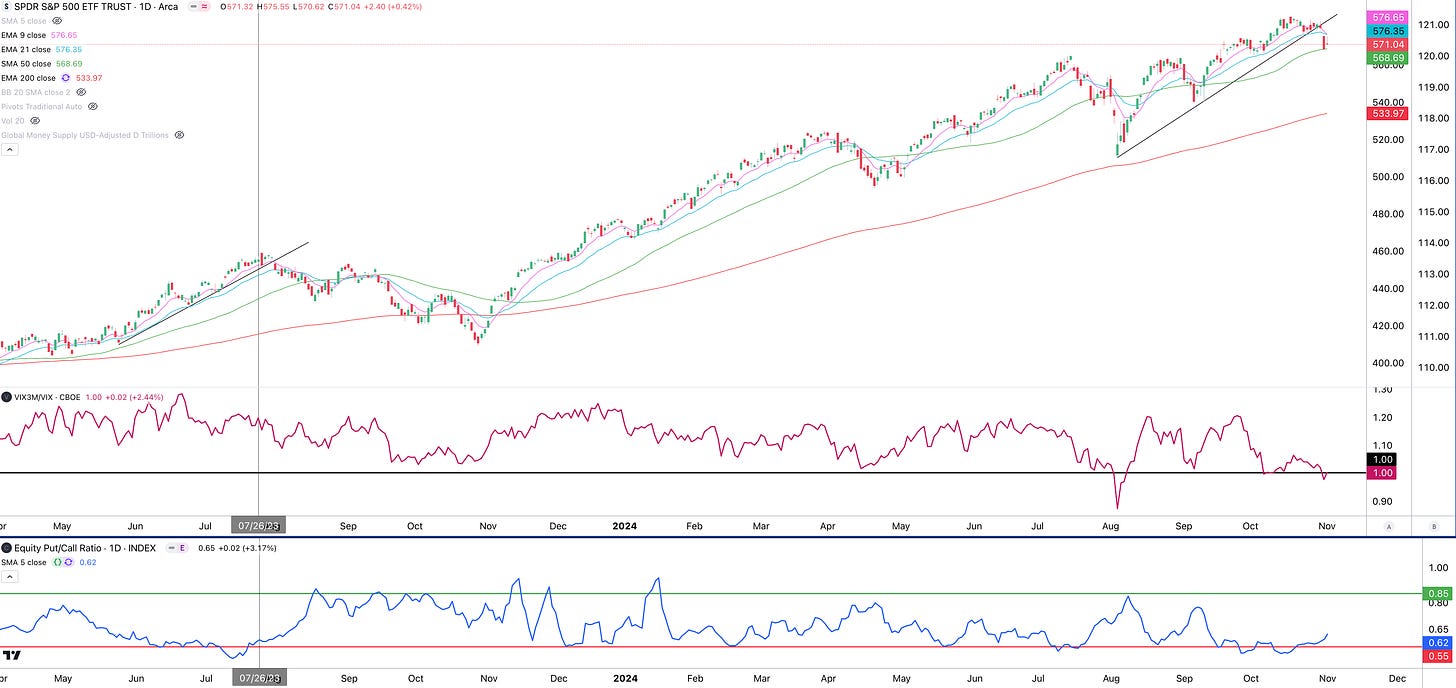
SPY Trend: Now let’s look at Volatility and Sentiment together with the S&P 500 (SPY) in the chart below. The SPY broke below the uptrend line and the 21 EMA (blue), telling us that it is in a downtrend now. The SPY found support at the 50 EMA (green), but is below a declining 9 EMA (pink). Price will have to break above the 9 EMA or below the 50 EMA soon. If the 50 EMA does not hold, the 200 EMA may be next at $534.
Volatility: The VIX Curve (or VXV/VIX) dipped below the 1 mark and is now at 1. If it increases and moves towards 1.20 that would signal that near term fear is dissipating and that would be bullish. If it continues lower, it may trigger a sell-everything selloff similar to August 5th, which is bearish.
Sentiment: The 5 SMA of the Equity Put/Call Ratio recently reached an overbought level (red horizontal line), indicating heavy call option buying as traders bet on a market rise. Market makers may aim to reverse this by pushing the market lower, prompting traders to sell call options at a loss and buy put options to short the market, allowing market makers to profit on both sides. The 7/26/23 timeframe (vertical line) may serve as a useful analog: if the Put/Call Ratio’s 5 SMA moves from overbought (red line) to oversold (green line) as the uptrend breaks, a similar correction could follow. The 10.93% pullback from 7/26/23 to 10/27/23 would correspond to a drop in the SPY to around $522.
With the Technology sector getting beat up, odds are on more downside next week.
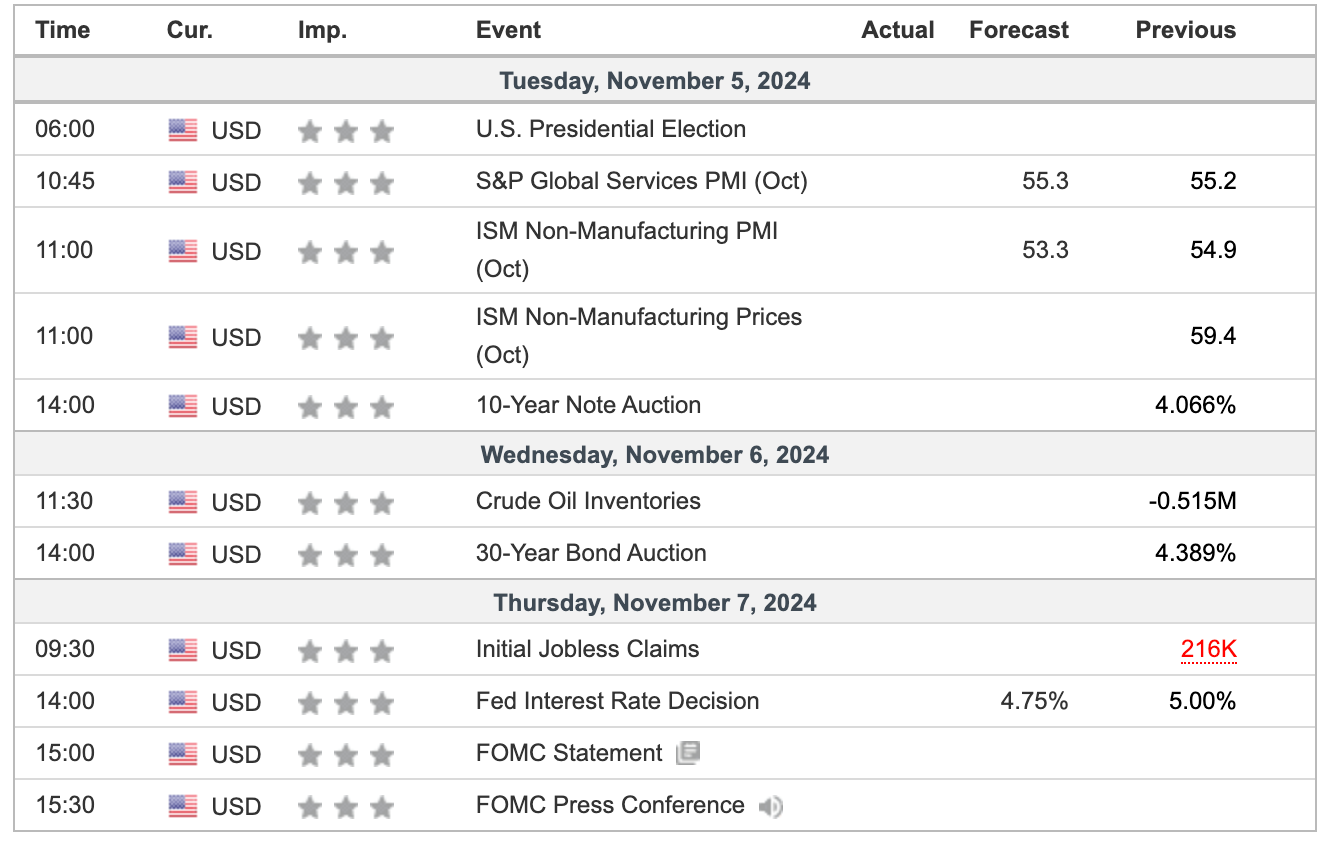
Next week the key event will be the US Election on Tuesday 11/5 and the FOMC Meeting and Rate Decision on Thursday 11/7. Look for volatility from Tuesday through Thursday.
With AMZN, AAPL, GOOGL, META, MSFT and AMD reporting earnings last week, eyes will shift back to macro issues and the election, while earnings will decline in importance.
New Offer: From now until November 3rd, we are offering the Complete 4Q2024 Cycle Forecast Set (worth $75) to all new Yearly subscribers for FREE. This set includes Cycle Forecasts for Indexes, Sectors, the Magnificent 7 stocks, Commodities, and Cryptocurrencies. The offer is also available to those upgrading from a monthly subscription onto the yearly subscription.
Disclaimer - All materials, information, and ideas from Cycles Edge are for educational purposes only and should not be considered Financial Advice. This blog may document actions done by the owners/writers of this blog, thus it should be assumed that positions are likely taken. If this is an issue, please discontinue reading. Cycles Edge takes no responsibility for possible losses, as markets can be volatile and unpredictable, leading to constantly changing opinions or forecasts.


