Why Invest with Cycles: Asymmetric Return to Risk
Go ahead…put in $100,000. When you win, you win 9%. But when you lose, you lose 18%. Wait…hold on…this sounds like a bad deal…right? Sounds like asymmetric risk to return where the risk is double the return. Those numbers are the return and risk figures for the typical diversified growth portfolio I mentioned in Investing for Newbies Part 1. This is NOT favorable for investors. An asymmetric return to risk (return > risk) is a much better deal, which is possible if investors invest during the time when investments go up and sit out or protect their capital when the market comes crashing down. Cycles Edge was created for the purpose of finding asymmetric returns to risk, and this is done by combining effective investing techniques with the element of timing. Let’s go over how to invest with cycles.
Dollar Cost Averaging with Cycles: Buy the Cycle Bottom
The easiest way to use cycles in an investing plan is to buy quality diversified ETFs, or mutual funds at cycle bottoms. The Dollar Cost-Averaging strategy assumes that the investor is investing a portion of their salary and has future cash flow to invest. Instead of buying on a randomly scheduled date (like the 15th of every month), one could hold cash and wait for cycle bottoms to add equity exposure. Although cycles are usually not perfect, they give the investor the chance to buy at cycle low points, which could improve capital appreciation over time. Imagine adding exposure to the S&P 500 at the date lines included in the chart below:
Looking at the chart below without the cycle forecast, you could see that if you added equity exposure at the cycle bottoms, you would have bought near the short-term lows. Cycles are usually never perfect, but they are quite valuable as an investing roadmap.
Investing During Down Cycles: Don’t get knocked out
This could be the difference between retiring early or working through your golden years. It could be the difference between living in abundance vs. being a slave to your job. Don’t lose -20%, -30% or -50% in market corrections or crashes!
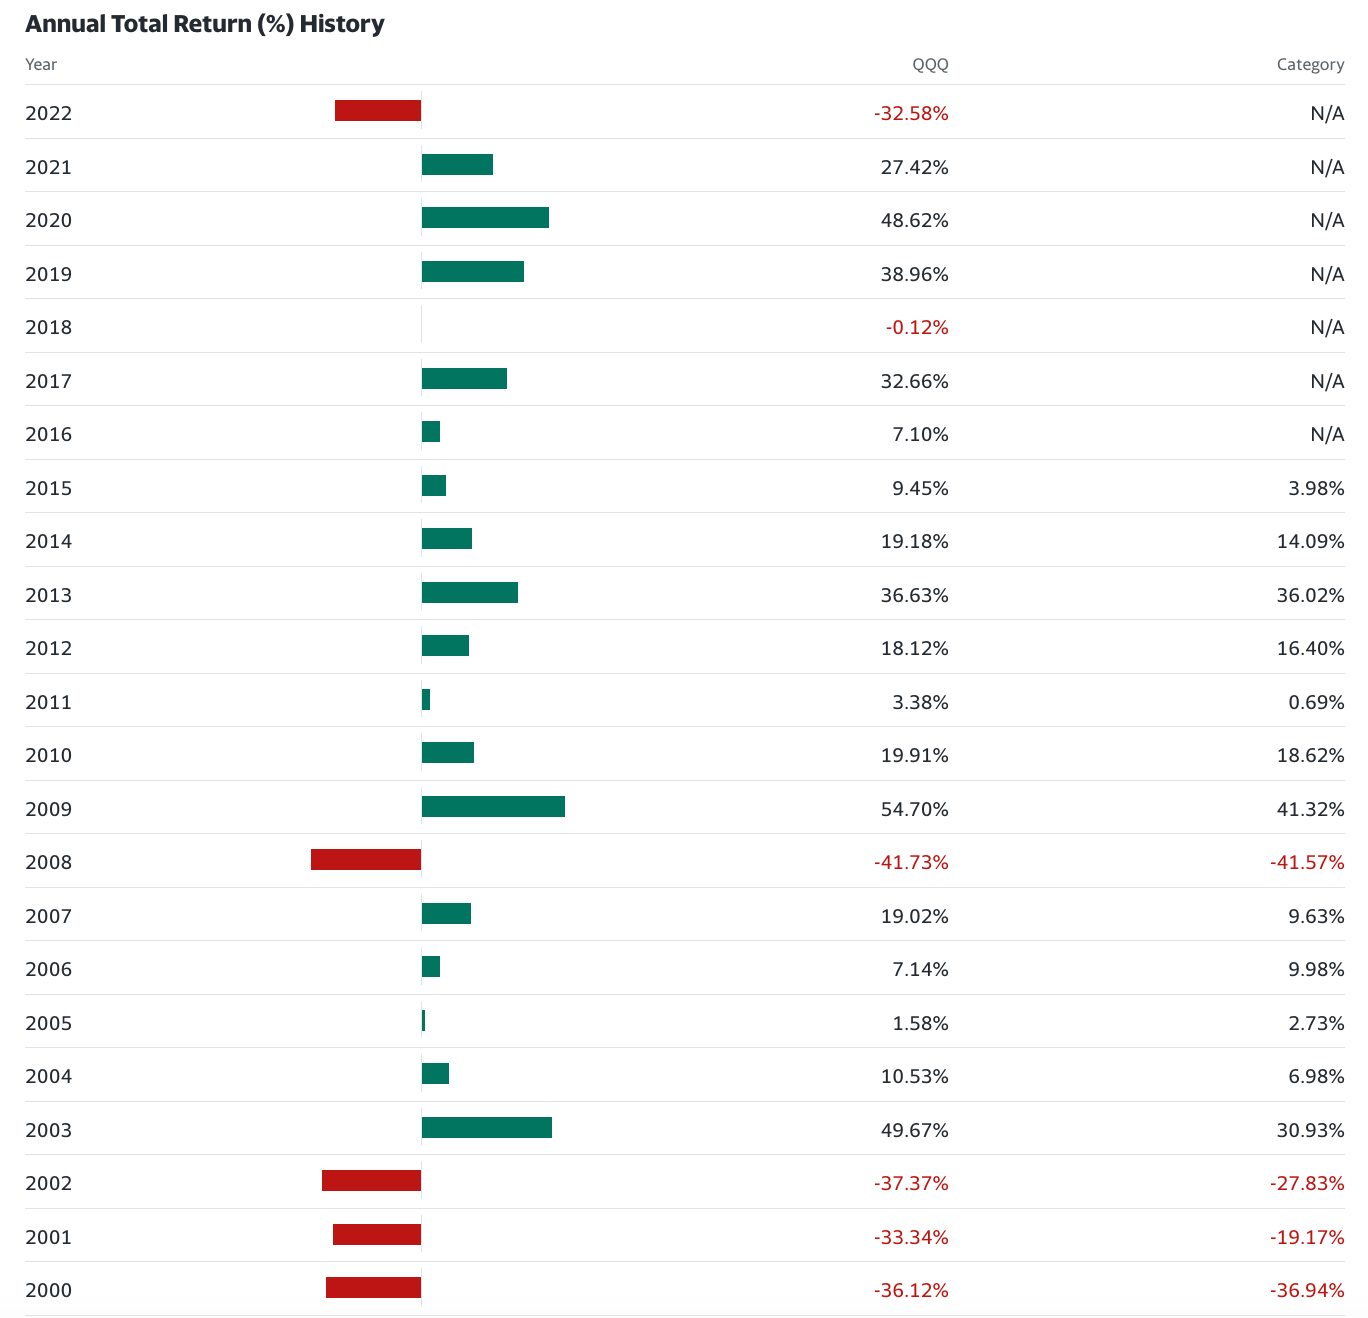
The Nasdaq 100 ETF is a stellar performer and with an annualized return of 17% over the past 10 years this ETF could change peoples’ lives.
Of course it doesn’t just go straight up. There are corrections and bear markets. Since 2000, QQQ has declined at least 30% six times, with the worst return occurring in 2008, down 42%. Additionally, it has pullbacks in the 8% to 20% frequently.
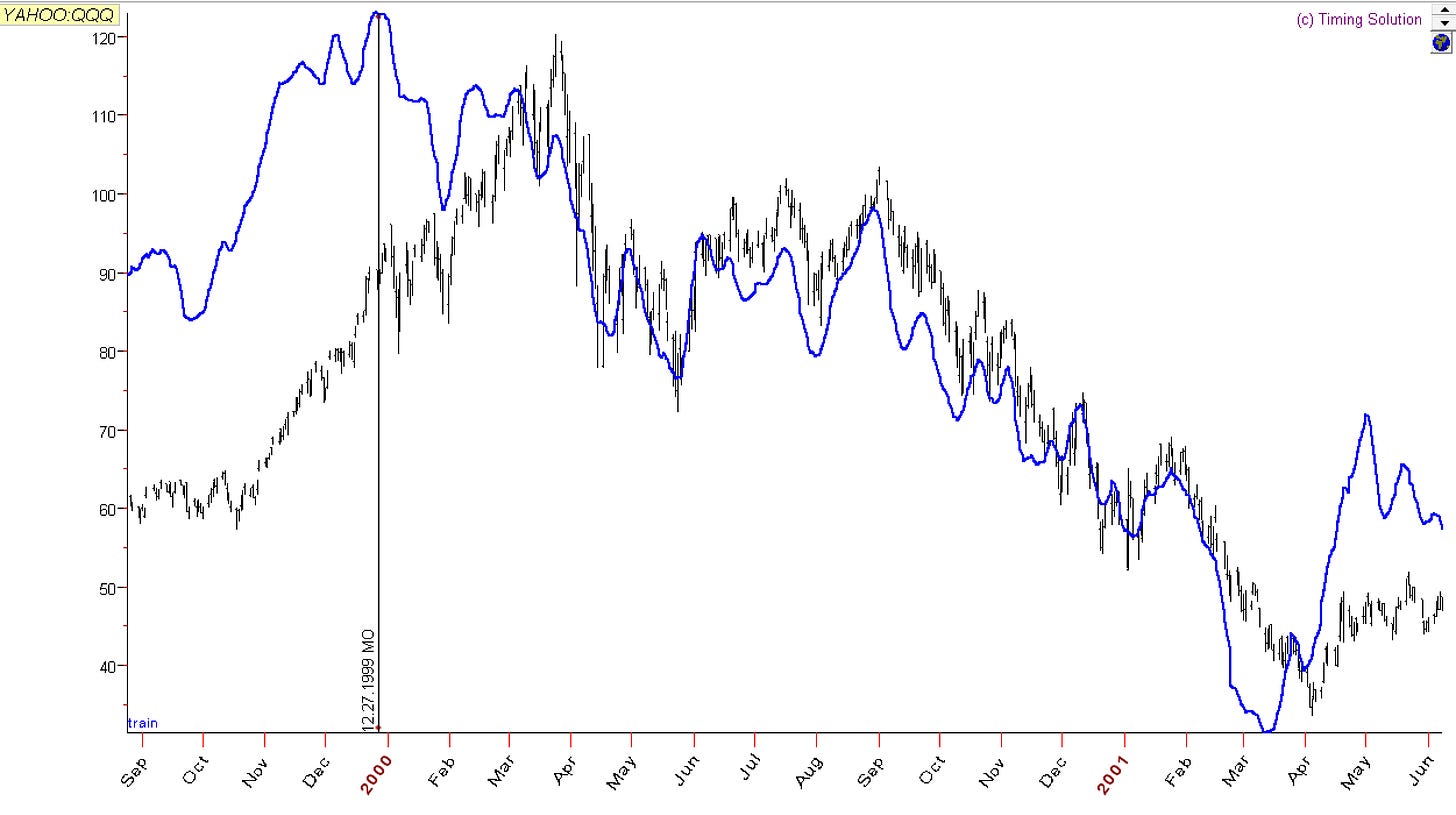
With cycles you could have a chance of dodging these knockout punches and reinvest at cheaper levels when the coast is clear. In the cycle chart below the Cycles Composite provided a warning on 12/27 that a down cycle is starting. It also forecasted the bear market of 2000 quite well. Knowing cycles, you could bob and weave around haymakers and left hooks.
In 2008, the Cycles Composite also proved to be a good tool to navigate the bear market of 2008.
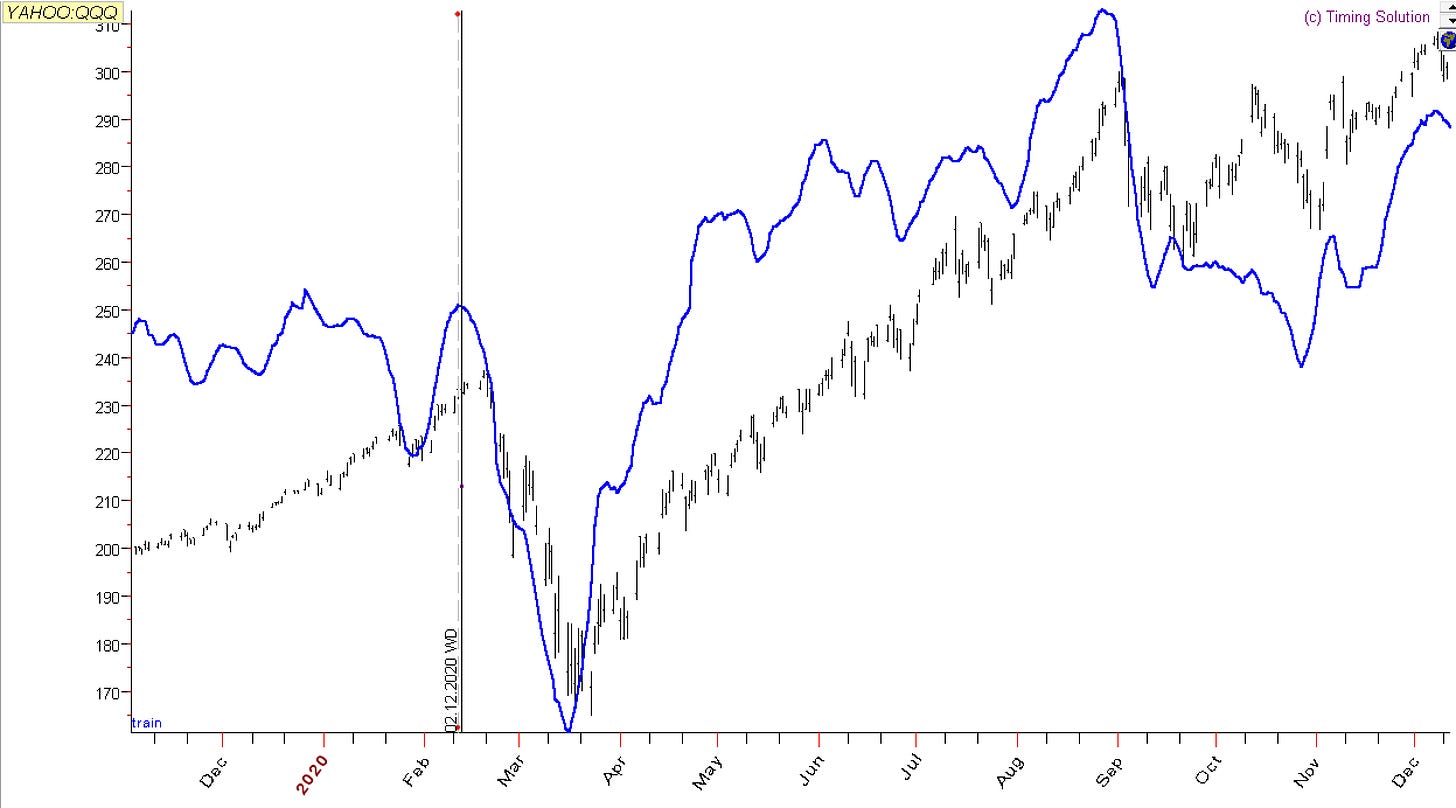
The Cycles Composite also provided an early warning on 2/12/2020 that a sharp drop was coming. We all know that the Covid crash happened days later and QQQ dropped 30%.
If you had knowledge of cycles, your nest egg or portfolio won’t have to sit though 10% to 40% drawdowns. With an early warning of an upcoming drop, one could take the following actions:
Raise cash (take profit) when the market tops or is in a downtrend, seeking to re-invest at lower prices in the future.
Re-allocate to lower volatility investments such as short-duration bonds or CDs, when risk assets are falling. This way you could still earn interest while suffering little to no drawdown.
401k Defense/Offense Technique - To protect your 401k, while taking advantage of declining prices, one could reallocate the 401k balance to safe assets (such as cash or short duration fixed income), while increasing their future purchase allocation to heavy equity when the markets are cheaper.
Buy Portfolio Puts - Buying puts on SPY or QQQ could hedge a buy-and-hold portfolio during times of volatility. This is a simple way to buy downside protection.
Sell Covered Calls - Investors could also sell covered calls on shares they own to generate income during times of volatility. This is seen as a “partial hedge”.
Collars - Collars are a combination of selling a call and using that money to subsidize the cost of buying a put. Collars use other people’s money to buy downside protection.
In all cases, knowing when the cycle will turn negative is key to take steps to protect capital. If you don’t get punched hard, you could stage a better offense.
Position Trade with Cycles and Technical Analysis: Buy the Cycle Bottom When the Trend is Confirmed
Position trading is a fancy term for active investing with a timeframe of weeks to months. One can use cycles (refer to the S&P 500 cycle chart in the previous section) combined with technical analysis and risk management to make money in the market. Here are four rules:
Know when to expect a cycle bottom
Buy when price breaks above the 20-day Simple Moving Average (blue line below)
Set an initial stop-loss order under the previous low
Trail the stop-loss order below the 20 SMA
The buy points are circled in the chart below. This strategy could have yielded great money-making opportunities. The 20-day SMA is significant because it represents the average price looking back for one month (about 20 trading days). As such, if price has the strength to break above the 20 SMA it is usually a significant event. Combining the cycle bottom with a price break above the 20 SMA, puts the odds in your favor. The initial stop-loss order is a way to limit your loss if the cycle is inaccurate. By trailing your stop-loss order below the 20 SMA you protect profits. Finally, when price hits the stop-loss below the 20-SMA a medium-term change of trend often occurs and you can sit in cash and wait out downtrends.
Swing Trade During a Swing Trader’s Market: Pick the Best Race Horses
In a previous educational piece, we discussed the importance of the Swing Trader’s Market. In short, it is an uptrending market with positive conditions where stock prices tend to increase and where most of the best traders make the bulk of their profits. A Swing Trader’s Market typically has:
Nasdaq 100 (QQQ) or Russell 2000 Growth (IWO) trending above the 20 simple moving average or 21 exponential moving average
MACD above 0
An increasing number of net new highs
You can see from the chart below the Nasdaq 100 started an uptrend around 5/5/23. The Russell 2000 Growth started its uptrend a bit later on 6/1/23.
These uptrends were forecasted by the Cycles Composite. In the cycle chart below for QQQ, the Cycles Composite (blue forecast) showed a bottom on 5/22/23, before a significant uptrend.
For IWO the Cycles Composite predicted a bottom on 5/15/23 before a strong uptrend. In this case, the actual rally for IWO came a bit late on 6/1, but when it came it was pretty strong.
To profit from this, one could swing trade using the QQQ or IWO. Alternatively, skilled traders could scan for large growth stocks when the QQQ entered an uptrend. One of the leaders, Nvidia ($NVDA), increased 49% during the positive market conditions.
Skilled traders could also scan for small-cap growth stocks when IWO entered an uptrend. One of the small-cap “baggers”, CVNA, increased 234% over the Summer 2023 Swing Trader’s Market.
Swing traders could use cycles to time periods that are favorable to high-beta stocks or risk-on portfolios.
The Cycles Edge Method: Cycles + Conditions = Confluence
Here at Cycles Edge, we look for confluence between Cycles, Seasonality, Technical Analysis, and Intermarket Analysis. When these factors line up, we know it’s a risk-on signal. When they don’t, we tend to be more cautious.
The chart below is the cycle chart for the S&P 500 (SPY) using the Cycles Composite (blue), Energy Cycle (pink), and Seasonal Cycle (green). We see that all cycles bottom around 5/24 and start uptrends. This was a sign to look at the technical chart and other conditions to see if the factors align.
Technical analysis factors aligned as the S&P 500 was above the 8 and 20 moving averages, RSI was trending up and MACD had a bullish crossover. Interest rates were flat, which is conducive to valuations re-inflating. Breadth was increasing as the McClellan Oscillator was above 0 and rising. Net new highs tended to lag and did come around in June. Finally the VIX (measure of volatility) fell. The combination of a new up-cycle, bullish technicals, stagnant interest rates, rising breadth and declining volatility provided the confluence needed that fueled the summer rally this year.
The end of the summer rally also had confluence:
The Composite Cycle had a top on 7/27, while the Seasonal Cycle was in decline
The technical picture weakened with price falling below the 8 and 20-day moving averages, and the RSI indicator showed negative divergence as the MACD had a bearish crossover
Interest rates began increasing
Breadth (McClellan Oscillator) and Net New Highs weakened and turned negative
Volatility (VIX) rose
As a result of these factors, we got a 3-month pullback.
Analyzing the confluence between Cycles and Conditions is our process and is the key to Making Money in the markets and keeping profits.
Conclusion:
Presented in this article were five different ways to invest with cycles. Dollar-cost averaging with Cycles is the most simplistic and our Cycles Edge Method is the most complex (That’s why we’re here!). The key to investing is to have a strategy that fits your personality and knowledge level. We do believe that in all cases, Cycles can be used to improve one’s investing plan. If done right, we also believe that Investing with Cycles is a path to achieving an asymmetric return to risk edge, while not taking huge portfolio drawdowns.
Disclaimer - All materials, information, and ideas from Cycles Edge are for educational purposes only and should not be considered Financial Advice. This blog may document actions done by the owners/writers of this blog, thus it should be assumed that positions are likely taken. If this is an issue, please discontinue reading. Cycles Edge takes no responsibility for possible losses, as markets can be volatile and unpredictable, leading to constantly changing opinions or forecasts.


