In our last crypto piece titled “Downside Mode Activated” (found here), we highlighted our arguments for why we believe the Bitcoin mid-cycle top to be in around the $49k. But Bitcoin had tricks up its sleeves. It decided to break right through the previous high and the resistance zone highlighted below to reach almost $53k.
With greed running high and others being quick to say “This time is different”, we’re not so sure yet. All the past Bitcoin cycles have seen the 0.618 region be a sharp pullback zone. Bitcoin is currently at its 0.702 retracement, with the 0.786 retracement sitting around $57.5k. So what might be going on here? Just straight parabolic price action? Not where our bet lies yet (We promise that in due time when the data supports it, we’ll be the biggest Bitcoin bulls in town!)
The Topping Pattern
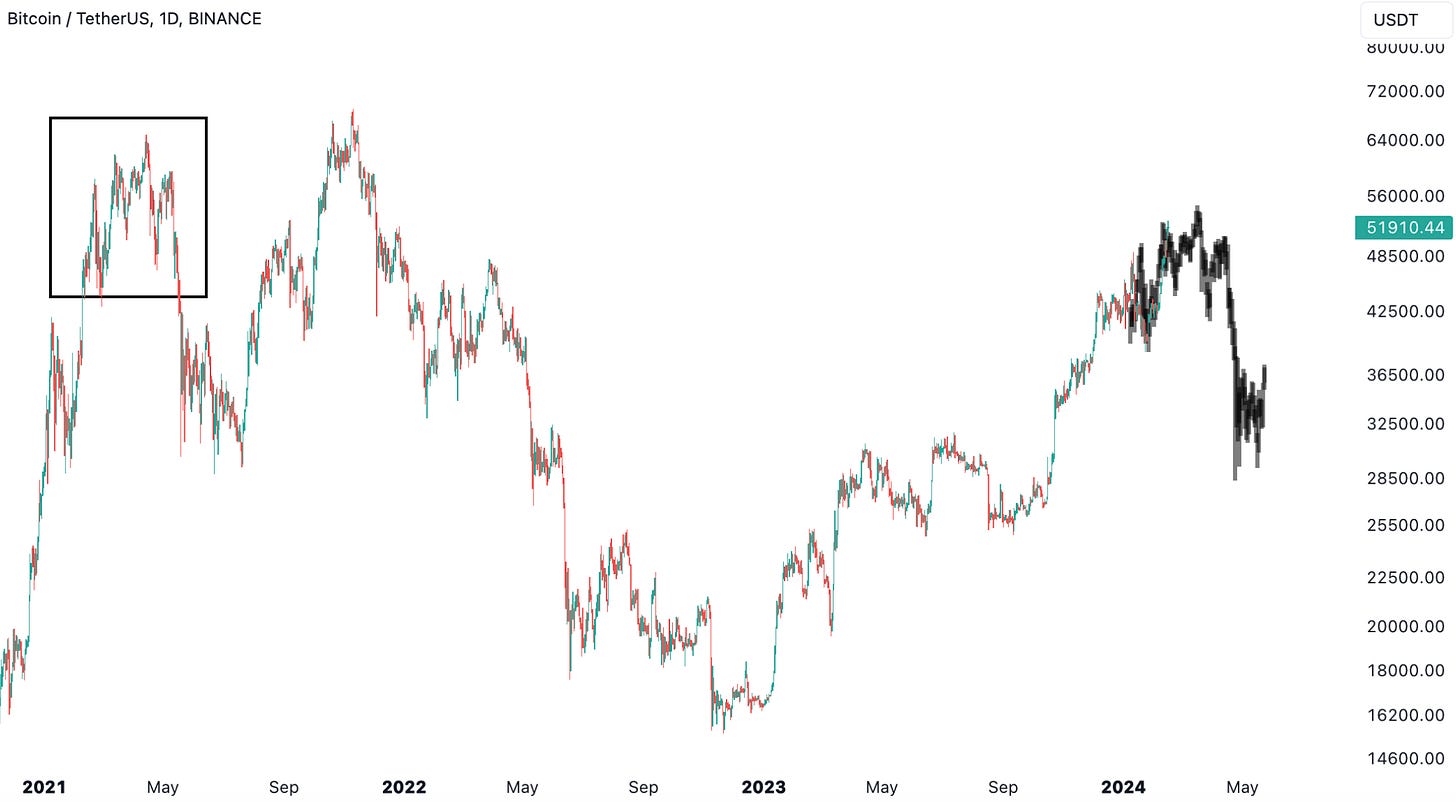
Bitcoin might be putting in a local topping pattern that looks like the first 2021 topping pattern. If this is true, then there might be a pullback followed by one more spike higher (perhaps to the 0.786 Fibonacci level) after which the deeper bull market correction begins. Even if Bitcoin were to follow the outlined fractal, it would lead us to the downside levels we had initially outlined in the article that can be found here. This would also catch most off-guard at this point, especially those who had been eyeing the 0.618 as the final level before full parabolic take-off mode gets activated.
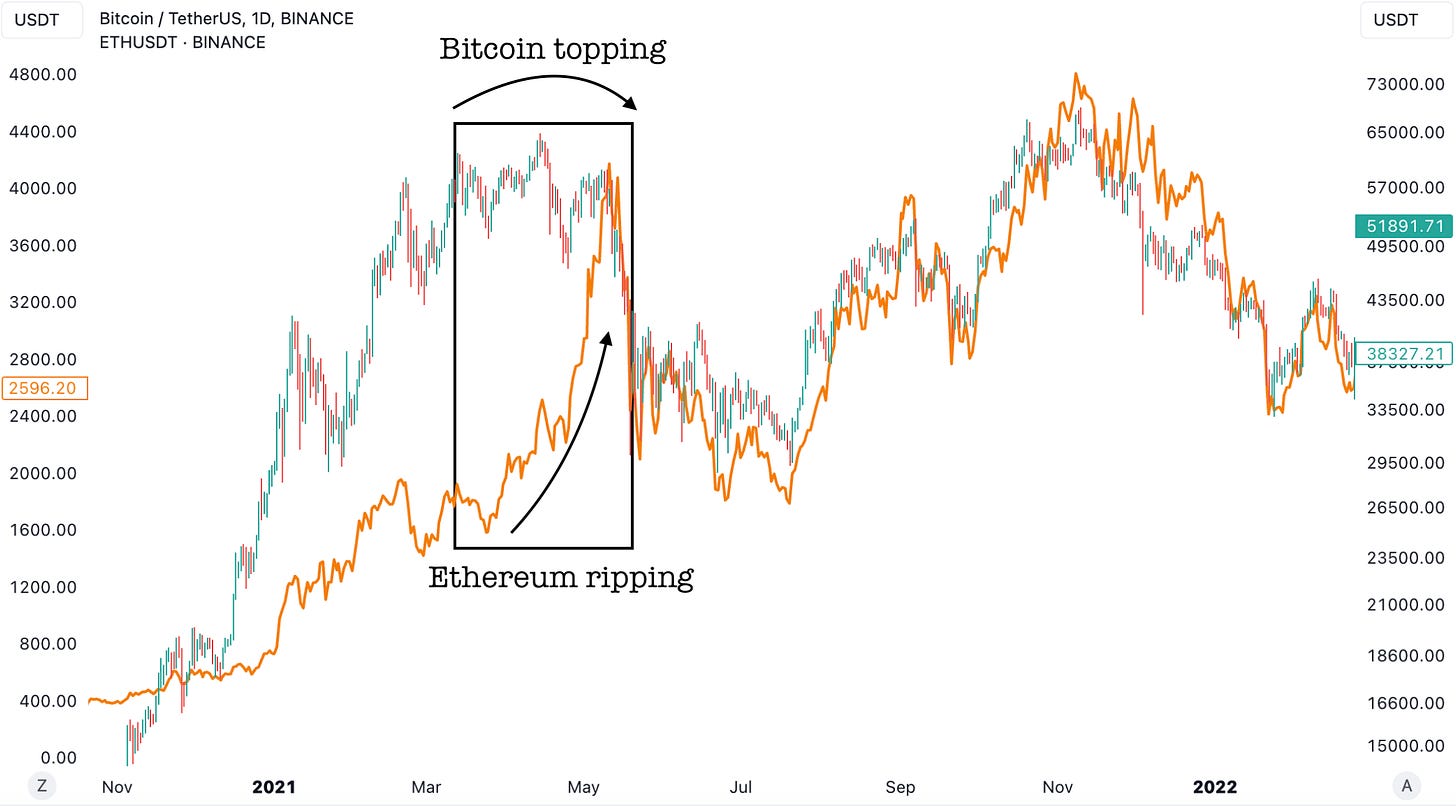
But what’s of utmost importance is what happens between now and if that correction comes. While Bitcoin might be putting in a potential topping pattern, this might be the signal for money rotation into Ethereum and other altcoins. Even back in early 2021, it was around this moment that ETH and altcoins took the lead while Bitcoin was forming a local top. We believe something similar is at play right now.
Ethereum Get-Set-Go February Time?
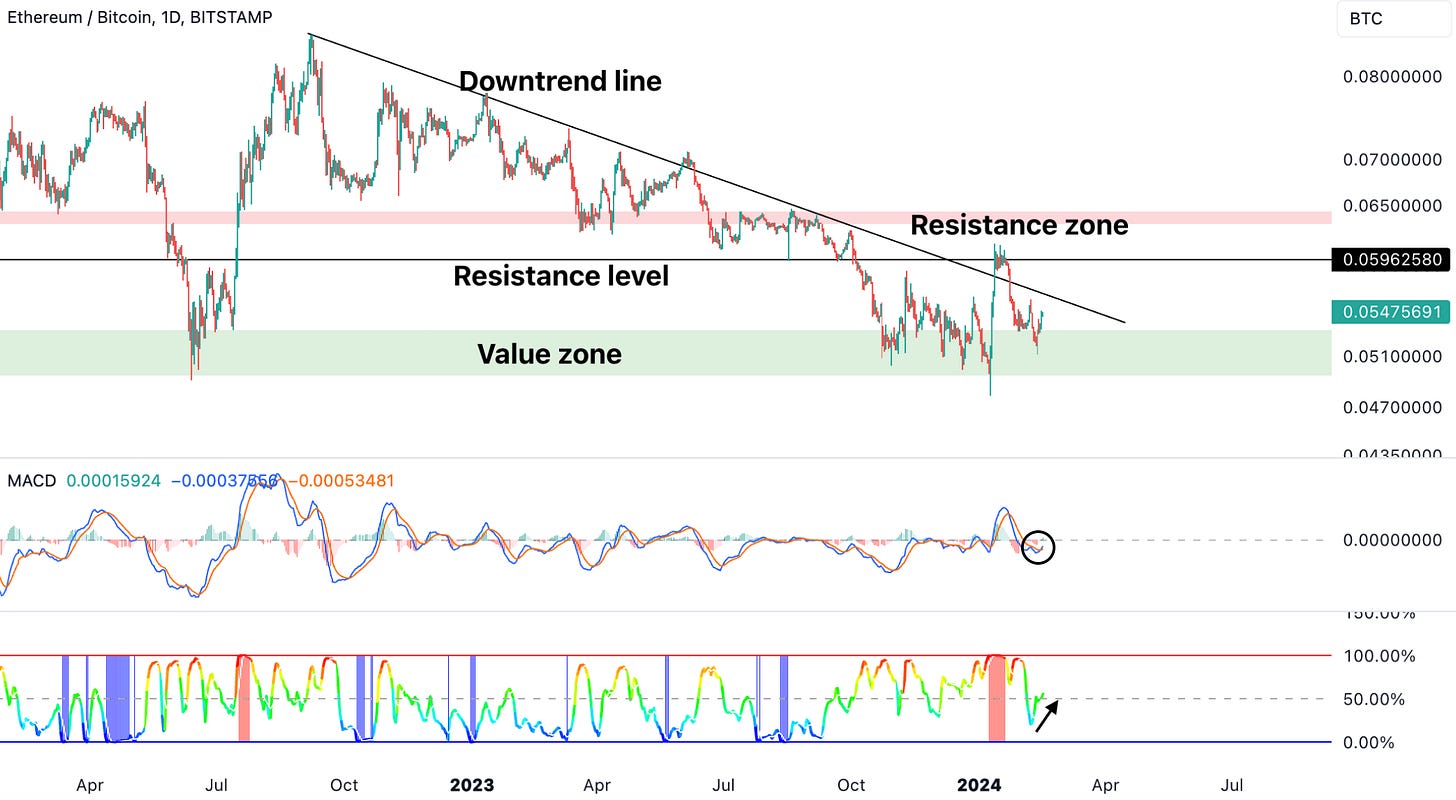
Ethereum has been the lagger throughout Bitcoin’s runup, as seen by ETH/BTC ratio, but now it finally might be ETH’s turn to shine for a short period of time. The ETH/BTC ratio is showing signs of momentum. Our “Secret Sauce” volatility indicator (bottom panel) is showing that volatility is about to return to this ratio and with the MACD flipping bullish, it’s likely that this volatility will be to the upside. If so, then we can expect the ETH/BTC ratio to finally reach at least the resistance zone, which is around a 15% outperformance of ETH relative to BTC.
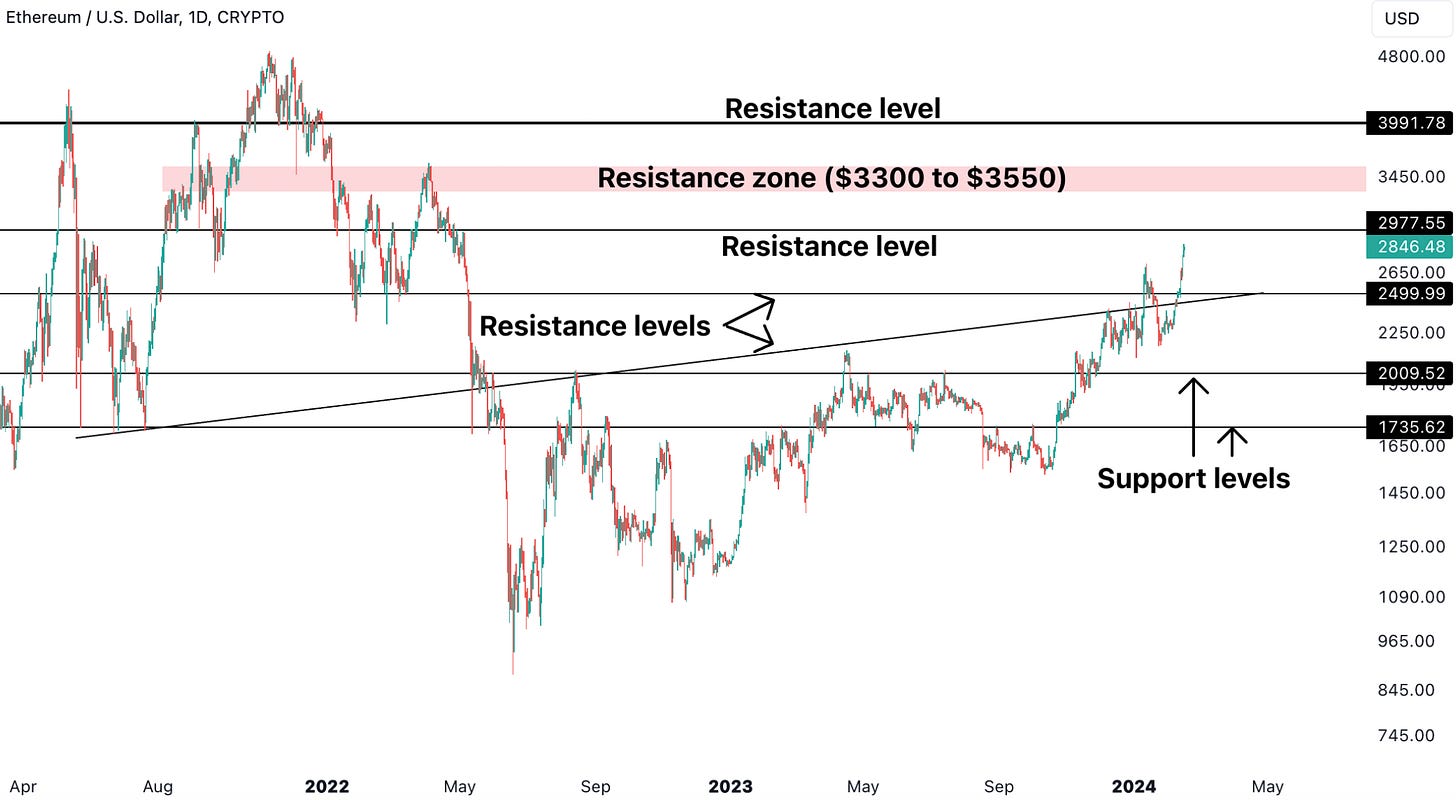
In the event that the above outlined argument is true, that should get Ethereum to its resistance zone between $3300 to $3550 and give us a mini altseason in the process.
Interestingly, even Ethereum’s Cycles Forecast shows upside until the end of the month as shown below. On the other hand, Bitcoin’s forecast (not shown) is choppier, which would make sense if the above topping pattern fractal outlined was in the works.
We’ll be closely watching the price action and if the data we’re looking at tells us to flip our bias on Bitcoin, we will do so without any hesitation. At the end of the day what’s important in this market is to “Make Money”. However, the data is still sending signs of caution for a meaningful pullback around the corner and then the real runup, just like it happened in the past Bitcoin cycles. For our paid subscribers, we’re going to have an update on Marathon Digital ($MARA), CleanSpark ($CLSK) and Coinbase ($COIN).


