Is the market at equilibrium or resistance?
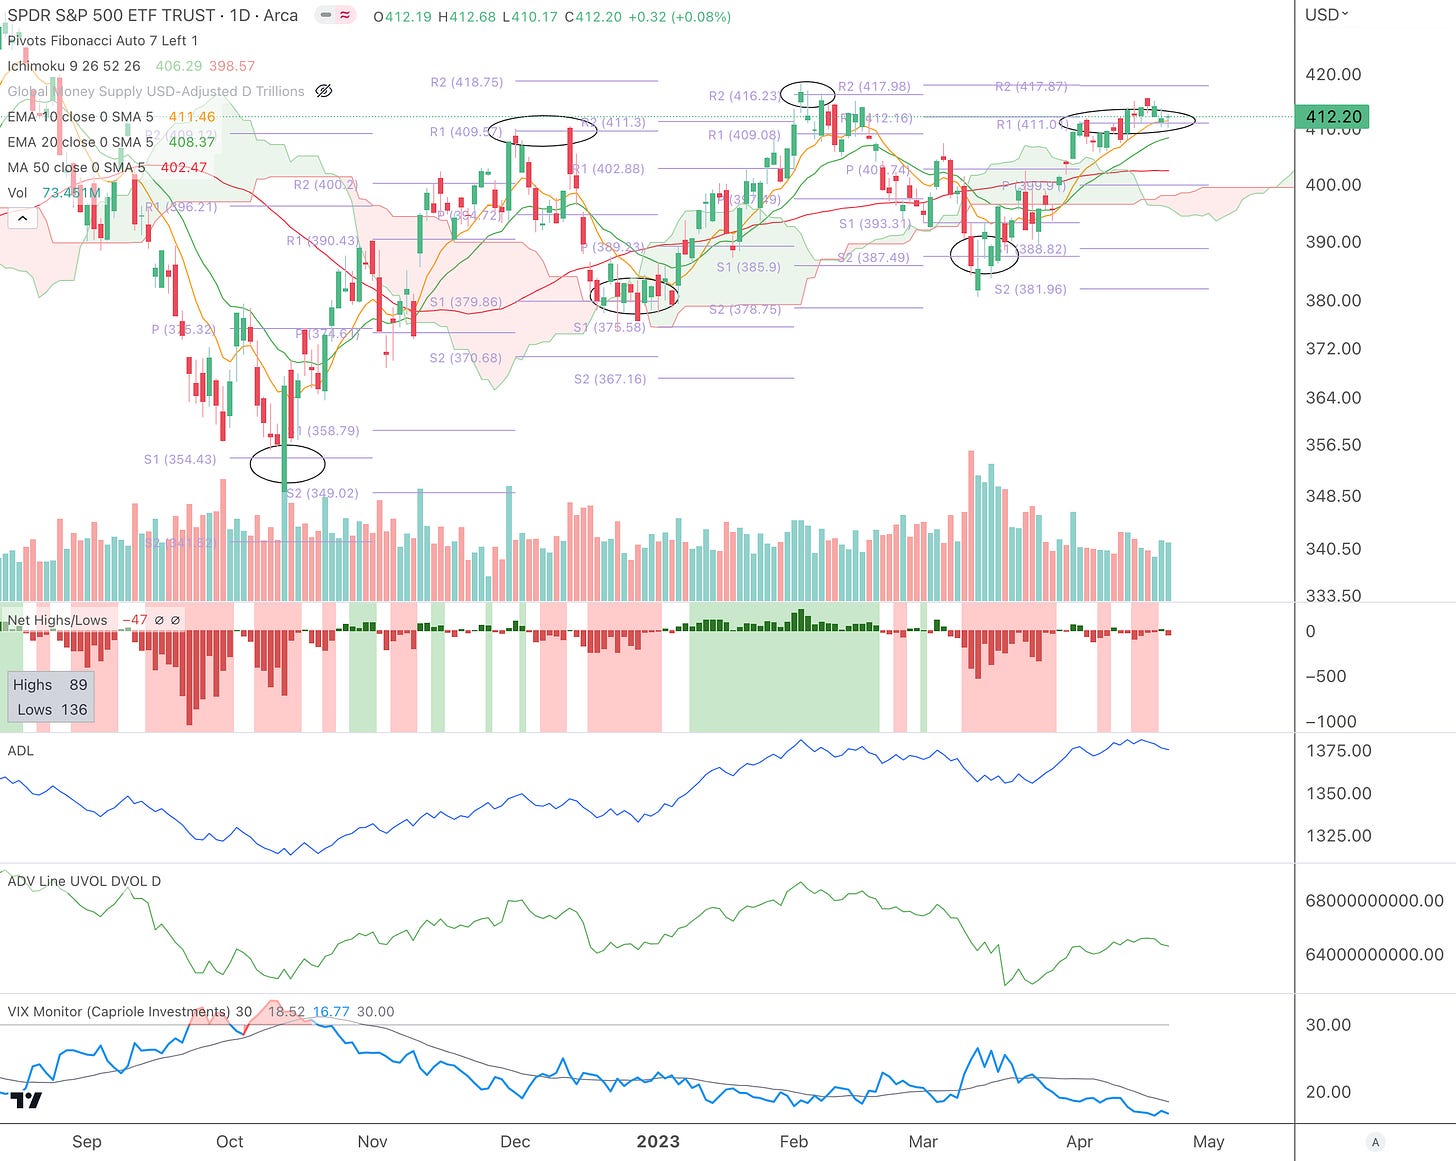
Market Analysis: The S&P 500 (SPY) has spent the last 13 trading days (since April 3rd) straddling the R1 Resistance Pivot Point around $411. This makes us wonder if:
1) the market is digesting these levels, finding equilibrium here, and setting up for a new move higher, or
2) the market hit resistance and the smart money is selling out here before the next leg down.
The chart of SPY below shows us that price is still above the 10 EMA, but having a hard time getting past the R1 Pivot Point at 411. There are net new lows, showing that stocks are not very bullish. The Advance-Decline Breath Line (ADL) is at a relative high and is beginning to point down. The Advance-Decline Volume Line is starting to roll over. The VIX is still trending down, which is positive. Internals show weakness and if the VIX begins to trend higher, that would be quite bearish.
The most important thing is that the S&P 500 has traded quite technically over the past few months, moving from Support Pivot Point to Resistance Pivot Point and back again. In October, the low reversed on the S1 Pivot Point. That created an uptrend until it ran into the December R1 Pivot Point. At that point, a selloff occurred to the December S1 Pivot Point. SPY chopped around in a sideways consolidation for 11 trading days and started an uptrend to the February R2 Pivot Point. From there SPY dropped to the March S2 Pivot Point. Finally, we made it back to the April R1 Pivot Point. I believe that, although we may touch the R2 Pivot Point at $418, the seasonality will turn negative as the Sell in May tendency may occur. This could bring us back down to a May Support Pivot Point between $405 to $407. The Seasonal Cycle below shows a downward pressure starting May 5th.
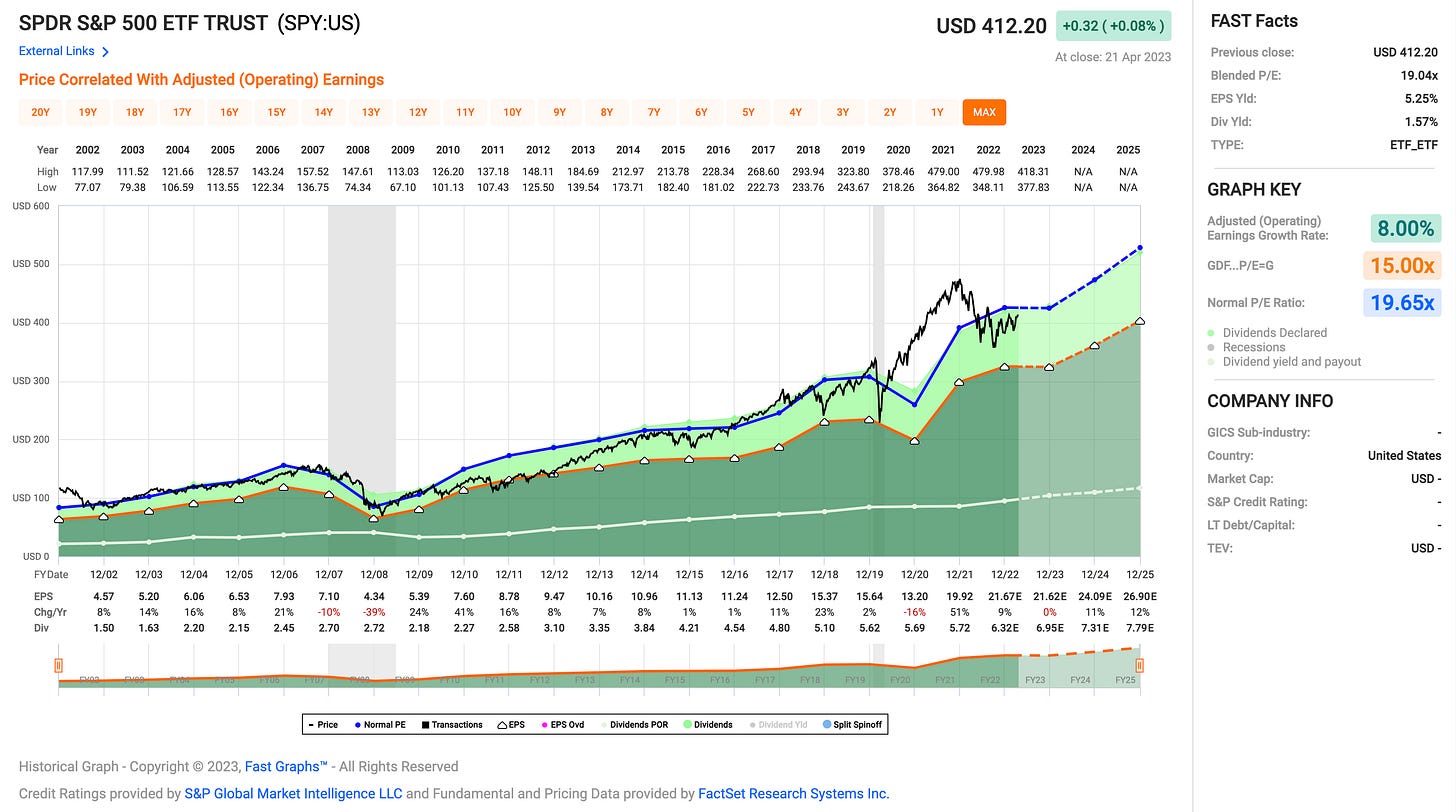
In terms of valuation, SPY is at a blended P/E ratio of 19.04x, which is not cheap. Resistance could lie at the 19.65x P/E level.
Sector Analysis: Last week Consumer Defensives and Real Estate were the leaders as Communication Services, Energy and Basic Materials were the laggards. This configuration indicates that money is flowing to defensive sectors and this is not bullish.
Disclaimer: This is for educational purposes only and is not official financial advice. For financial advice, please consult a Financial Advisor. I actively trade all tickers mentioned, so assume that I do have a position.


