IWM, NVDA, FTNT, TTD & ACN - Setups
Although it does not come every year, this year the market is setting up for a Thanksgiving rally!
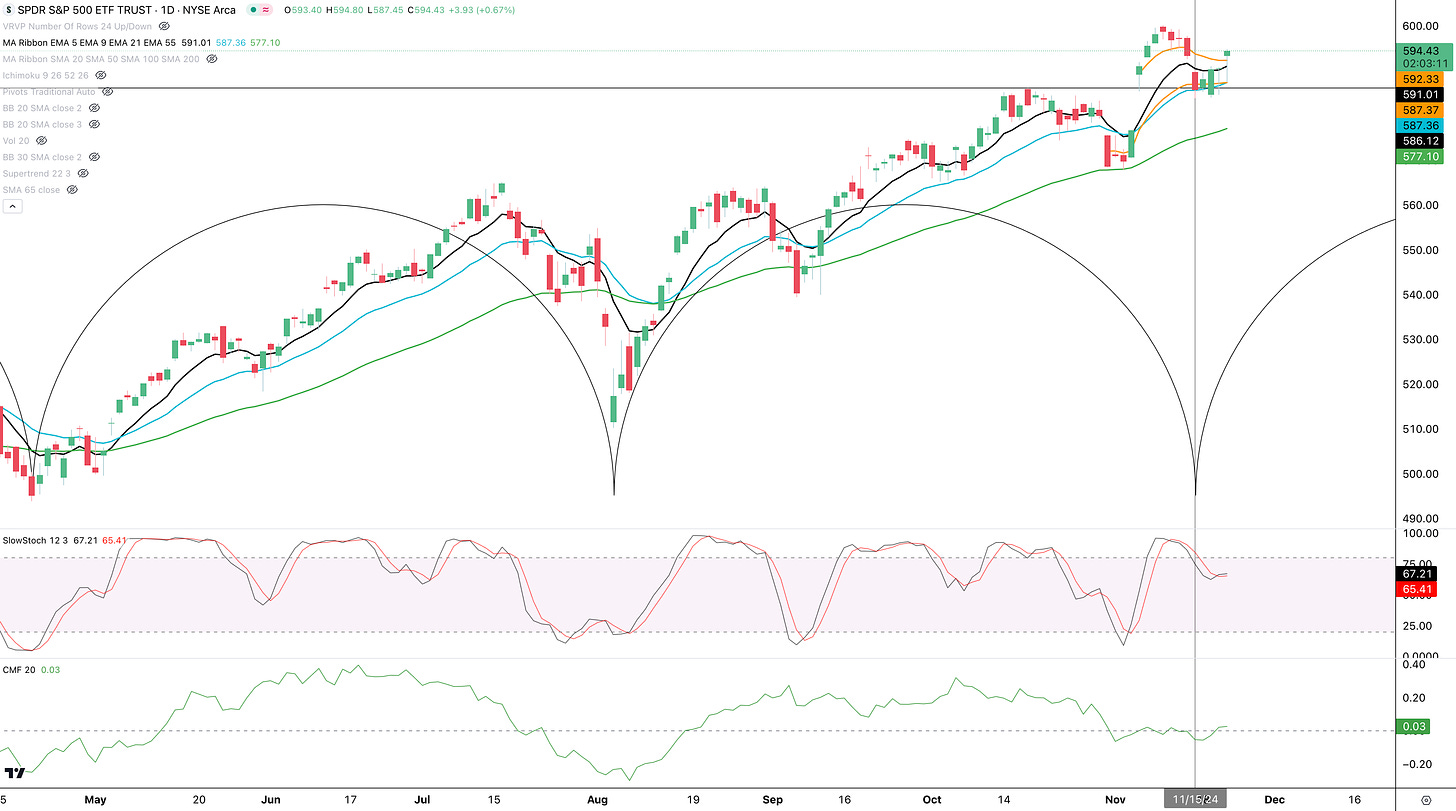
The S&P 500 (SPY) is now back in an uptrend above the 9 EMA (black) and 21 EMA (blue). It is also above the 10/31 Anchored Volume Weighted Average Price (AVWAP, orange) and the Post Election Day AVWAP (also in orange). Nerves regarding the NVDA earnings held investors back, but now that it has passed and it was a “nothing burger” investors found the courage to place their bets before the Thanksgiving rally. The Slow Stochastics indicator had a bullish crossover, telling us that the market is ready for an upside oscillation. The Chaikin Money Flow (CMF) indicator is above 0 showing that there is now net buying. Finally, we can see that the primary cycle renewed on 11/15, so a new uptrend is possible.
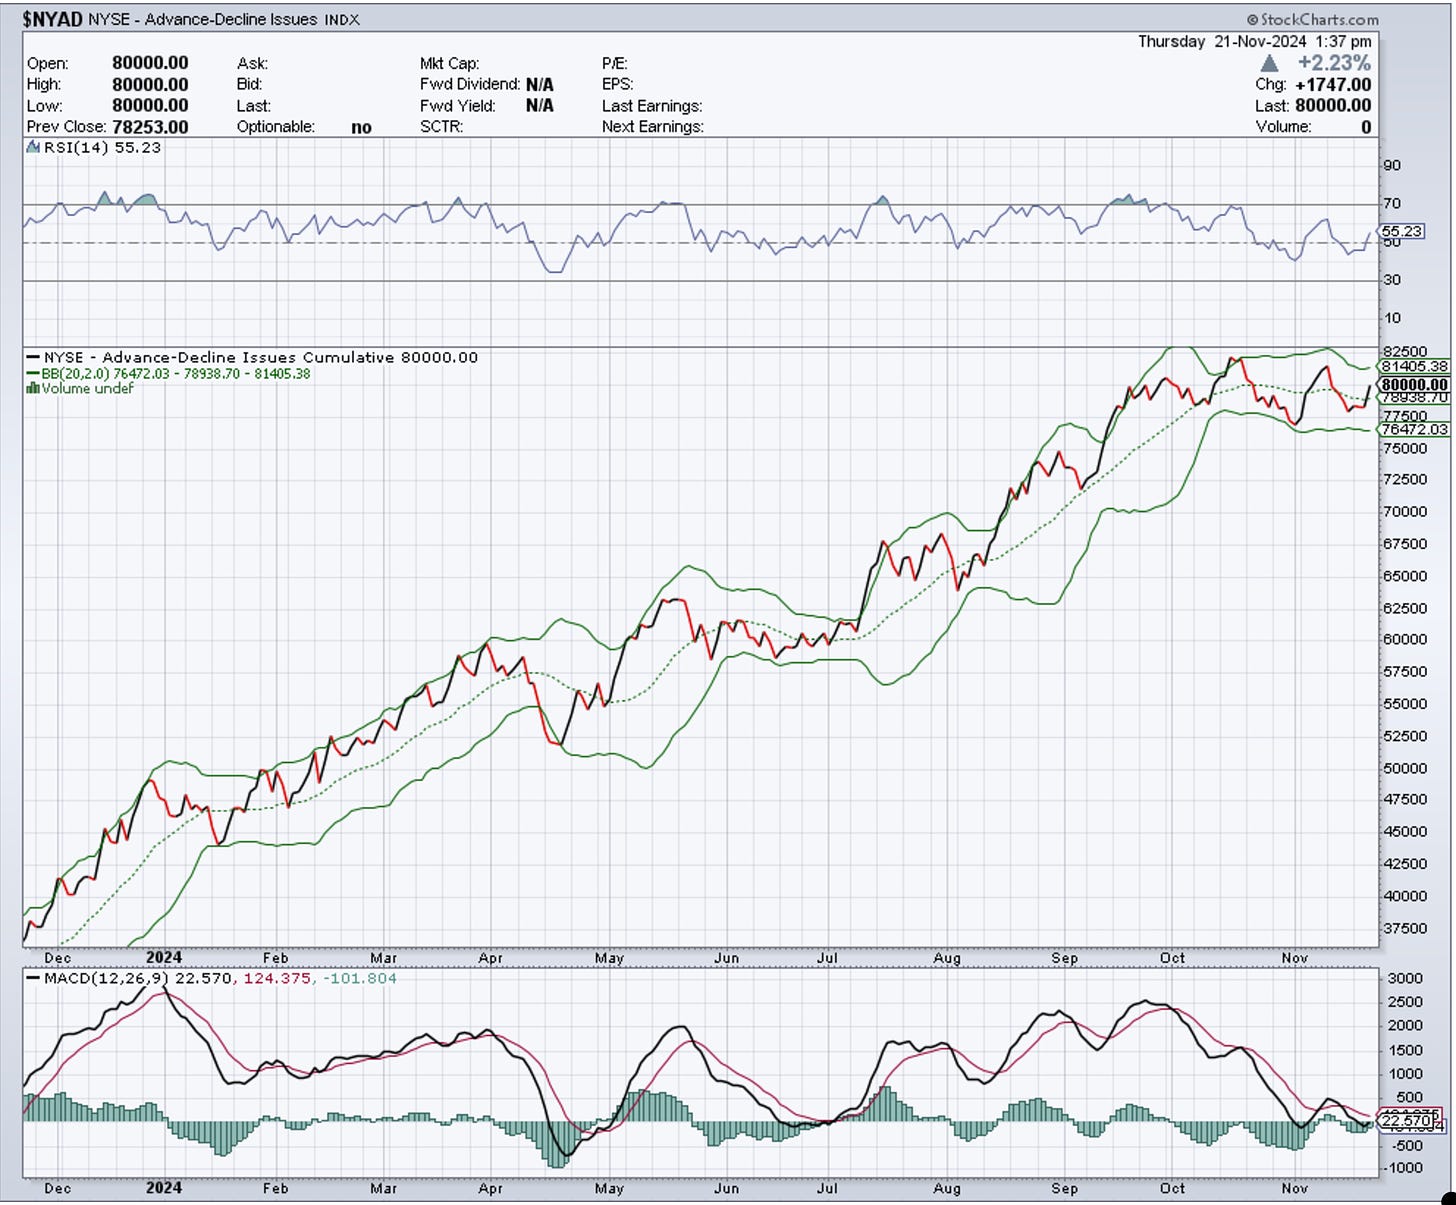
The NYSE Advance/Decline Line ($NYAD) is now heading higher and is past the 20 SMA. The RSI indicator shows a bullish divergence, hinting that a sustained uptrend in breadth is possible. This makes sense as institutional funds often cherry-pick the best stocks into year-end.
Before we get into our stock picks, let’s review what we believe is the best breadth oscillator to time the market…
Disclaimer - All materials, information, and ideas from Cycles Edge are for educational purposes only and should not be considered Financial Advice. This blog may document actions done by the owners/writers of this blog, thus it should be assumed that positions are likely taken. If this is an issue, please discontinue reading. Cycles Edge takes no responsibility for possible losses, as markets can be volatile and unpredictable, leading to constantly changing opinions or forecasts.


