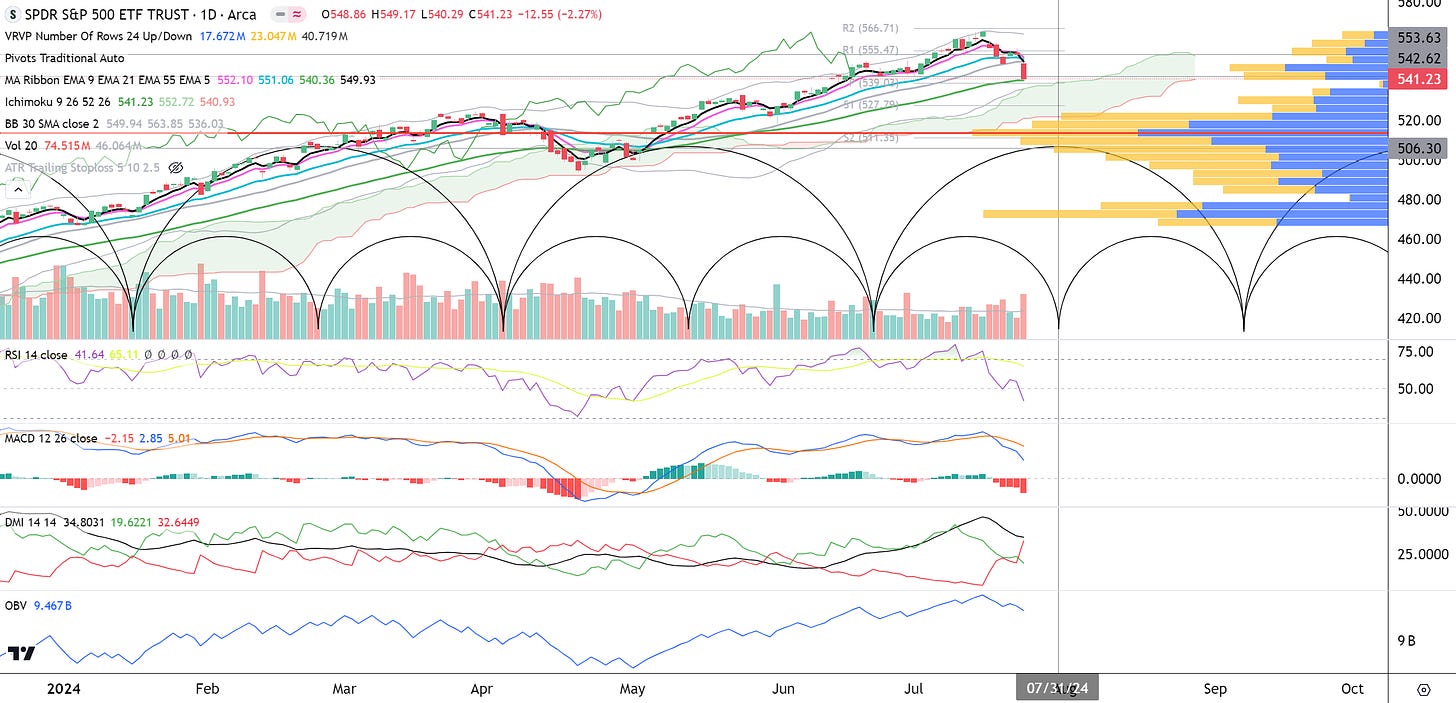
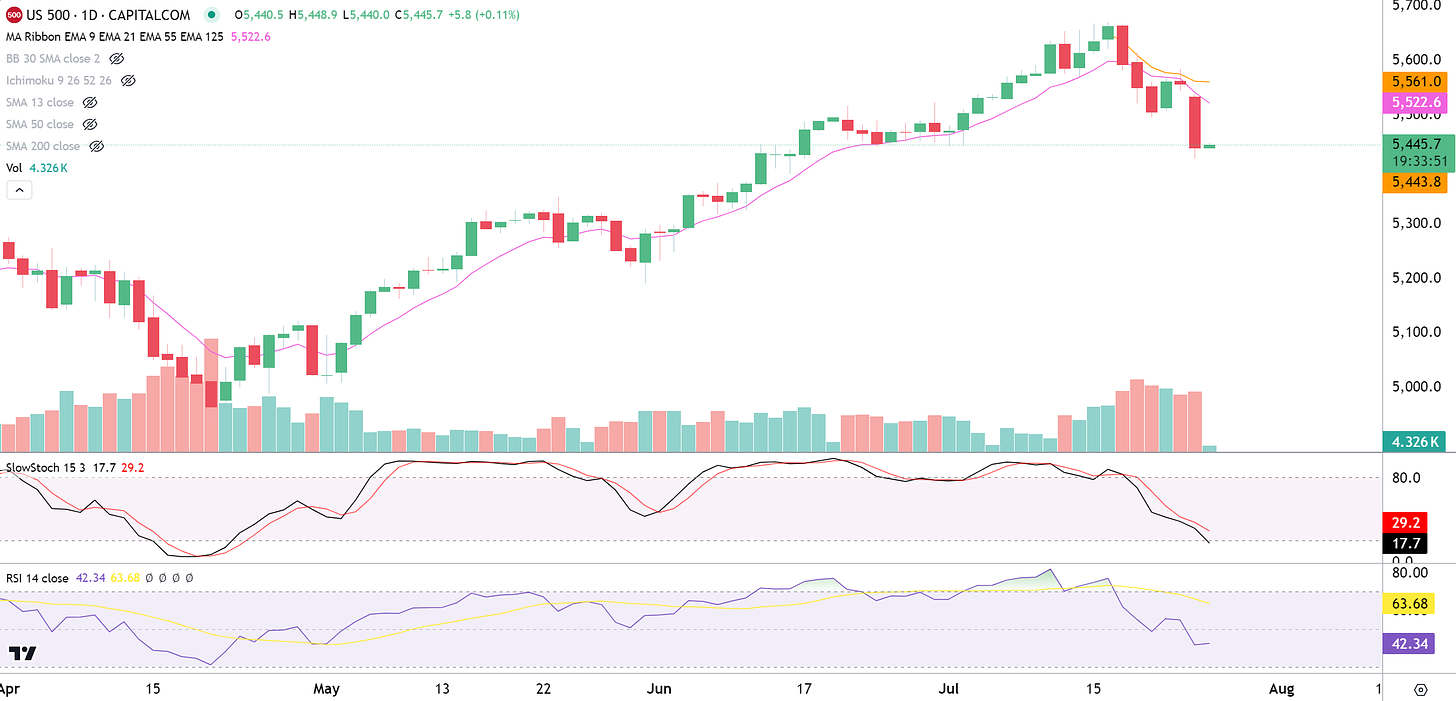
The S&P 500 (SPY) is down over 4% from the recent high. Last week we provided Cycle Warnings to our Paid Subscribers and it appears that the market is following the cycles we discussed. We have also been following the Distribution Days and we mentioned that despite the recent rotation into Small Caps, a decline on the S&P 500 below the 21 EMA could occur at any time.
What Next?
Now that the cat is out of the bag and the downtrend showed it’s hand what comes next?
Looking at the chart below we are in the half-cycle drop. This could change complexion around 7/31 as the half-cycle renews. Perhaps the decline stops here at the 55 EMA around $541, but since the RSI is not yet oversold, the chances of a further decline are high. The next key level is $535 where the Lower Bollinger Band and Ichimoku Cloud meet. Stronger support could lie there. If the market continues lower there is a previous resistance at $530 that may now serve as support. These are all levels where a tradeable bounce could occur.
To keep it simple the downtrend continues as long as price is below a declining 9 EMA (pink) and the Anchored Volume Weighted Average Price (orange) from the high.
The key is to consider the 4-Year Cycle. We’ll discuss this in our Premium Section. You won’t want to miss this.
Disclaimer - All materials, information, and ideas from Cycles Edge are for educational purposes only and should not be considered Financial Advice. This blog may document actions done by the owners/writers of this blog, thus it should be assumed that positions are likely taken. If this is an issue, please discontinue reading. Cycles Edge takes no responsibility for possible losses, as markets can be volatile and unpredictable, leading to constantly changing opinions or forecasts.


