Starting today, at the beginning of each month, we will provide Cycle Forecasts for the 12 main assets we cover. These include the S&P 500, Nasdaq 100, Russell 2000, the Volatility Index (VIX), 10-year Treasury Rate, Investment Grade Bonds, High Yield Bonds, US Dollar, Crude Oil, Gold, Silver, and Bitcoin. But first, we'll review market conditions.
Market Conditions
Last week was a wild ride due to the FOMC rate decision and Fed Q&A session. Although Fed Chair Powell expressed vigilance towards inflation, he also communicated several bullish points. These included: 1) keeping rates unchanged as he believed rates were sufficiently high to cool down inflation; 2) reducing the Fed's balance sheet reduction program, thereby increasing liquidity; and 3) mentioning that the economy is strong. Despite some volatility, the S&P 500 (SPY) ended the week up by 0.60%, marking it as constructively bullish.
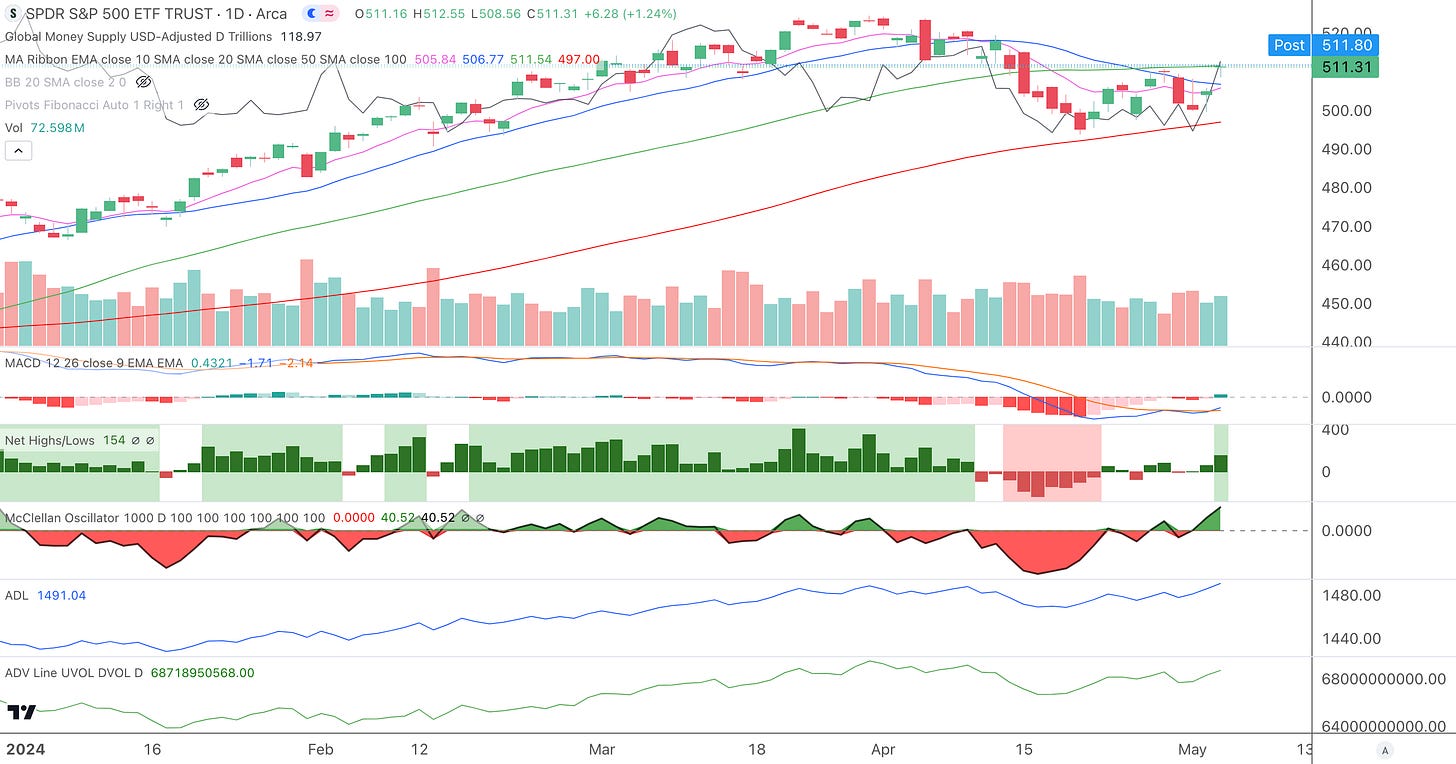
The SPY ended the week right at the 50-day Simple Moving Average (green line) which acted as resistance the prior week. Although a pullback to retest support levels is probable, this picture is starting to look more bullish. Price is above an up-sloping 10-day Exponential Moving Average (pink) and 20 Simple Moving Average (blue) which is flattening out. Significant buying volume came in after the FOMC meeting as Global Liquidity began to expand (black line). The MACD is making a bullish crossover as the histogram turns green. Net New Highs returned on Friday as the McClellan Oscillator, Advance/Decline Line, and Advance/Decline Volume Line all rose, signifying that the market’s buying appetite has returned.
But we’re still not out of the woods yet. The SPY is still below the Anchored Volume Weighted Average Price (AVWAP) from March 21st. Additionally, price is at the upper extreme of a Bear Flag pattern, which could lead to another leg down. The year-to-date AVWAP (orange) has been serving as support near the 23% Fibonacci Retracement level from the October 2023 low to the March 2024 high. The low of this correction may be in. Finally, the 10 EMA (pink) is below the 21 EMA (blue), which often precedes fake rallies. For a bona fide uptrend to occur, the 10 EMA must be above the 21 EMA. It is still early, and the market may need to back and fill before it takes off to new highs.
The recent price action stopped right at the confluence point of the 50 SMA (green) and the 62% Fibonacci Retracement level of this correction. If the price is unable to move up from here, another downdraft is possible.
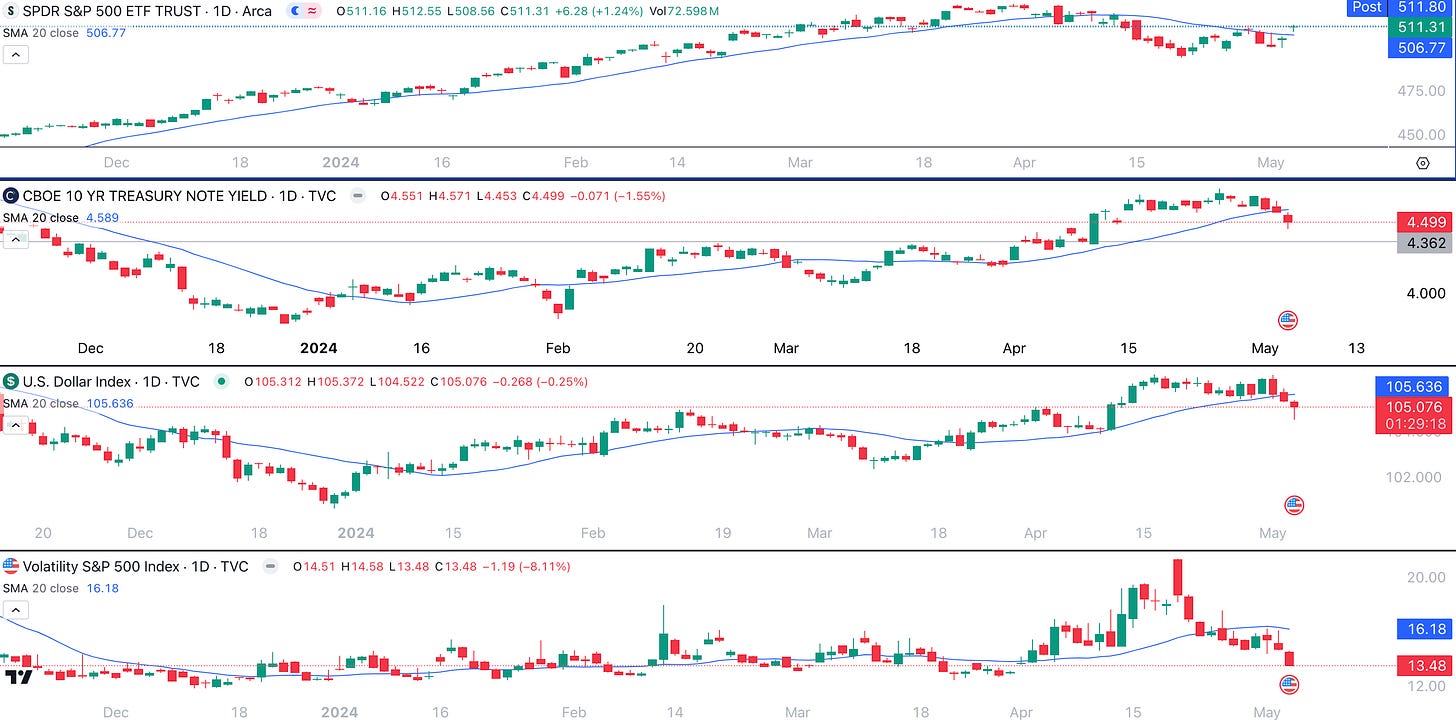
On the positive side, the intermarket picture is starting to look more supportive of another rally. Both the 10-year Treasury Rate (TNX) and the US Dollar (DXY) have dropped below their respective 20 SMAs, suggesting that new downtrends may be forming. Both the TNX and DXY have inverse relationships with equities. Additionally, the Volatility Index (VIX) has dropped below and held below its 20 SMA, indicating that the correction may be over.
The choppy price action may be explained by the interaction between the Intermediate Cycle (around 25 weeks) and the 4-Year Cycle. As we mentioned last week, the Intermediate Cycle might have bottomed on April 19th, and we could now be in a new cycle.
However, the 4-Year Cycle has yet to bottom. The cycle bracket from the 2016 low to the 2020 low predicts a low around May 13th. However, the orb for this low extends to November 2024. Moreover, the average drop for a 4-Year Cycle trough is 19% and it always seems to touch the 108-week Simple Moving Average. This has not occurred yet, and the price is currently not even close. Note that a drop of 19% from the $525 high would result in a price target of $425, just below the 108-week SMA.
Based on our cycles, we believe that the market will have one more uptrend before a more serious drop into the 4-Year Cycle low. In the near-term, look for a pullback to materialize between May 6th to May 15th. This should be a buyable pullback before possibly new highs.
In the Premium Section for paid subscribers we’ll cover the May 2024 Cycle Forecasts.
Disclaimer - All materials, information, and ideas from Cycles Edge are for educational purposes only and should not be considered Financial Advice. This blog may document actions done by the owners/writers of this blog, thus it should be assumed that positions are likely taken. If this is an issue, please discontinue reading. Cycles Edge takes no responsibility for possible losses, as markets can be volatile and unpredictable, leading to constantly changing opinions or forecasts.


