No Emotions, Only Data Approach
4 Key Metrics Sending a Strong Message

Our Annual 2026 Cycle Forecasts that can be found here.
This is a key piece of our strategy to stay on the right side of the market!
Here’s a quick rundown of what to expect:
1 PDF deck covering 20 different key assets
Each Forecast includes 3 key Cycles - Cycles Composite (our “Secret Sauce”), Energy Cycle (estimates the Power behind a move) and Seasonal Cycle
Access to our team to ask any additional questions anytime of the day or night, including weekends!
Founding Members get the added benefit of requesting us for the Cycle Forecasts for ANY asset.
Please note that we’ve updated the composition of our Cycles Composite (our “Secret Sauce”) in order to increase its accuracy. These modifications are made based on the current market conditions and the backtesting results.
4 different indicators that many investors rarely follow, or maybe are not even aware of, recently flashed key signals.
In this article, we’re going to breakdown each of these signals and provide you with a statistical look at what to expect.
Metric 1: S&P High Beta / S&P High Quality Relative Ratio Rank
The first indicator to highlight is the S&P High Beta / S&P High Quality Relative Ratio Rank indicator.
This indicator examines the relationship between high-beta (i.e., more volatile) and high-quality (i.e., less volatile) stocks.
The chart below illustrates the ratio’s position relative to its range over the past 4 months.
When the relative ratio is high, investors are showing risk-on behavior and when the ratio drops to a low level, they are exhibiting risk-off behavior.
In theory, the stock market should perform better when investors are in “risk on” mode, as aggressive buying stands to propel stock prices higher.
The chart below highlights all dates when the indicator crossed above 85, including all overlapping signals.
The most recent signal occurred on January 2nd.
This is an example of a “continuation” signal.

The table below summarizes the subsequent performance of the S&P 500.
The key thing to note is the decent returns and win rates for periods of 2 months and beyond, especially for 6 and 12 months.

But in order to assess the complete picture, we need to consider the other 3 metrics.
After all, 1 standalone indicator can still fail, but when there’s confluence then the chances of a failure are significantly reduced.
NOTE: Make sure to pay special attention to metric 3 - this has been extremely helpful for anticipating pullbacks.
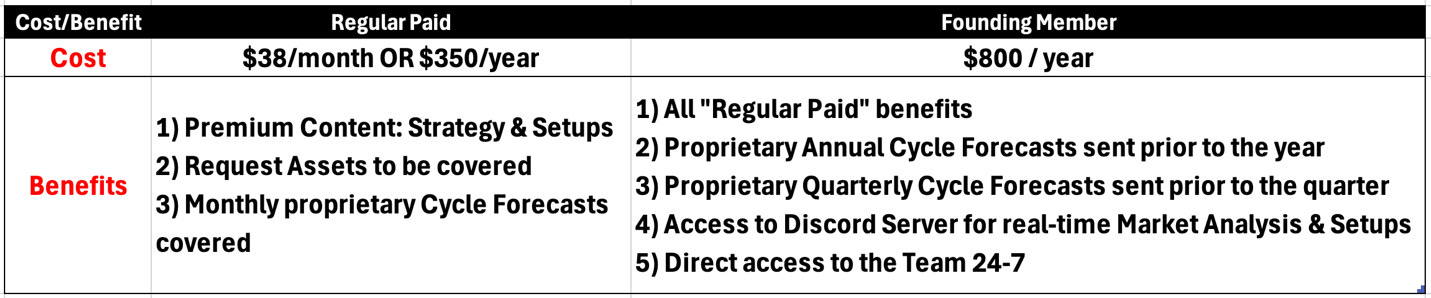
Find our membership cost/benefits below.
If you’re serious about Making Money (our primary goal at Cycles Edge), then the Premium Sections are key for you!