


Oil, Natural Gas, Copper and Wheat (Part 1) – Commodity Piece
All The Key Details You Need To Know

In this article, we’re going to be analyzing the state of 4 different Commodities: Oil, Natural Gas, Copper and Wheat. The article will be divided into Part 1 and Part 2, wherein, Part 1 covers Oil and Natural, and Part 2 covers Copper and Wheat. Now let’s dive in!
Oil – Technical Analysis
In the past few days, Oil has seen quite a bit of downside led by the fears of a weakening US economy. Price broke the multi-month uptrend line, along with losing the 9, 21 and 55 daily EMAs. The MACD is bearish while also being below the 0 line, whereas, the RSI has remained in the bearish control zone for a month now. However, all is not over for Oil bulls yet.
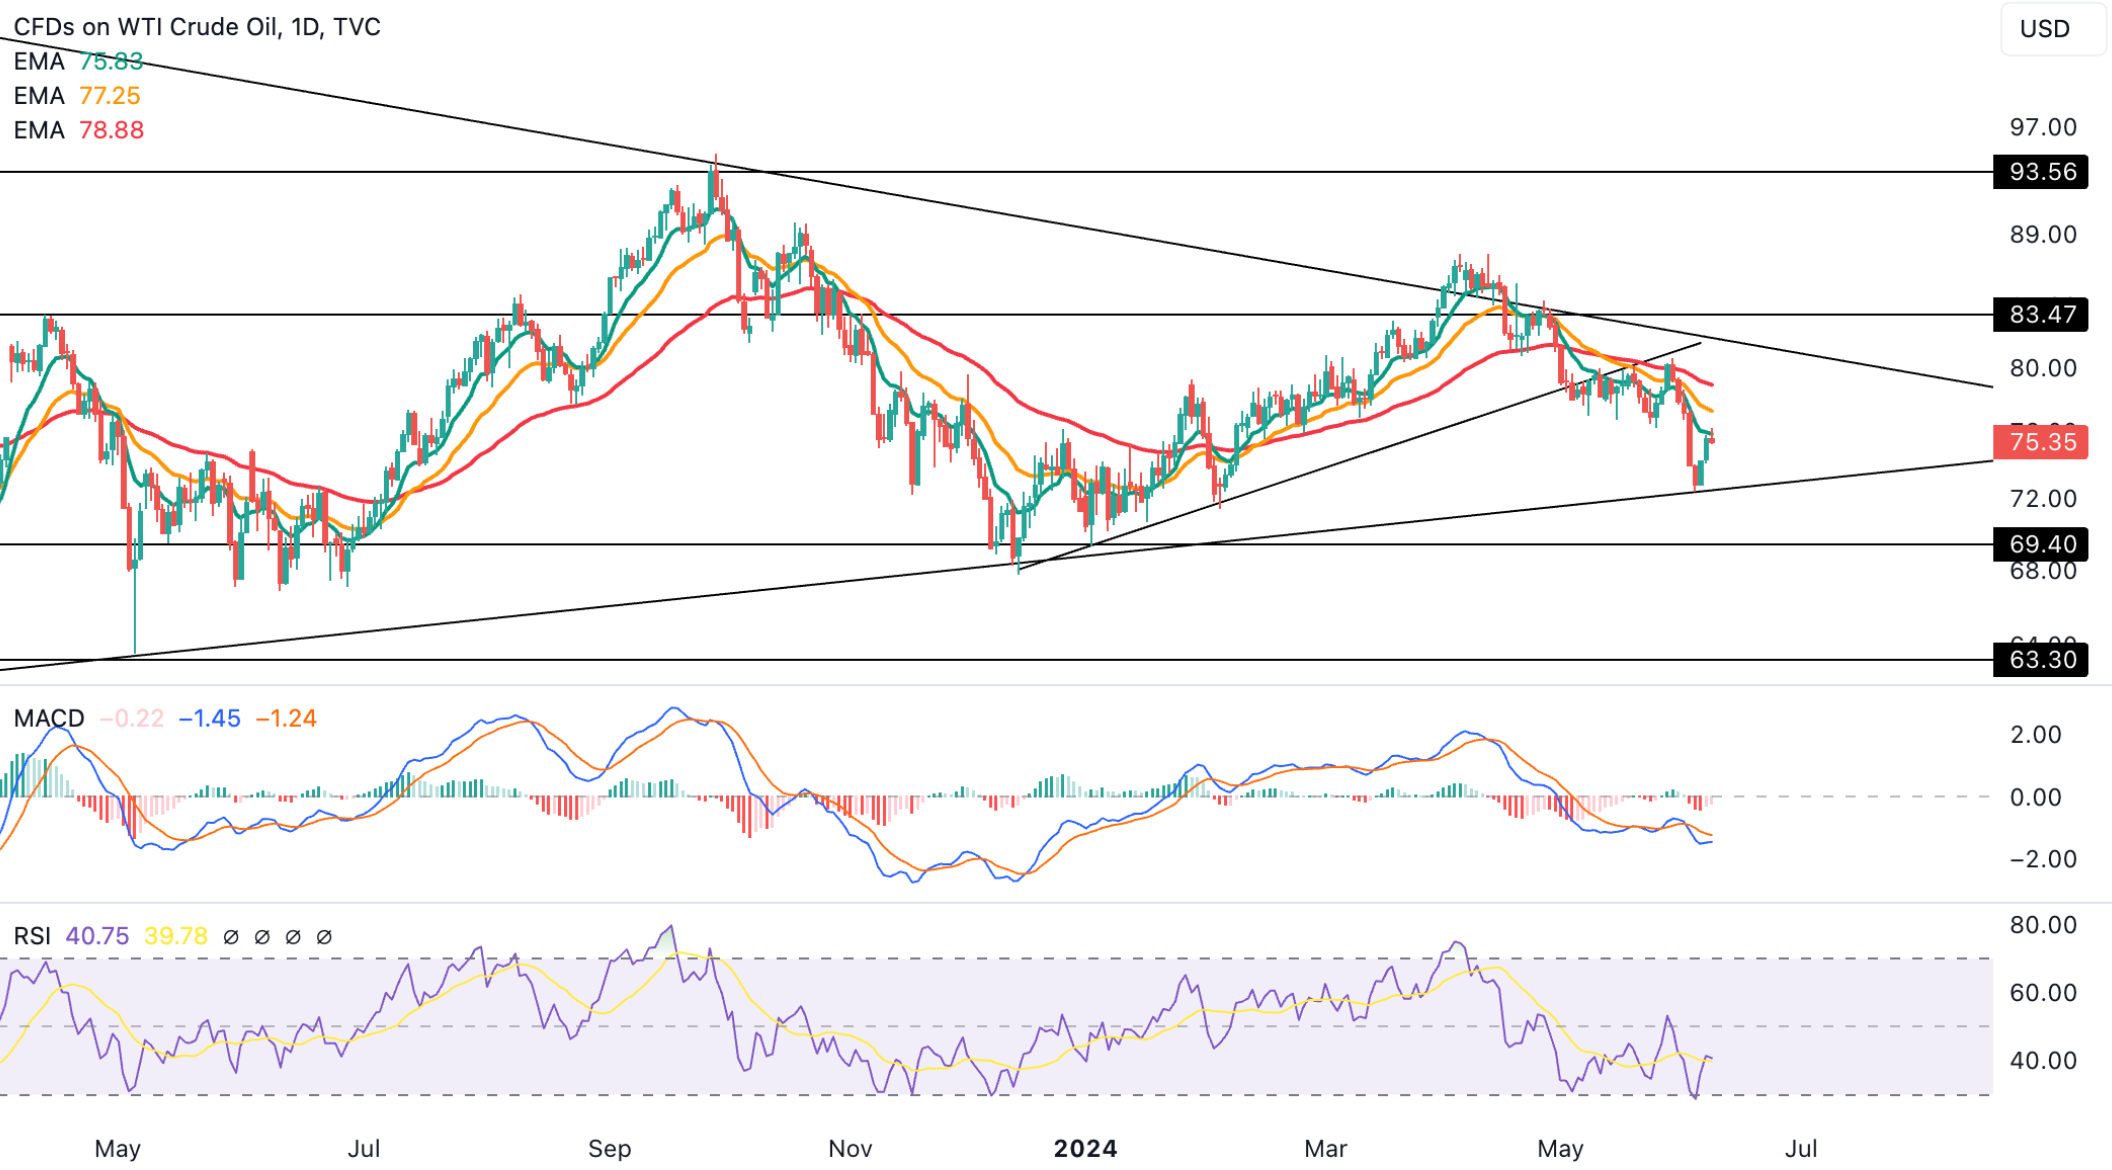
On the weekly chart, Oil has come down to the support of its contracting triangle. However, this has come at the cost of a bearish MACD cross (still above the 0 line though) and a loss of the 9, 21 and 55 weekly EMAs. This contracting triangle support is a critical support for Oil because a weekly close below it would put $69.4 and potentially even $63.3 in the event of a big sell-off. On the other hand, for those looking to buy support can do so in the coming days and load off the position if/when Oil gets back to the contracting triangle resistance, which is currently around $80. For this type of a trade, the stop-loss can be placed below the support line of the contracting triangle.

Oil – Intermarket Analysis
Oil and the ISM Manufacturing PMI has a very close correlation has seen in the chart below. The ISM Manufacturing PMI is a good indicator for the health of the US economy from a manufacturing standpoint. Therefore, the close relation between Oil and ISM Manufacturing PMI makes sense because when the economy does well then demand for Oil usually increases and vice-versa. Recently, the ISM Manufacturing PMI surprised to the downside and has re-entered contraction (below 50 reading). This is partially responsible for sparking growth related fears for the US economy, which has also translated into lower Oil prices.

An interesting intermarket relation that has shown a very close correlation is 10-year Treasury yield with Oil. Since late-2022, Oil has acted as a leading indicator for the 10-year Treasury yield, so when Oil has a sharp move in either direction then the 10-year Treasury yield has shown a tendency to follow with a lag. This relationship isn’t perfect though, for instance, Oil spiked significantly around April 2023, but the 10-year Treasury yield fell during that period. However, this relationship is worth keeping an eye on for investors because the 10-year Treasury yield affects a lot of different markets.

In the next section for our Paid Members, we’ll take a look at Oil’s Cycles Forecast. We’ll also provide an overview of the technical picture for Natural Gas and its Cycles Forecast. In the Follow Up Part 2 for this Piece (only for Paid Members) we’ll then dive into Copper and Wheat.