After a big run up following the 2020 drawdown, Oil peaked in mid-2022 and fell from $120+ to around $65, almost a 50% decline. However, overtime it seems like Oil has been actually putting in a rounding bottom structure. This is typically a bullish accumulation structure that ends up with more upside.
More recently, Oil has been battling its neckline in an inverted head and shoulders pattern. If this breakout gets confirmed, it’ll likely lead oil to the $88.50 region (patten target). However, a breakdown below the neckline around $78 (with confirmation) would indicate a false breakout.
The next section is usually only for Paid Members, but we’re keeping it free this time to provide a sample of what one can expect for Paid Members from the “Quick Notes” type of articles. In the next section, we’ll look at the Cycles Bracket and Cycles Forecast for Oil. We’ll also look at another positional trading opportunity in the Energy sector.
Oil Cycles Bracket
The Cycles Bracket for Oil shows potential for some sideways/pullback from now until 20th March, which might present a buying opportunity. Perhaps Oil does a fake breakdown of the inverse head and shoulders pattern only to then confirm a breakout above it.
Oil Cycles Forecast
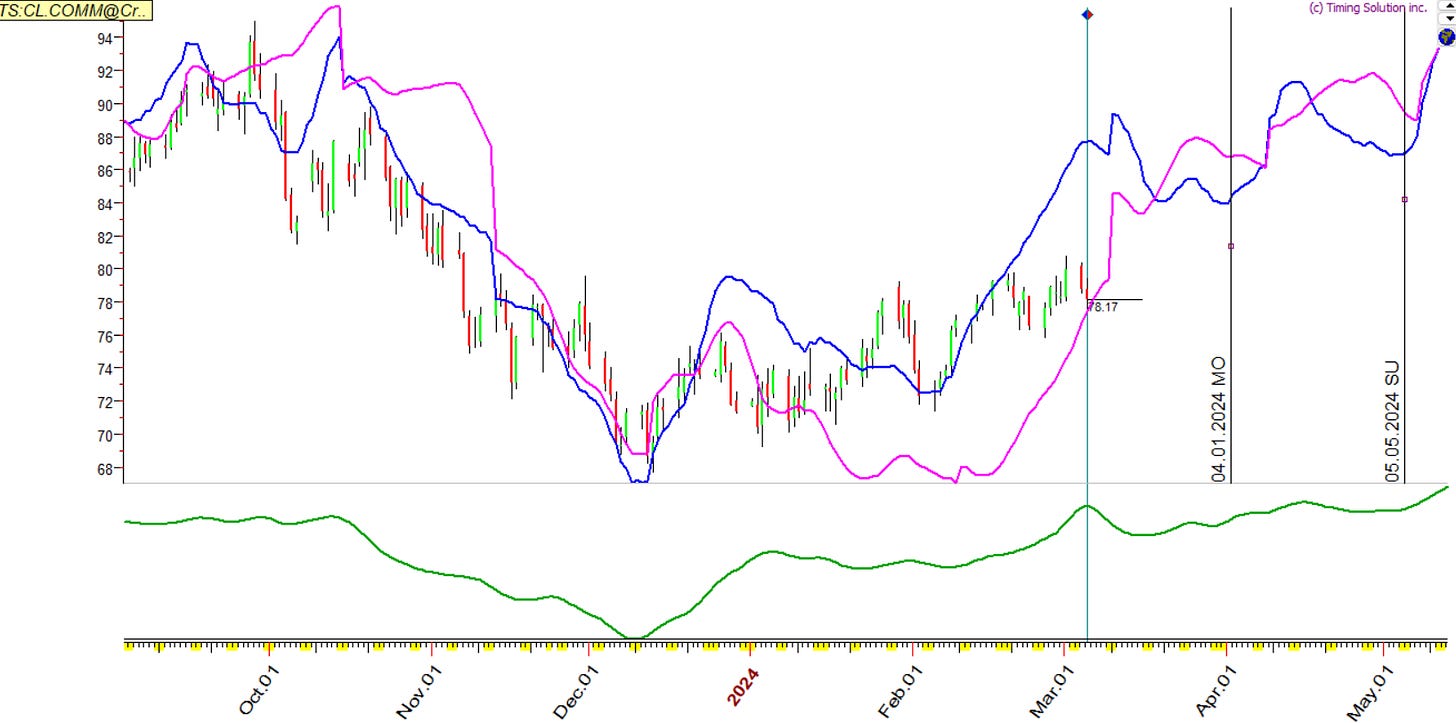
We’re confident in Oil not only because of a confluence of the rounding bottom + inverted head and shoulders pattern (yet to be confirmed), but also its Cycles Forecast. All the 3 Cycles below point to more upside, albeit choppy, for Oil until at least May.
The 3 Cycles in the chart below are:
1. Pink = Energy Cycle
2. Blue = Cycles Composite (our “Secret Sauce”)
3. Green = Seasonal Cycle)
Natural Gas Trade Opportunity
Another opportunity that has turned up is in Natural Gas. This asset, also known as the Widow Maker due to its volatility, has just formed a bullish RSI divergence on the weekly time frame. Moreover, buyers stepped in at a critical support level of the $1.60 region, a promising sign. This setup likely leads to a bounce in Natural Gas to at least the $2.50 region (35% + upside from current level). Stop-losses can be kept under $1.59 on a confirmed daily close + one day of confirmation.
Enjoy the Money-Making setup. Our only goal is to help make you as much money in the current market environment with proper risk management. Feel free to ask us any questions in the comments below or if you require suggestions for ticker symbols in order to get exposure to Oil or Natural Gas. Until next time!
Disclaimer - All materials, information, and ideas from Cycles Edge are for educational purposes only and should not be considered Financial Advice. This blog may document actions done by the owners/writers of this blog, thus it should be assumed that positions are likely taken. If this is an issue, please discontinue reading. Cycles Edge takes no responsibility for possible losses, as markets can be volatile and unpredictable, leading to constantly changing opinions or forecasts.


Hello Cycles Edge team,
I like your cycle-charts! The cycles-composite really complements well the traditional tools of technical analysis.
I also do believe in market-timing. Nobody said it's going to be easy, but combining TA, intermarket-analysis and cycles probably gives us better odds to conquer the game ;-)
Cheers from Germany
Mathias