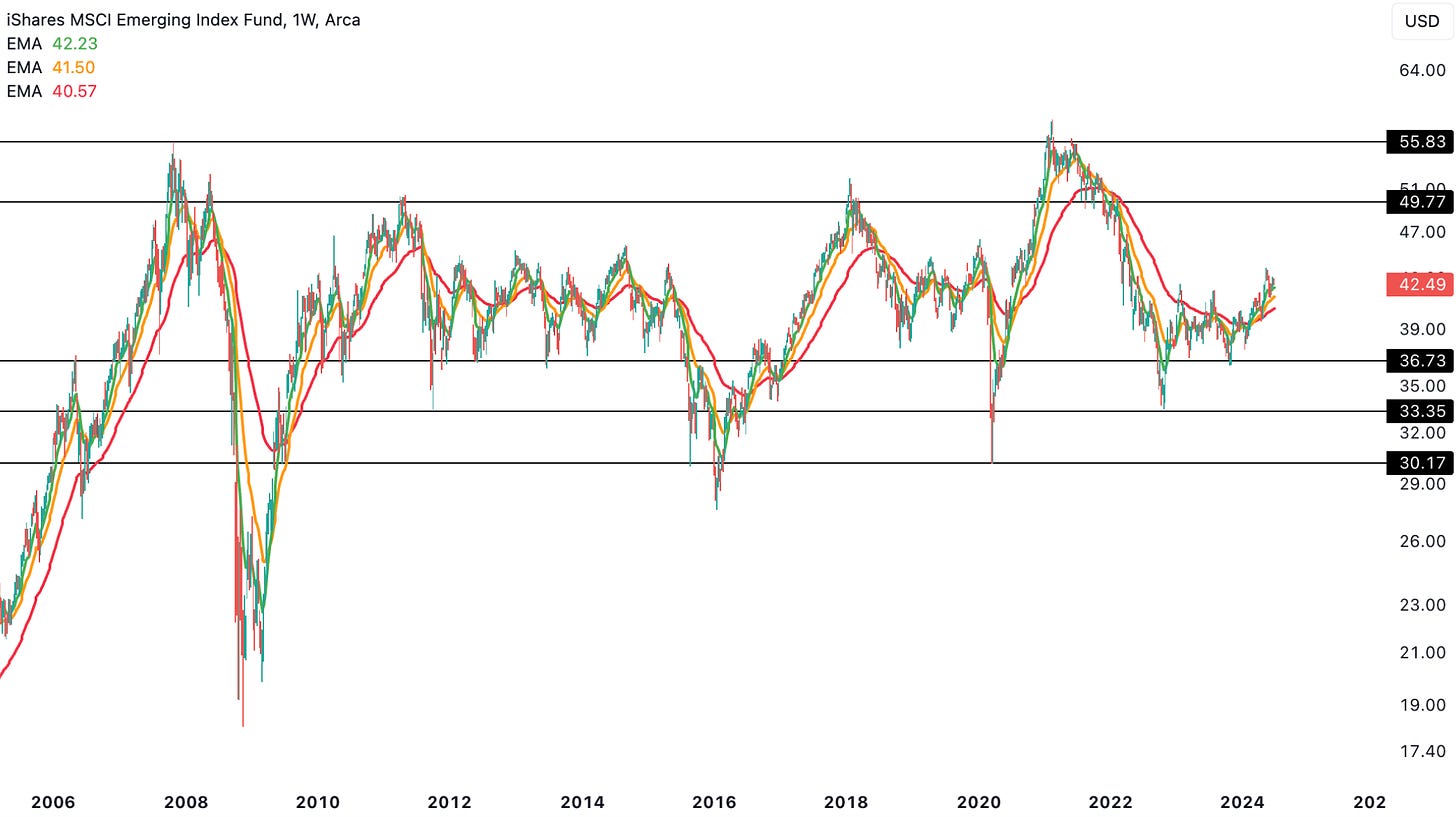
A lot of markets have gotten quite over-extended in recent weeks, but Emerging Markets ($EEM) still presents an attractive opportunity. Bouncing off the $36.73 support level in Oct 2023, $EEM has now reclaimed the 9, 21 and 55-weekly EMAs, with all the 3 key moving averages curling upwards now. The next level of resistance comes in at $49.77 and above that is the $55.83 level.
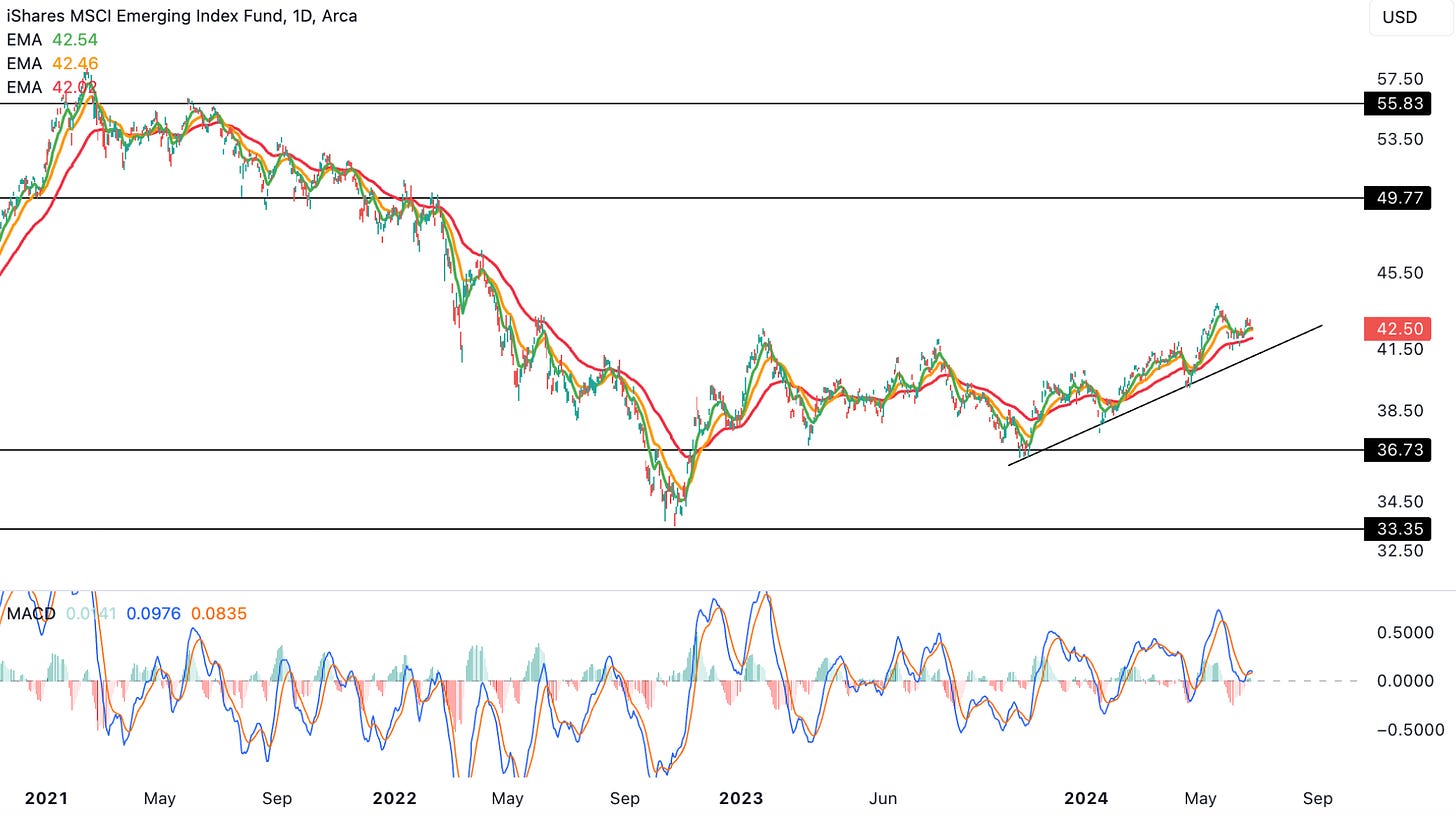
On the daily timeframe, $EEM has been in a clear uptrend. Each pullback to the uptrend line presented investors with a good buying opportunity. Currently, a pullback to the uptrend line would see price hit $41.40 region, although it might make sense to start DCAing into this position from the 55-daily EMA retest itself (around $42). Stop-loss for this setup can be pretty tight with at least 2 confirmed daily close below the uptrend line (at $41.40 level). This provides a very attractive risk-reward setup.
In the next section (for Paid Members only), we’re going to look at $EEM seasonality and its backtest numbers. Then we’ll go through data that shows the best month to be exposed to this ETF. Lastly, we’ll cover $EEM’s Cycles Forecast using our proprietary model.
NOTE: Our Q3 2024 Cycle Forecasts will be available for sale on Wednesday, 26th June, at cyclesedge.com. We will be covering multiple different Indexes, Sectors, Commodities, Cryptos and Leading Stocks using our proprietary Cycles Forecast. Founding Members have already been emailed ALL the Q3 2024 Cycles Forecast. This is one of the many benefits of being a Founding Member, so consider upgrading your membership. We also have another surprise in the works for all our Founding Members that we’ll reveal in Q3 2024.
$EEM Seasonality


