Let’s start by counting candles. Weekly candlesticks to be more exact (each candle represents 1 week). Looking back to 2019 (in the chart below) uptrends tend to last between 18 to 27 weeks. If you go further back in history you’ll see this pattern repeating. This phenomenon is what Cycle Analysts refer to this as the Intermediate Cycle and it typically lasts between 18 to 25 weeks. Note that:
The rally that started in January 2019 lasted 18 weeks, then had a 4-week pullback,
The rally that started in August 2019 lasted 24 weeks, then had a 5-week correction,
The rally that started in March 2020 lasted 22 weeks, then had a 9-week consolidation,
The rally that started in November 2020 lasted 26 weeks, then had a 6-week consolidation,
The rally that started in June 2021 lasted 27 weeks before the bear market of 2022,
The rally that started in March 2023 lasted 19 weeks, then had a 13-week correction.
We are now on week 18 of the uptrend that began in late October 2023. Perhaps this cycle extends to 20, 24, or 27 weeks. Perhaps it ends next week. Nonetheless, this Intermediate Cycle is getting old, and institutional investors seem to know it.
That’s why there has been a “sell the rip” dynamic to the market lately. Institutions are using rallies to sell high. This is evident in NVDA, one of the leader stocks of this rally. On Friday NVDA (15-minute chart below) gapped up and rose about 5% before profit-taking came in, closing the stock down 5% for the day on high volume. A 10% intraday swing is characteristic of volatility that occurs before a trend change.
Looking at the daily chart, NVDA went up in a parabolic fashion, and when that occurs a reversal is often close. Specific to NVDA, when the price gets stretched around 10% from the 10 EMA (pink line) a pullback or consolidation often occurs. Notice the heavy selling volume. This is definitely profit-taking being done by institutions.
AMD had a similar look. On Friday it gapped up and appreciated about 7.5%, before selling off and ending the day down 1.89% on high volume. Again, institutional profit-taking on high volatility, a 9% intraday swing.
Looking at the Commitment of Traders report for the Nasdaq 100 confirms that Asset Managers have been selling high.
Moreover, Market Makers (Dealers) still have a large short position that they will be eager to exit at lower prices for a profit.
Although it came a bit late, it seems like seasonal selling in March will occur in some form. So far it’s been a “sell the rip” dynamic. We’ll have to see if the selling gets more aggressive in the upcoming weeks. Look for a seasonal buy point in late March before the Easter rally.
Market Conditions: Orderly Pattern So Far
Despite the parabolic action in some of the leader stocks such as NVDA and AMD, the S&P 500 (SPY) is moving in an orderly fashion for now. It finds support at the 10 EMA (pink line) or 21 EMA (blue line), rises to the Upper Bollinger Band (grey line), and sells off. Rinse and repeat. Until the SPY breaks and stays below the 21 EMA. this dynamic could continue. Of course, a break below the 21 EMA would mean that the Intermediate Cycle is over and more intense selling may occur.
For now, it is still a “Swing Trader’s Market” as 1) price is above the 21 EMA, 2) there are Net New Highs, and 3) the MACD indicator is above 0. This favors trading in individual stocks. However, the McClellan Oscillator is declining, showing profit-taking in stocks. Stock traders should be ready to protect profits quickly. The VIX is inching higher but is not at alarming levels (20 to 25+) yet. The Put/Call ratio is at a low implying that people got excited and loaded up on call options. It would be a good time for the market to drop so market makers don’t have to pay call buyers. The Retail Only Put/Call Ratio below shows the high level of call buying, which often results in a pullback.
The Fear & Greed Model shows that fear may be increasing as Greed is starting to roll over. A break in the market could cause fear to return with some power.
Cycles: Does the Music Stop?
The Cycles Composite (blue forecast), Energy Cycle (pink forecast), and Seasonal Cycle (green forecast) are pointing to a down-cycle in March (chart below). Yet the market has been so strong on the excitement of Artificial Intelligence. With NVDA, one of the leading AI stocks, getting hit with profit-taking, we have to be open-minded to the scenario where the cycles are correct and the market drops surprisingly fast in March.
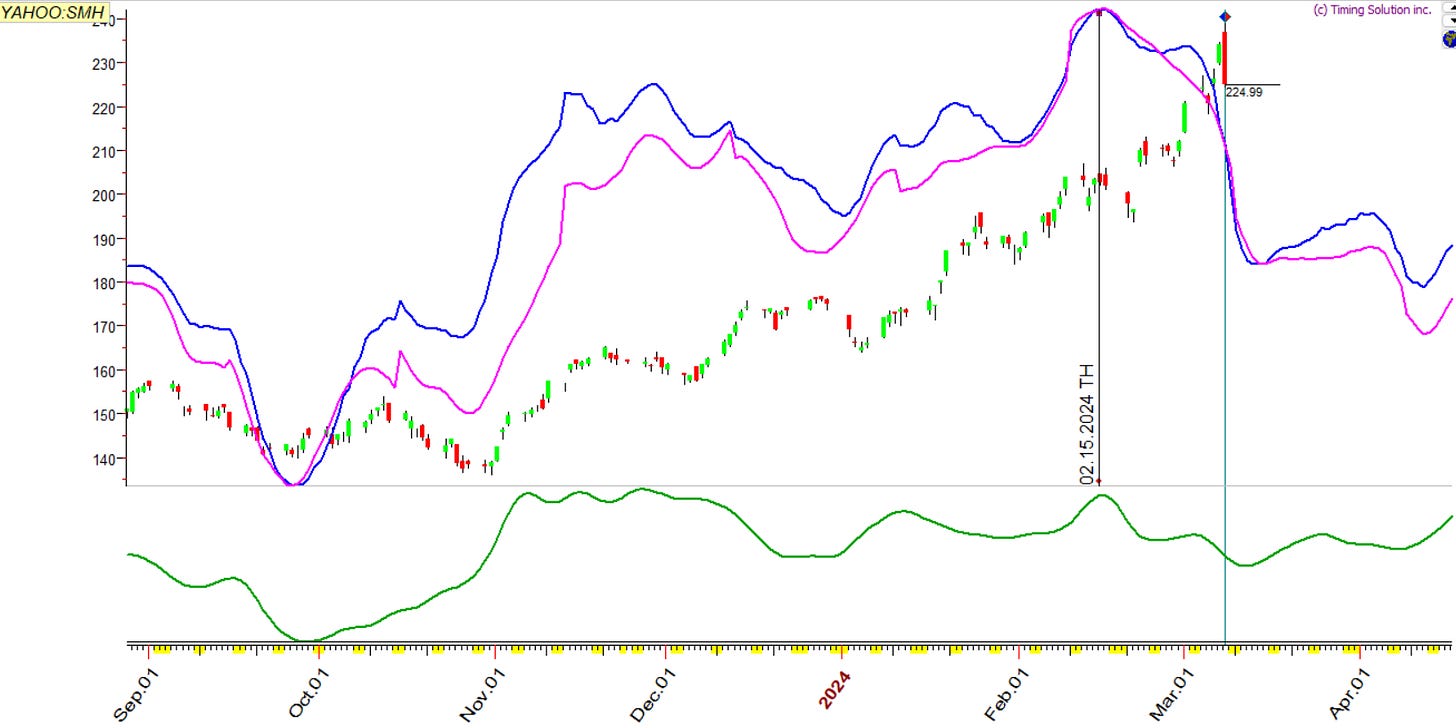
Semiconductors were slated to have a selloff in mid-February according to our Cycles shown below. It’s possible that this down-cycle still occurs albeit late. If profit-taking in NVDA and AMD continues, then semiconductors can suffer a bit in March. On the other hand, new buyers may buy the dip in NVDA, AMD, and SMH to keep this rally going.
Conclusion
The rally is late in the Intermediate Cycle and institutions are beginning to take profits. However, with money flowing out of technology stocks, it has to flow somewhere. For our Paid Subscribers, we’ll review the 2-hour Chart Cycle for SPY and go over opportunities in bonds, energy, and materials.
Disclaimer - All materials, information, and ideas from Cycles Edge are for educational purposes only and should not be considered Financial Advice. This blog may document actions done by the owners/writers of this blog, thus it should be assumed that positions are likely taken. If this is an issue, please discontinue reading. Cycles Edge takes no responsibility for possible losses, as markets can be volatile and unpredictable, leading to constantly changing opinions or forecasts.


