Why do I feel like we are in an Oliver Twist market:
Oliver Twist (Investors): Please Sir…I want some more.
Mean Fat Guy (Market Makers): WHAT…MORE? SNATCH HIM…HURT HIM…POUNCE HIM!!!
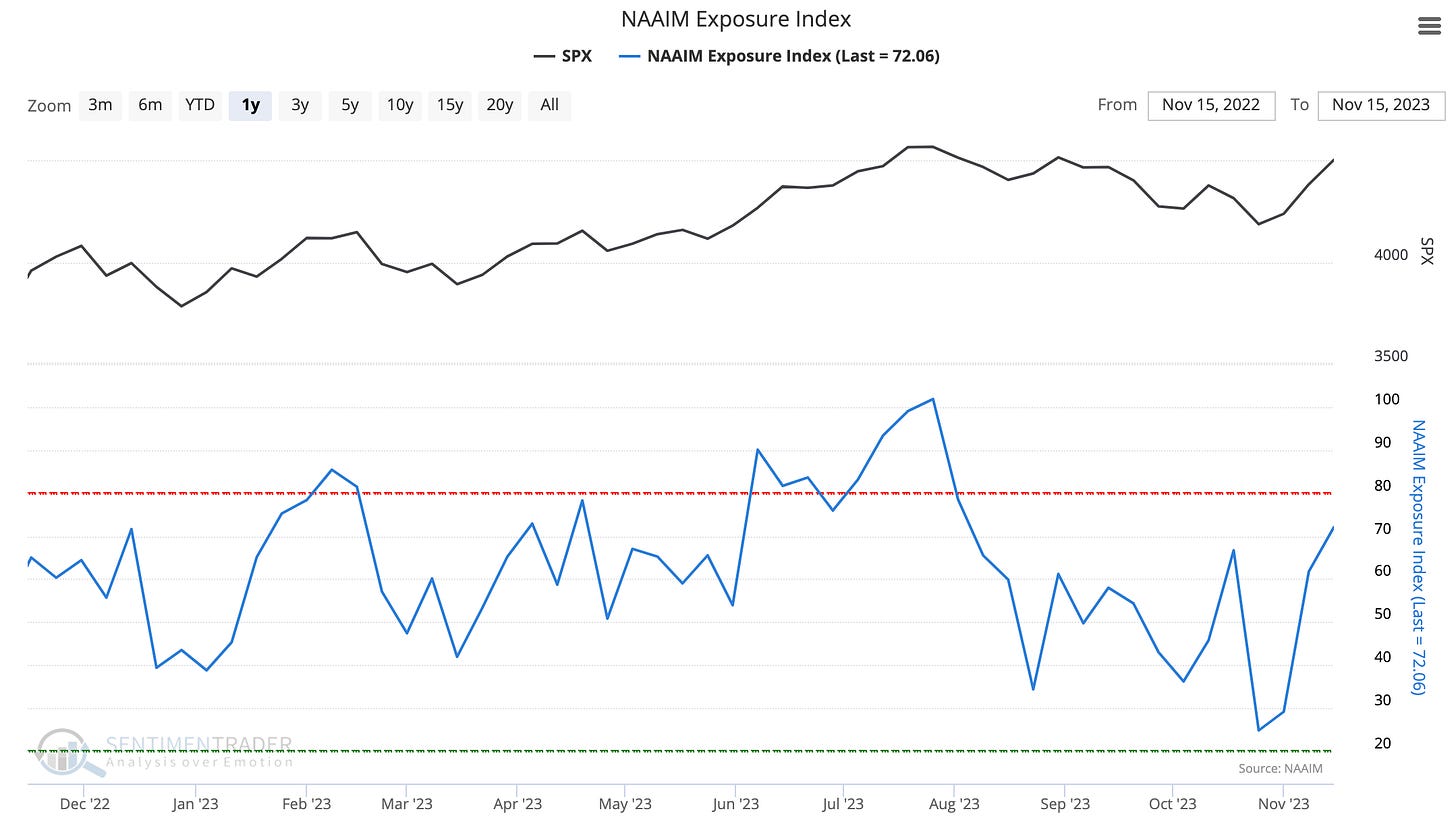
Investors have finally turned bullish after a lower-than-expected CPI report on Tuesday and that makes sense. If inflation is decreasing, the Fed can pause its rate hiking program, which is good for the economy and stock valuations. The chart below shows Dumb Money (that means us, the Little People) piling their money back into equities last week.
Financial Advisors (also considered the Little People) continue to re-risk client portfolios rapidly as the NAAIM equity exposure index rose from 25% to 72% in just a little over 2 weeks.
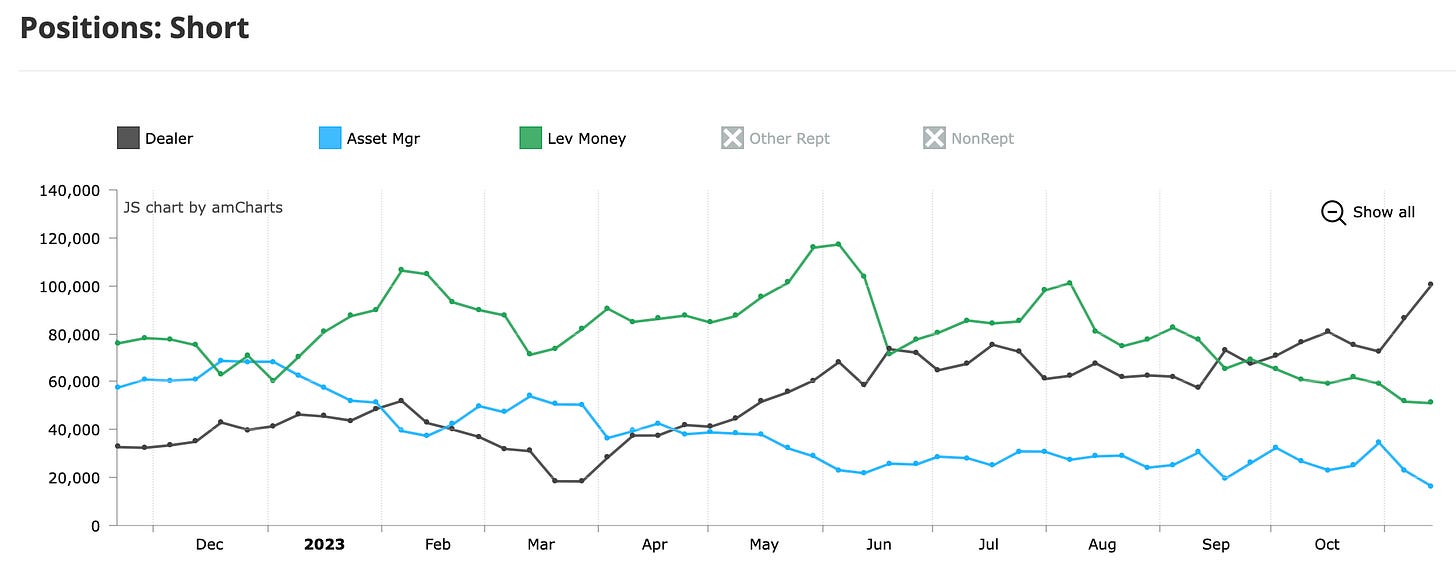
So on one hand we have us, the Little People, now heavily invested in equities and holding out our hands hoping for a Thanksgiving and Christmas rally. What’s the Mean Fat Guy (Market Makers) doing? They are selling long positions in the Nasdaq 100 (and other indexes) and building short positions. It’s a little worrisome that when everyone now went bullish, the house is shorting the market. This is displayed in the next three commitment of traders (COT) charts below. It is possible that the Market Makers are just making a market for the Asset Managers, who are buying heavily — Asset Managers buy and Market Makers sell or sell short to them to fill their orders. Nonetheless, they have a short position that they have to manage, and often that means buying their shorts back at lower prices at some point in time.
So will get get a Thanksgiving Rally or a Thanksgiving Rug-Pull?
The Technical Picture:
We are in a Lockout Rally at the moment. We did not get a buyable dip and even on two of the most bearish days of the month, VIX Expiration (Thursday) and Options Expiration (Friday), buying pressure was so strong it supported the market on otherwise typically volatile days. The S&P 500 is forming a sideways consolidation to digest the large move on Tuesday after the bullish CPI report. Global Money Supply (black line) is rising which is supporting the market. The RSI indicator is overbought but can stay overbought for a long time. Meanwhile, the MACD indicator is showing strong momentum. The 10-year Treasury rate continues moving lower, which is supportive of higher prices. The market achieved net new highs this week and moreover, breadth (McClellan Oscillator) was strong. Finally, volatility was low and it is especially bullish that the VIX did not spike on VIX or Options expiration days. It is possible that the market does not have anything to fear at the moment as declining inflation hints at a Fed pause and the shock value from the Israel-Hamas War is over since the war is now over a month old.
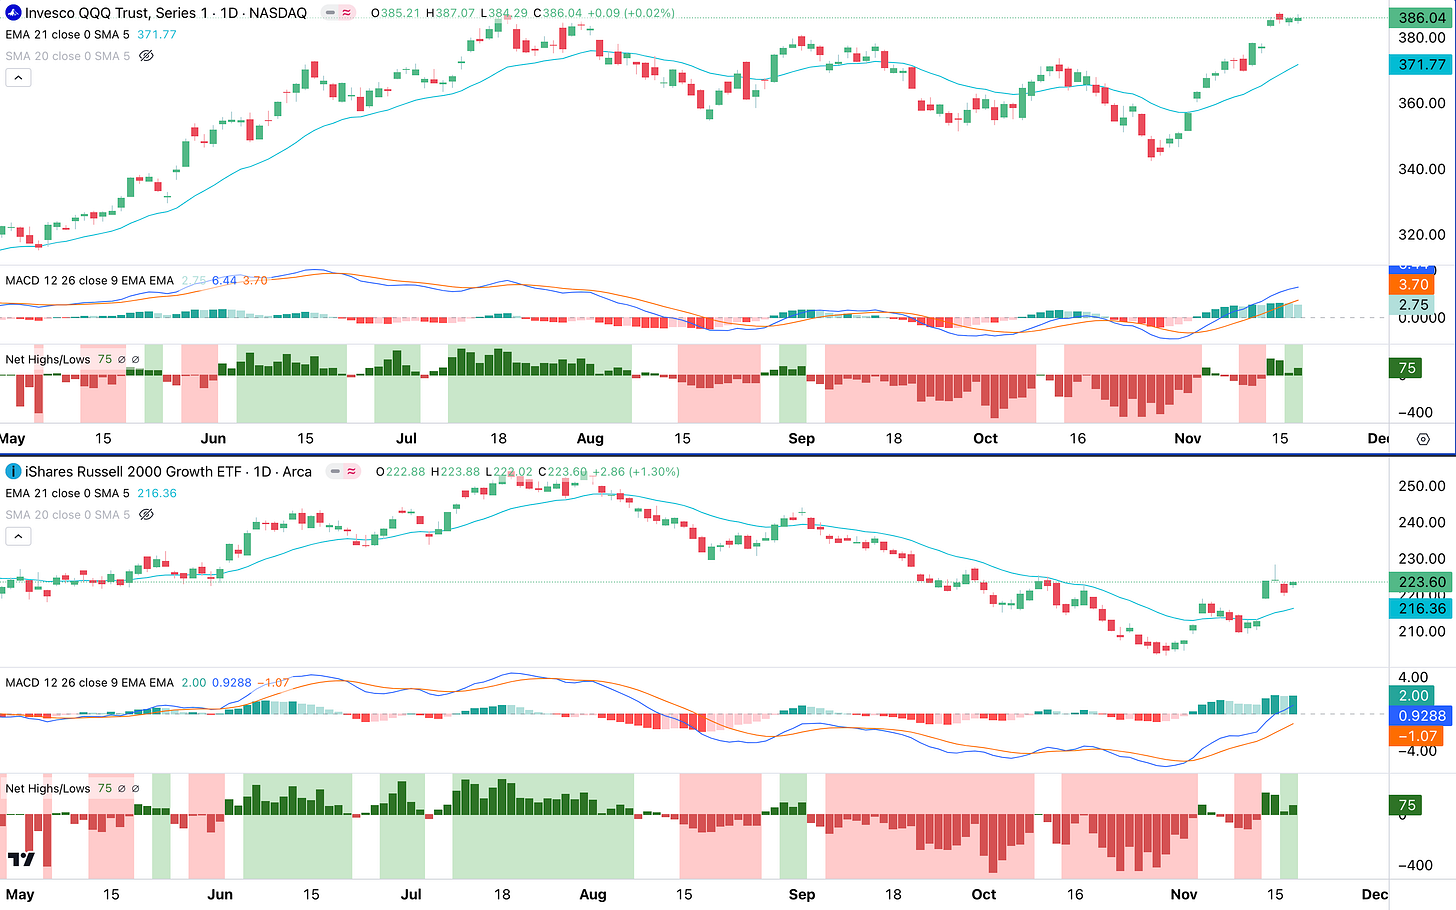
With Net New Highs coming in, and both the Nasdaq 100 (QQQ) and the Russell 2000 Growth Index (IWO) showing strong momentum (price above 21 EMA & MACD over 0), a Swing Trader’s Market is now here and we could expect traders to be in “buy every dip” mode.
Now that the Russell 2000 Growth (IWO) is in a Swing Trader’s Market, it is an opportune time to create a watchlist of small-cap stocks for the “January Effect”. According to the Stock Traders Almanac, after tax-loss selling is over, small caps tend to outperform large cap stocks from mid-December, through January and into the end of February. We noticed hedge funds accumulating small-cap positions in last week’s article. They could be positioning themselves for a small-cap run, fueled by lower rates. Small-cap companies are heavily reliant on debt financing to fund operations and growth, thus lower rates could really help their business in many ways.
Where Do We Go From Here?
Momentum and breadth are strong, but we are overbought and Market Makers are collecting short positions. So where do we go from here?
Most Bullish Scenario: The market could continue higher in the rising channel on the 2-hour chart. If this occurs, it continues the lockout rally character of the market.
Still Bullish Scenario: The market could pull back to the 5-day Exponential Moving Average (black line) at around $448 or the 8-day Exponential Moving Average (pink line) at around $445. This type of pullback would be very welcomed by traders, who could use this opportunity to load up and enter at better prices.
Weaker Scenario: We could get a pullback to the 20-day Simple Moving Average (blue middle line) which could form a confluence zone with a 50% Fibonacci Retracement at around $430. Given the buying demand, this scenario is a low probability.
I do believe all scenarios lead to a continued uptrend for the reasons we’ll discuss in the next section. But first, how high can we go? Looking at the weekly chart of the S&P 500 below, the R1 Fibonacci Pivot Point at $454 and the Upper Bollinger Band at $462 look like key levels of interest, where resistance (sellers) could show up. If momentum is strong enough, the SPY could fight through these levels and continue upwards to the R2 Fibonacci Pivot Point at $485 by the end of December.
Does the Rally Continue?
The rally likely continues for now because the market is still eating the bears. There are still too many put options in the system and if the market drops, they would make money. We know that the Market Makers are in the business of making money, not paying the Little People, so my bet would be that the rally continues until puts are flushed out of the system.
Furthermore, Market Makers make money on orders, and as long as there are people buying long positions, Market Makers will allow that to happen because they make transaction fees. When orders dry up, they would drop their bids to see if there are any new orders at lower prices. Looking at the Fear & Greed Model below, we can see that greed is starting to heat up and everyone is buying. If you were the Market Maker, would you disrupt that stream of fees? Probably not, so I don’t believe they will drop their bids (drop prices) drastically and spook the market.
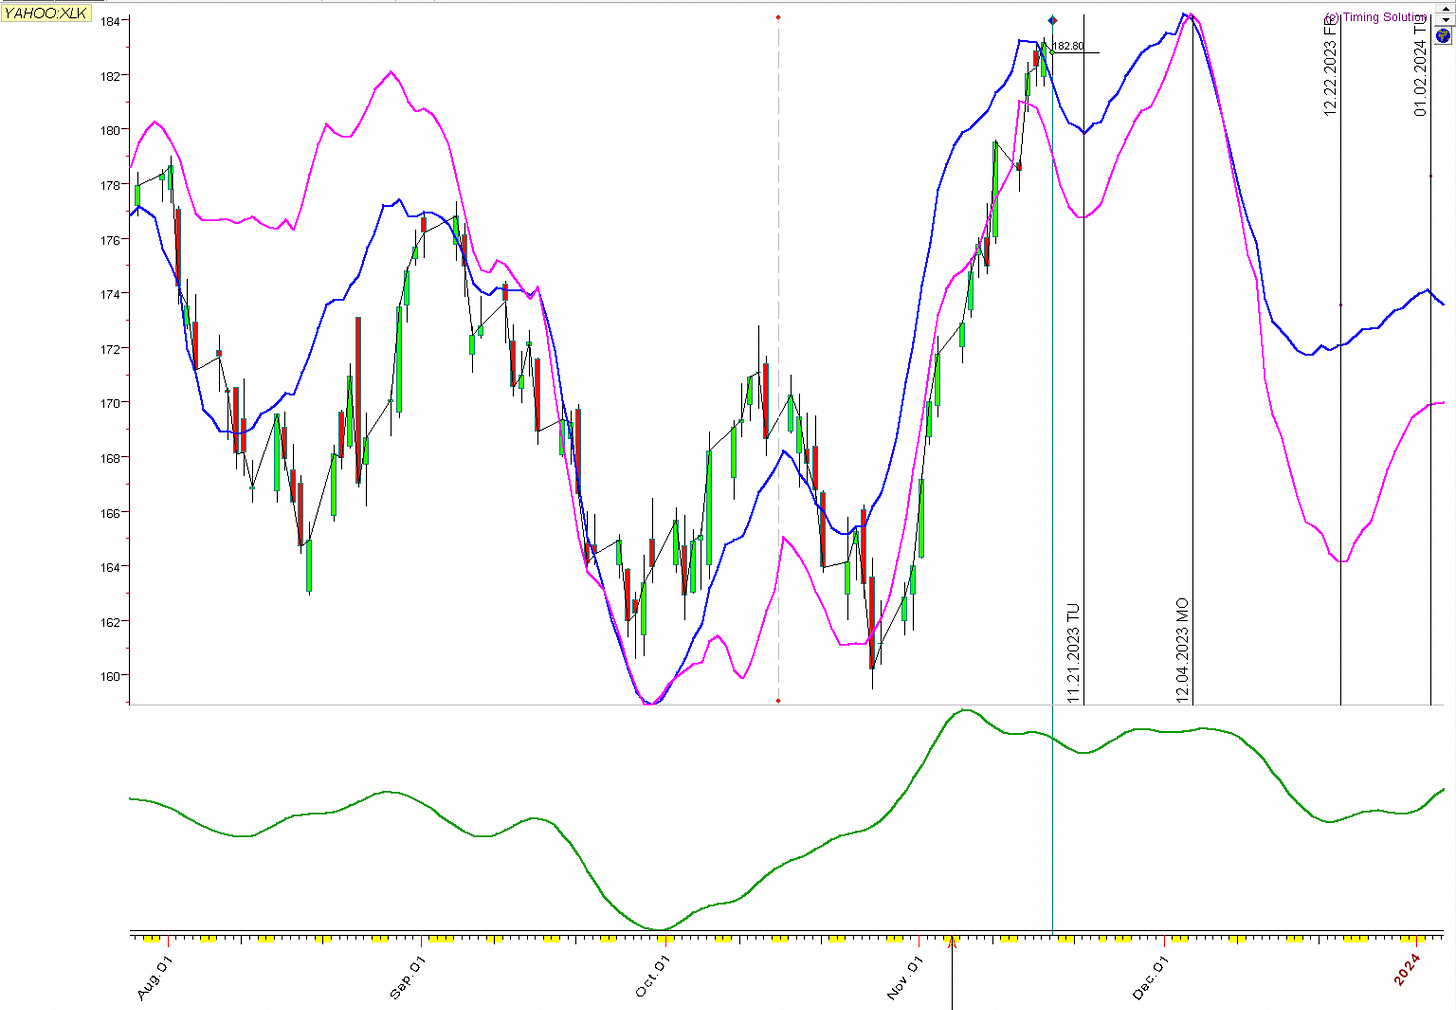
It is also too early in the uptrend to reverse direction. Cycle analysts know that the “Daily Cycle” tends to last between 35 to 45 days (approximately 25 to 32 trading days). That brings us a range from December 1st to December 11th for a more sizeable pullback. The cycle chart for XLK below suggests a top around December 4th.
Finally, looking at the Smart Money/Dumb Money Confidence Spread we can see that there is a transition period between bull runs (“eat the bears”) and bear runs (“eat the bulls”). These transition times occur in the late stage of a trend where the Market Makers and Smart Money position themselves to benefit from the upcoming change of trend. Since this transition time has yet to occur, it leads us to believe that the bull run has more in the gas tank.
Conclusion:
Our analysis leads us to believe that the uptrend still has some more upside to go before a pullback, which we believe could occur around December 4th. That does put the odds in favor of a Thanksgiving rally!
So here is how the Oliver Twist dialog could go in terms of this rally:
Oliver Twist (Investors): Please Sir…I want some more rally.
Mean Fat Guy (Market Makers): Well…as long as I am making money on transaction fees…sure why not? I am still eating the bears anyway, but when my supply of bears is done, you bet I’ll go bull hunting at some time in the future.
Disclaimer - All materials, information, and ideas from Cycles Edge are for educational purposes only and should not be considered Financial Advice. This blog may document actions done by the owners/writers of this blog, thus it should be assumed that positions are likely taken. If this is an issue, please discontinue reading. Cycles Edge takes no responsibility for possible losses, as markets can be volatile and unpredictable, leading to constantly changing opinions or forecasts.


