


Reversal Signs Rack Up
Premium Section: TLT, XLP & NVDA Setups

As the stock market heads higher, reversal warnings are piling up. Notice that as the S&P 500 (SPY) trends higher, the McClellan Breadth Oscillator trends lower showing a bearish divergence. Breadth divergences often precede pullbacks. The RSI indicator is also in overbought territory. The Thanksgiving Rally performed like a champ, but it feels like it is starting to overstay it’s welcome. If the uptrend line breaks, expect a pullback to the following levels:
The 9 EMA around $602
The prior high around $600
The 21 EMA around $596
The Central Pivot Point around $591
The 55 EMA around $584
The S1 Pivot Point at $579

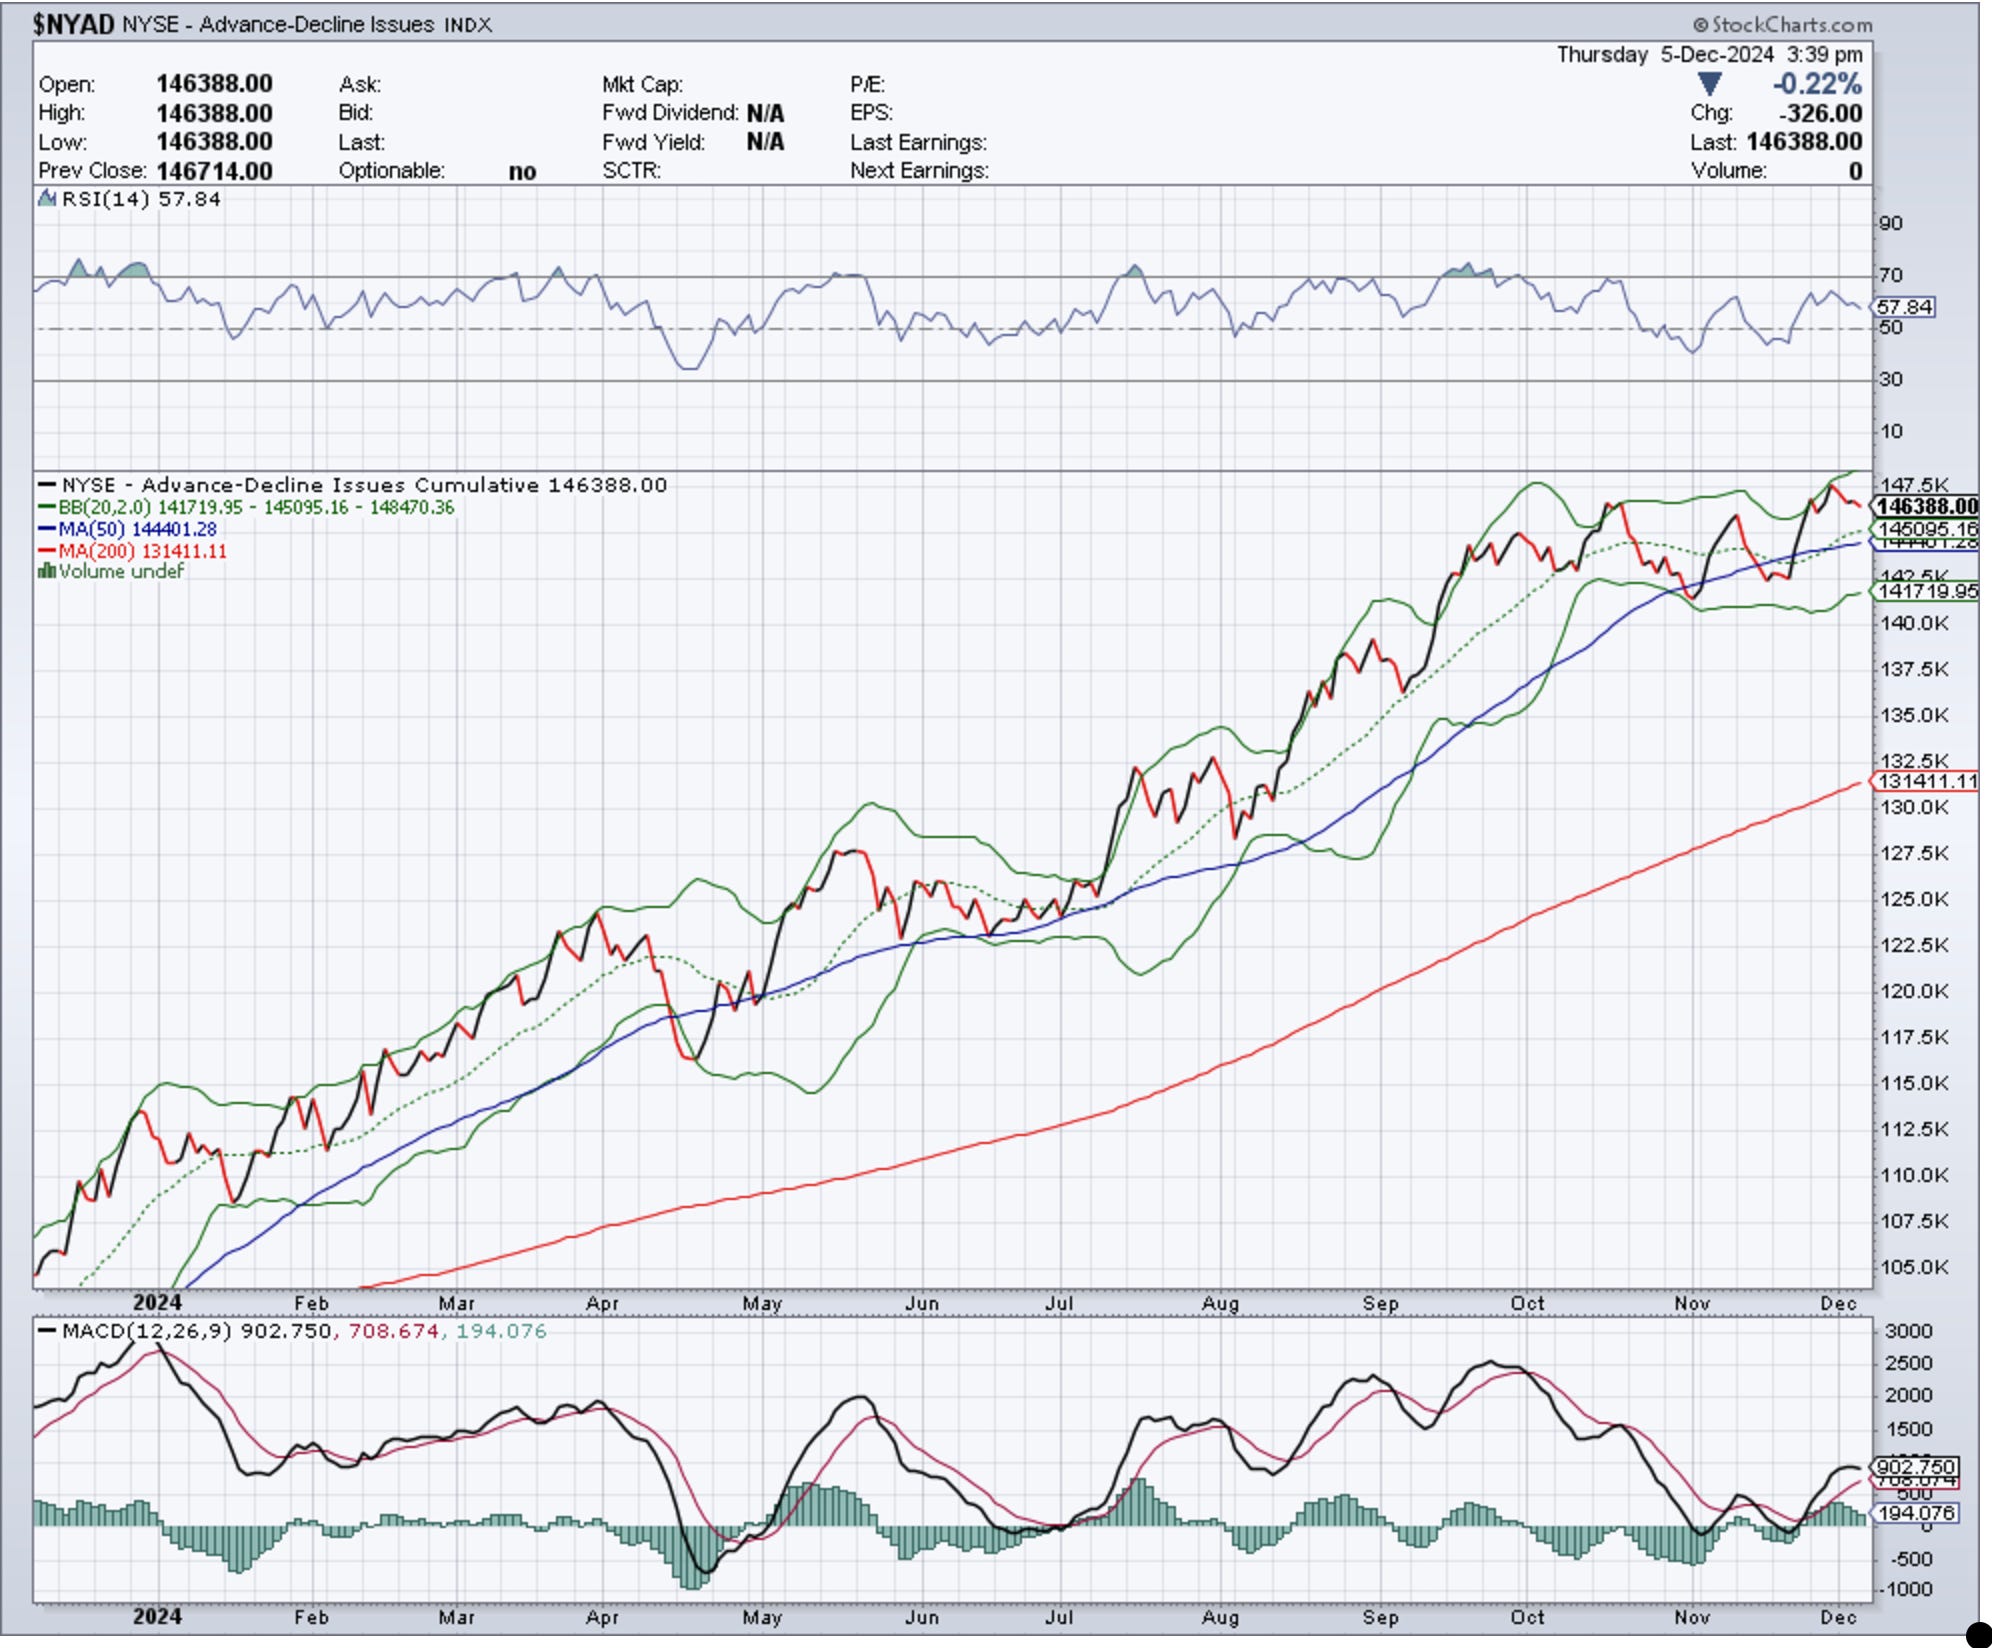
The NYSE Advance/Decline Line made a new high and hit the Upper Bollinger Band. It did what we expected and the result was a fantastic rally. Now we see it trending lower as the RSI and MACD also retreat. A normal pullback is totally acceptable, even in a bull market.
Our top Breadth Indicator is flashing a major warning. We will go over this and setups for NVDA, TLT and XLU in the Premium Section.
Disclaimer - All materials, information, and ideas from Cycles Edge are for educational purposes only and should not be considered Financial Advice. This blog may document actions done by the owners/writers of this blog, thus it should be assumed that positions are likely taken. If this is an issue, please discontinue reading. Cycles Edge takes no responsibility for possible losses, as markets can be volatile and unpredictable, leading to constantly changing opinions or forecasts.