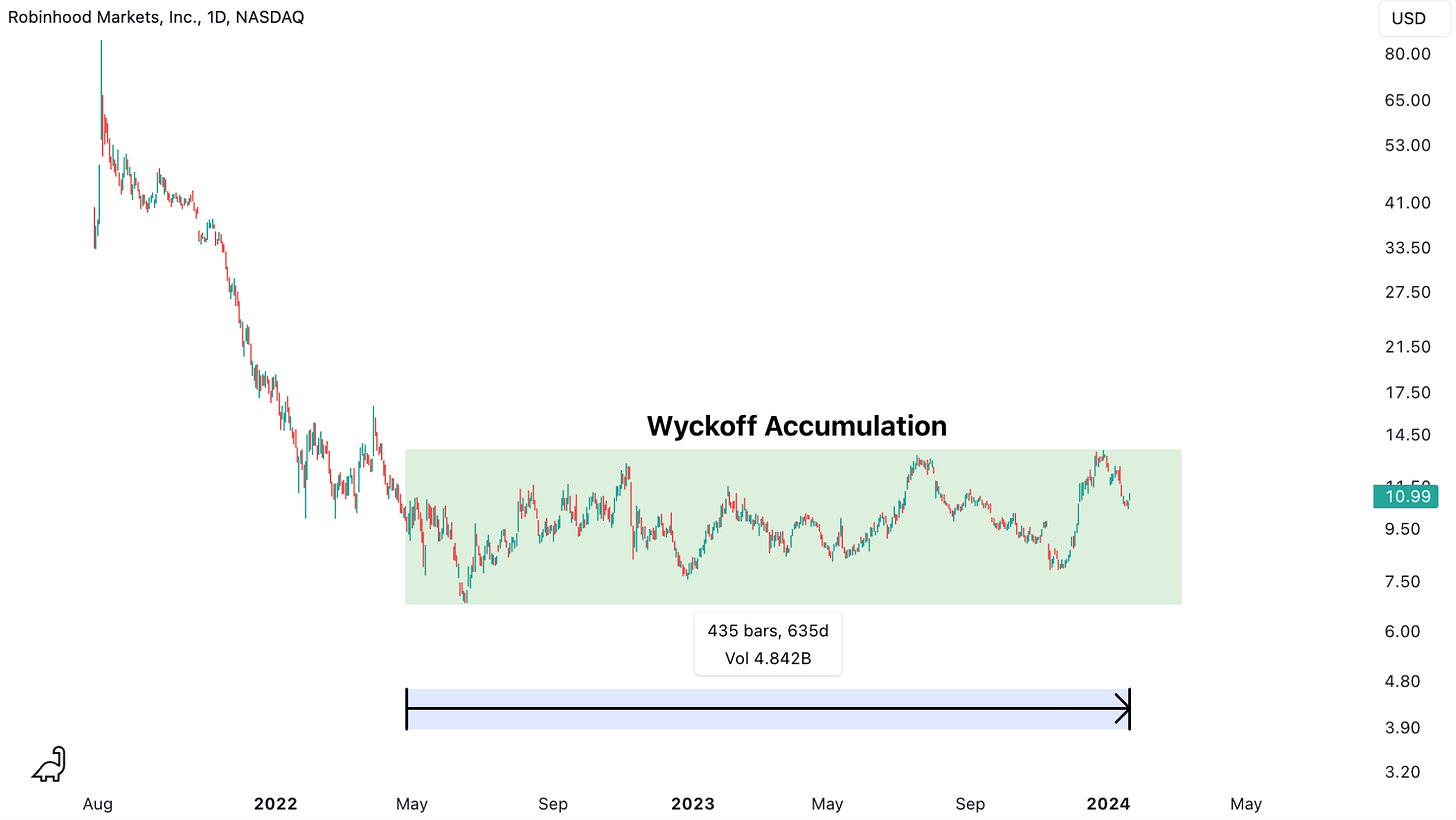
Robinhood ($HOOD) has been in a Wyckoff style accumulation range for the past 435 trading days after a sharp drawdown in late-2021 and early-2022.
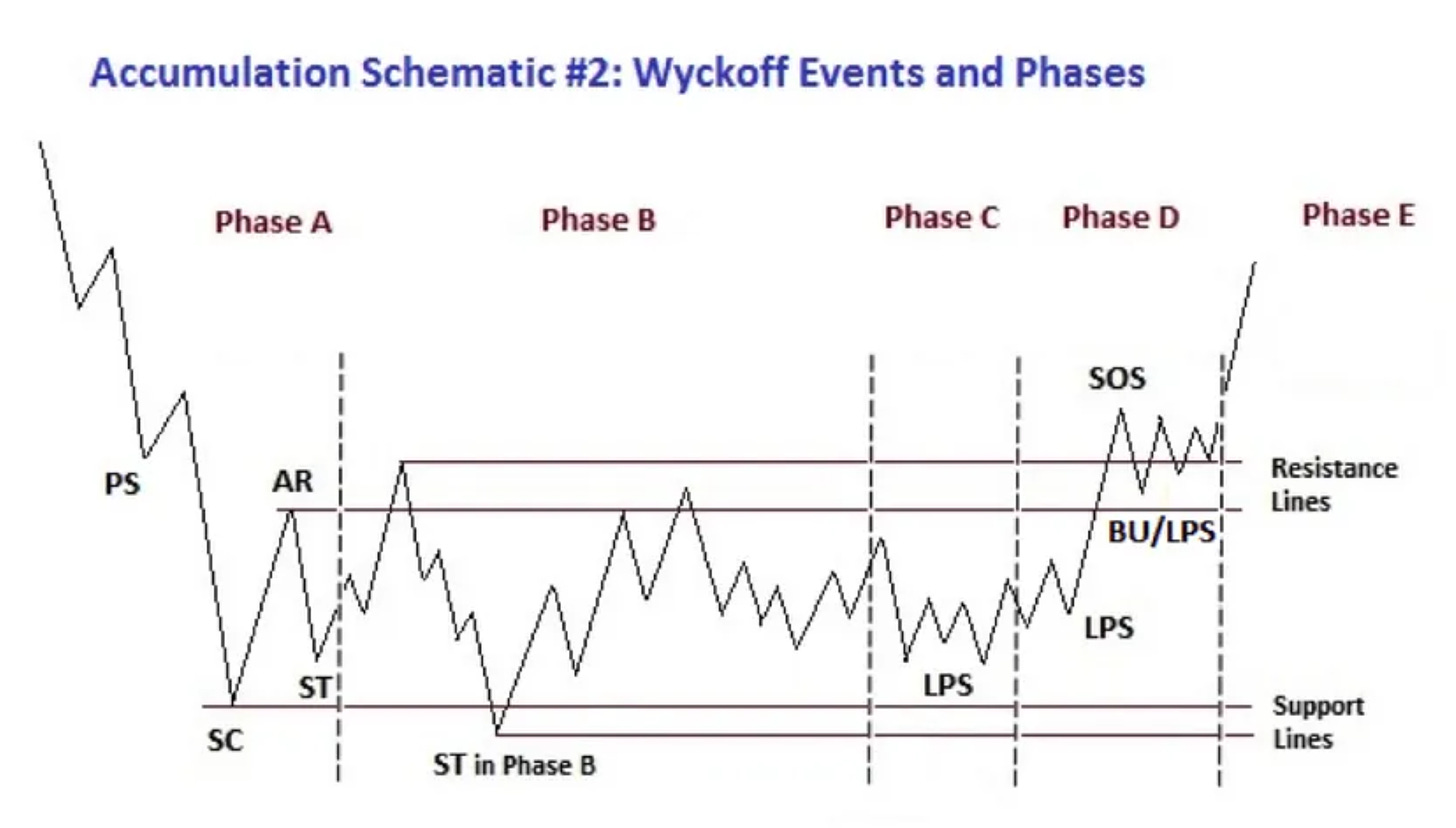
For those that are unfamiliar with this type of accumulation, please refer to the image below. Let us know in the comments below if you would like us to make an “Educational Piece” for Wyckoff accumulation and distribution structures.
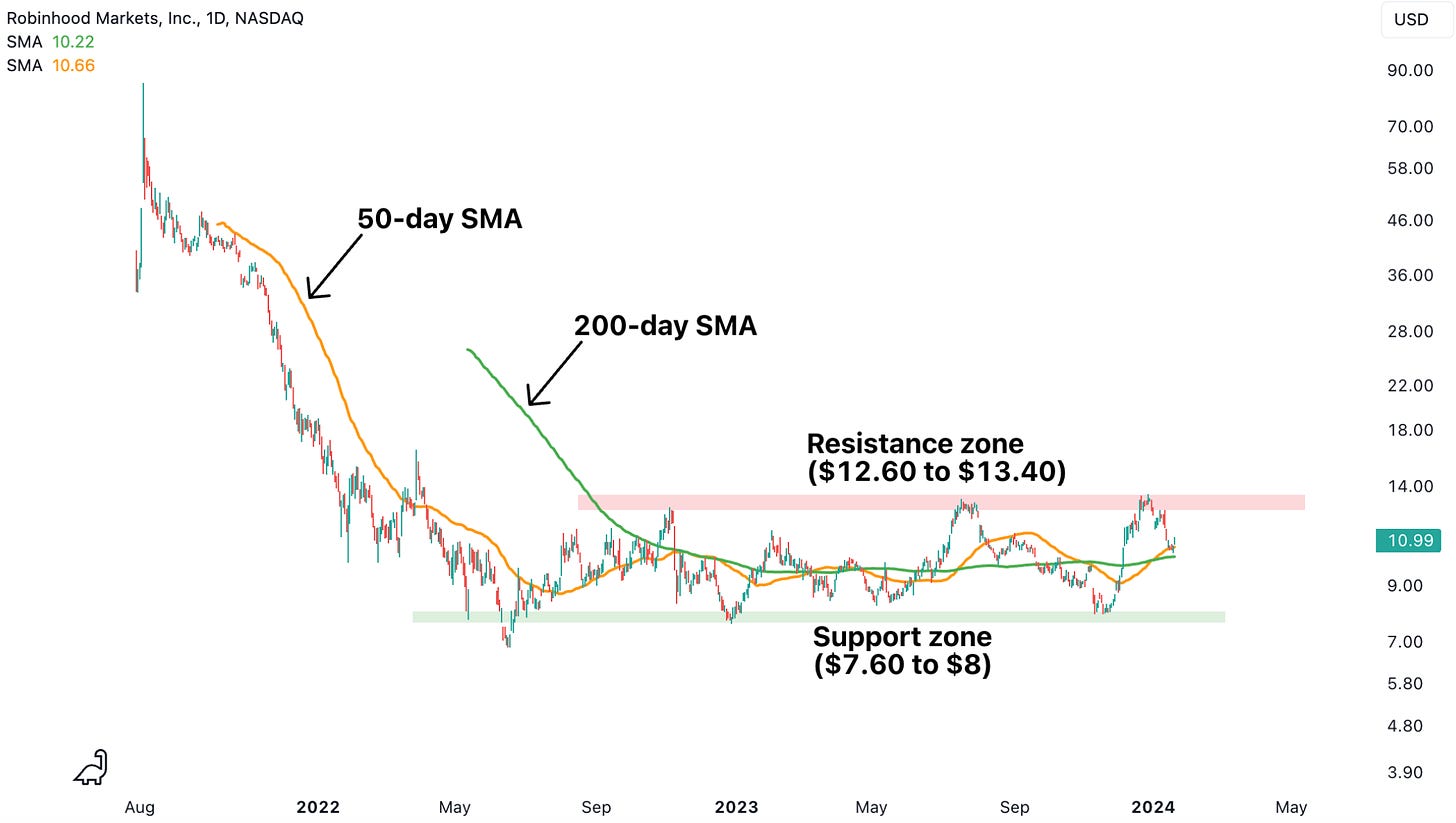
Price recently rejected in the resistance zone (between $12.60 and $13.40) but has found support at the 50-day and 200-day simple moving average. Notice how the key moving averages have also lost its downward slope – typical signs of a fading downtrend. This would be an optimal entry point with stop-loss below the support zone of $7.60 to $8 on a daily closing basis.
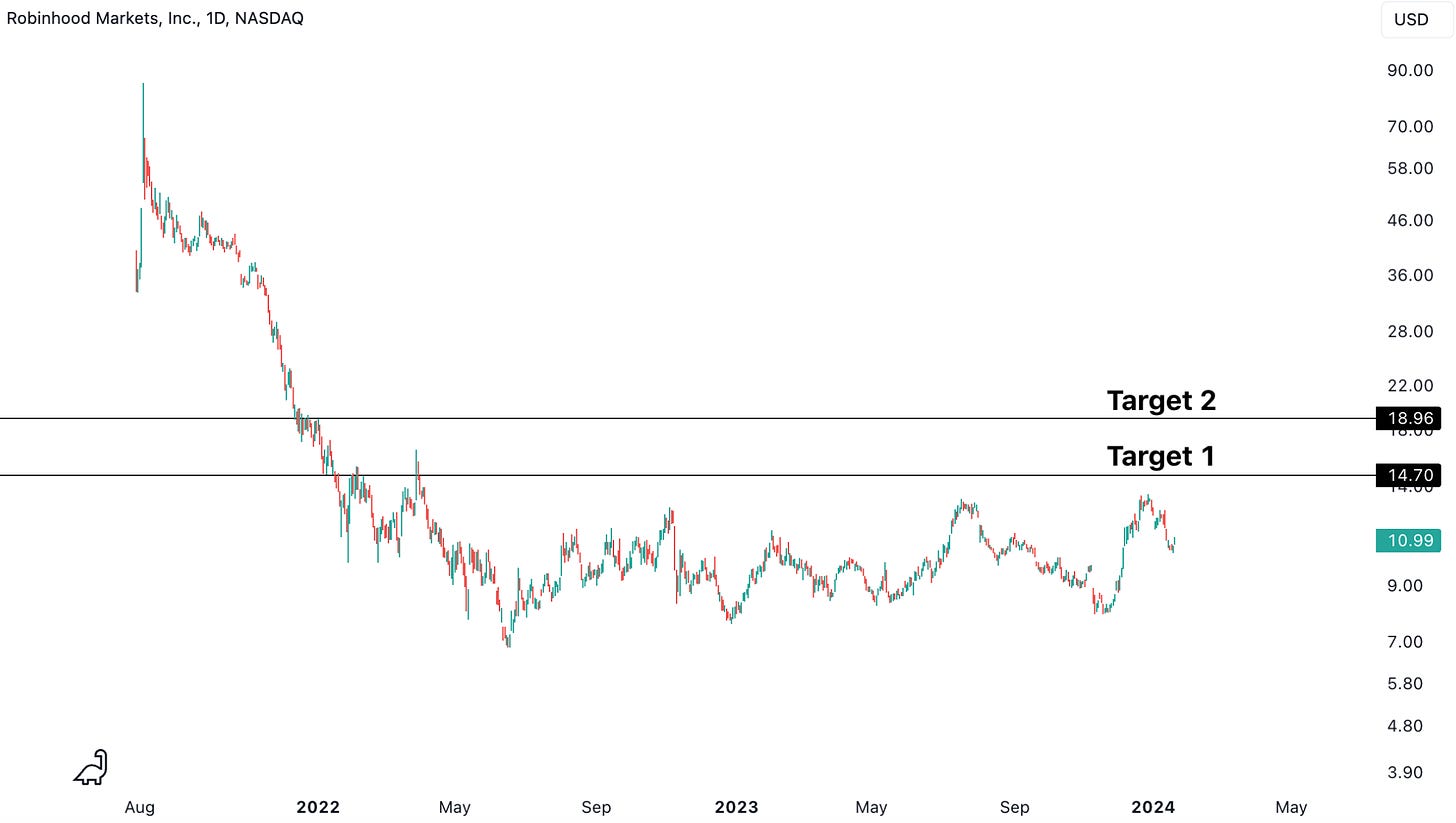
The 2 take profit targets are $14.70 and $18.96. For those willing to hold this position long-term, keep a certain % of the position open even after target 2 because a break above that level (albeit after a pullback) could result in significant upside in a quick fashion.
Feedback for the “Trade Setup” article format is much appreciated in the comments below. Until next time!
Disclaimer - All materials, information, and ideas from Cycles Edge are for educational purposes only and should not be considered Financial Advice. This blog may document actions done by the owners/writers of this blog, thus it should be assumed that positions are likely taken. If this is an issue, please discontinue reading. Cycles Edge takes no responsibility for possible losses, as markets can be volatile and unpredictable, leading to constantly changing opinions or forecasts.


