Last week the S&P 500 (SPY) continued higher by 0.36% even as technology took a break. The rally broadened out to Small Caps as the Russell 2000 (IWM) increased by 2.55%, which showed relative strength to the Nasdaq 100 (QQQ) which was down -0.53% for the week. The SPY has now been in an uptrend for 21 weeks in its Intermediate Cycle (typically 18 to 27 weeks). With rotations in both asset sizes…
…and sectors, this rally is poised to extend its climb. Note that Utilities, Energy, and Basic Materials led the rally last week as Technology had a down week. This rotation to defensive sectors does remind us that the rally is old, however, these rotations could also extend the rally. In our Premium Section, we’ll look into opportunities in Energy (USO) and Utilities (XLU), which appear to be the new leaders.
Market Conditions
The SPY continues to trend higher above the 10 (pink) and 21 (blue) EMAs. Until the 21 EMA is broken to the downside, it should be assumed that the uptrend continues. The Relative Strength Indicator (RSI) is on an uptrend, which is bullish. The Advance/Decline Line (ADL) breadth indicator continues higher supporting this rally. The McClellan Oscillator is positive, further confirming the current strength in breadth. Note that the SPY started a new cycle bracket on 3/28. If the uptrend continues, we could expect it to continue until late in the half-cycle. In other words, expect early strength but some weakness in late April/early May.
Both Smart Money and Dumb Money are buying every dip right now, which gives this rally persistence.
The Put/Call ratio shows a spike in put buying recently. This was probably driven by the recent increase in inflation and the high amount of Fed Speak over the last 2 weeks. This could be Trap Fuel for the market to go higher (people buy puts, the market doesn’t want to pay them and the market goes up instead of down).
Other Indexes
The Russell 2000 (IWM) took the lead last week as the rally broadened out. A new cycle bracket begins on 4/4, so if the rally continues, the next bout of weakness could be expected in early May. IWM is following a channel pattern so look to buy near the lower channel line. The up-trending RSI indicator confirms strength in IWM.
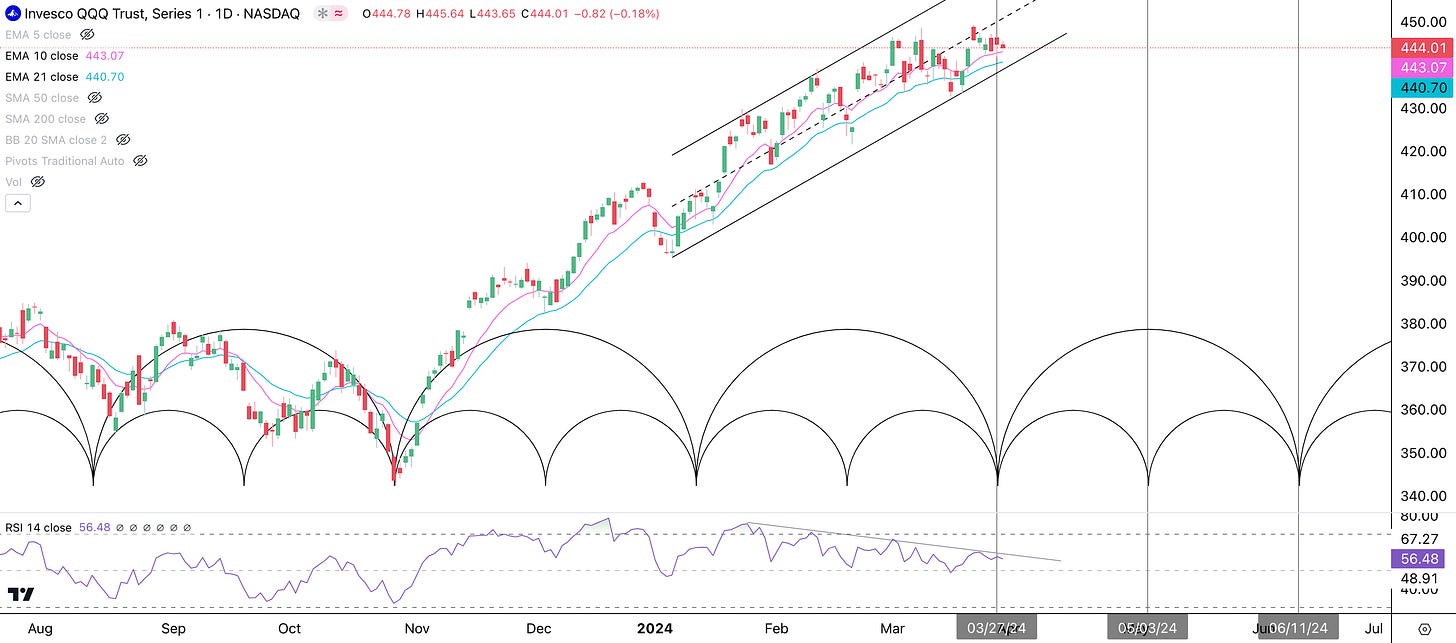
The Nasdaq 100 (QQQ) already had a stellar run but is showing signs of fatigue. It declined last week as the SPY and IWM rose. Under the surface, the AI leaders such as NVDA, and SMCI took a break, however, don’t count them out yet. They may be setting up for another run. QQQ started a new cycle bracket on 3/27. There is the possibility for this to be a negative cycle, however it could easily bounce back if NVDA does. QQQ is highly correlated to Semiconductors as 3 of the top 10 holdings are semiconductor stocks comprising 12.4% of the index. The RSI indicator is down-trending, but is still above 50, which is bullish. Keep an eye on QQQ.
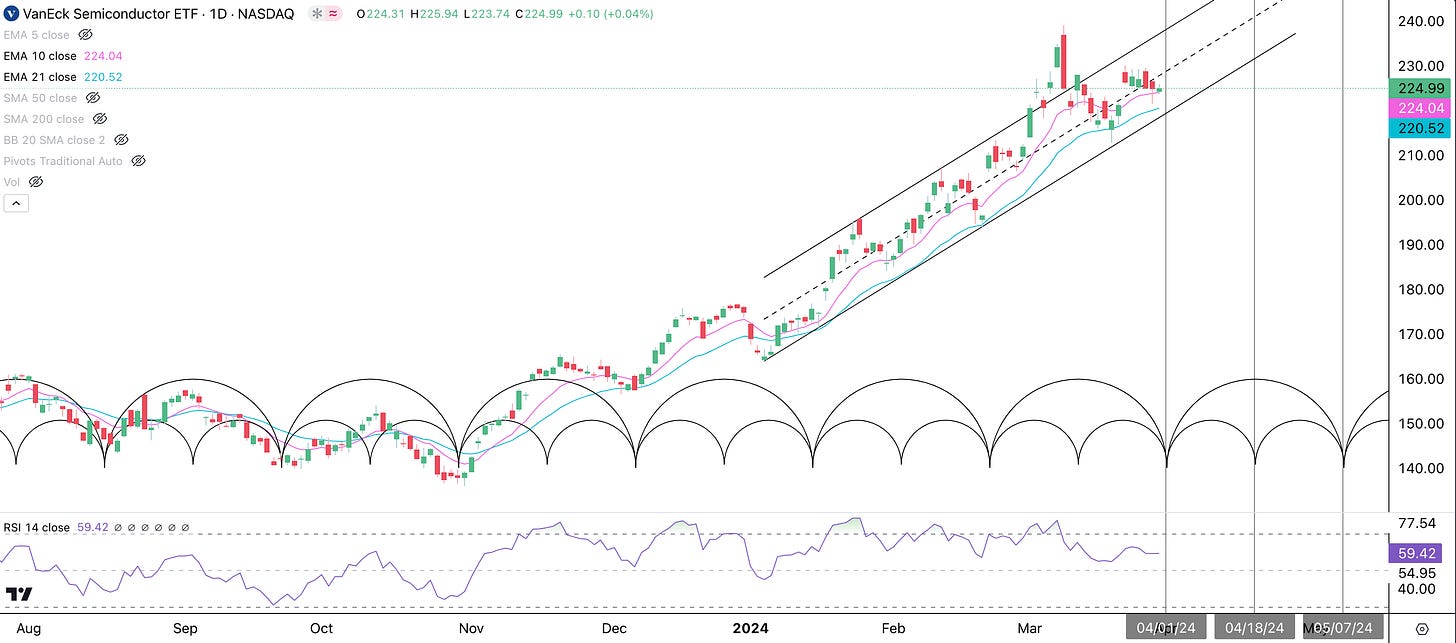
The Semiconductors ETF (SMH) appears to be resting on the 10 EMA in an orderly fashion. Even though it slipped 1.16% last week, it could be setting up for another run higher. A new cycle bracket begins on 4/1, so if it is a positive one, strength could persist until the middle of April. The RSI indicator appears to be working off overbought conditions but is still bullish above 50. Buying pressure could easily return in the next cycle bracket, beginning 4/1. A resurgence of strength in SMH and QQQ could bolster the Spring Rally.
Conclusion
The saying “Trend is Your Friend Until the End” holds true now. Asset and sector rotations, increasing breadth, and an up-trending Relative Strength Index (RSI) for the SPY point to a higher probability that the rally continues. Using cycles, we know that the Intermediate Cycle could have 4 to 6 more weeks left before it corrects or pauses. Our Cycles Composite (blue), Energy Cycle (pink), and Seasonal Cycle (green) point to a rally in April despite some early chop.
If you are interested in seeing our Q2 2024 Cycle Forecasts for Indexes, Sectors, Cryptocurrencies, Commodities, or the Magnificent 7 & Other Leader Stocks you can check them out here: https://cyclesedge.com/
For paid subscribers, we’ll go over opportunities in Oil (USO) and Utilities (XLU) in the Premium Section.
Disclaimer - All materials, information, and ideas from Cycles Edge are for educational purposes only and should not be considered Financial Advice. This blog may document actions done by the owners/writers of this blog, thus it should be assumed that positions are likely taken. If this is an issue, please discontinue reading. Cycles Edge takes no responsibility for possible losses, as markets can be volatile and unpredictable, leading to constantly changing opinions or forecasts.


