If you are a relay racer and you are done with your leg of the race, what do you do? Pass the Baton!
If you are a WWE Wrestler in a tag team match and just got beaten to a pulp, what do you do? Tag in your partner!
The leaders of the November rally were Large Growth stocks and more specifically the Magnificent 7 (AAPL, AMZN, GOOGL, META, MSFT, NVDA, TSLA). With the exception of TSLA, they did a spectacular job leading the S&P 500 up 11% and the Nasdaq 100 up almost 14% from the October low. They do appear to be running on fumes now as their upward trajectory slows. However, the rally seems to be in good hands as they passed the baton to…Mid-Cap stocks.
You can see from the table below that last week, Mid-Cap Momentum (XMMO) and Mid-Cap Growth (IWP) stocks were up over 2%, while Mid-Cap Value (IWS) was up 1.58%, outpacing the Nasdaq 100 (QQQ) up only 0.92% and the greater market as the S&P 500 (SPY) was up only 1.13%.
We are also seeing money rotating into different sectors. You can see from the graph below that the Energy, Healthcare, and Consumer Cyclical sectors led the way and they took the leadership baton from Technology and Communication Services. This broadening out effect, can prolong the stock market rally.
Will the Rally Continue?
I believe that there is an opportunity to Make Money into the year-end and possibly beyond. Our cycle forecast for the S&P 500 points to slightly more upside until December 3rd to December 6th, at which point a pullback is possible. That pullback could bottom around December 13, which could be an excellent buying opportunity for a rally into the beginning of January.
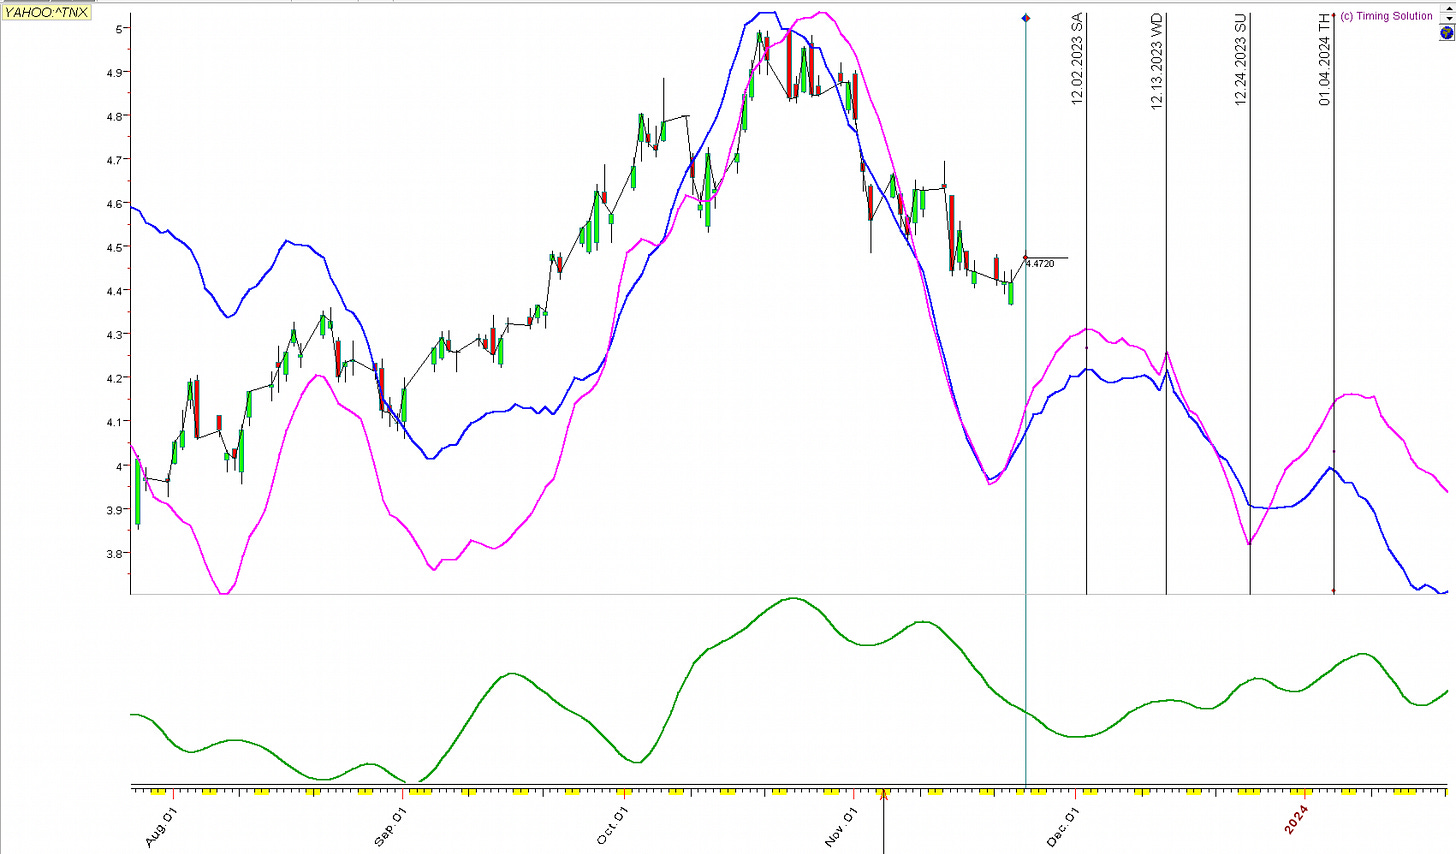
Our cycle forecast for the US 10-year Treasury rate (TNX) leads us to believe that weakness in the Nasdaq 100 and big tech may continue as the TNX rises. As rates rise, it compresses price-to-earnings ratios, and growth stocks tend to have high valuations. However, rates are forecasted to drop around 12/13 and this may be the time when the Magnificent 7 and the Nasdaq 100 (QQQ) wake up and re-take leadership.
The S&P 500 (SPY) continues grinding higher and as money rotates into different areas (smaller stocks and non-technology fields) this grind higher could continue. It is possible that the early December weakness our cycles are forecasting could be a sideways consolidation. SPY continues higher trending above the 8 Exponential Moving Average (pink line) in a lockout rally fashion and the RSI indicator does not show bearish divergence yet. It is also above the Ichimoku Cloud. Note - when price is below the cloud, the cloud serves as resistance, and when price is above the cloud it serves as support. Traders who are looking to jump on board could buy on intraday weakness and set a stop loss order under the 8 EMA, under $451. The likely December 4th target is $460. It could also be a good idea to protect profits before December 3rd, as our cycle forecasts predict weakness beginning around that time.
Looking at the weekly chart of SPY, we can see that it is in a cup and handle pattern. If this pattern is completed, the price could reach the weekly Fibonacci Pivot Point of $535 or greater. It would probably take many months for SPY to reach this level.
Market Internals
This is still not an old uptrend, so there is room to run. The Risk-On/Risk-Off Indicator just turned Risk-On on 11/15 and is currently at 71. With all the buying and rebalancing going on, it is a reasonable expectation for this to hit the 90 mark, similar to the Summer rally.
The McClellan Summation Index, a slower-moving breadth indicator, is in an uptrend and just crossed 0. If above the 500 mark is the “overbought zone”, this has a way to go. But to keep the rally going it seems like we’ll need a rotation of leadership because…
…the Bullish Percentage of Nasdaq 100 stocks seems to be slipping as the Relative Strength Indicator (RSI) is overbought. This could pull back or catch up to the 10 Simple Moving Average (blue line below) and start another leg higher. Alternatively, this could keep falling, but time will tell.
The New York Stock Exchange (NYSE) McClellan Oscillator appears to be resetting and catching its breath on the Bollinger Band Midpoint (blue dotted line in the chart below). Note that this indicator is a broader-based indicator consisting of large, mid, and small-cap stocks. A leap forward is completely possible next week and that could bring more gains for stock market participants. The question is: who benefits? Mid-cap growth stocks are poised for more upside. We’ll have to see if large-cap growth and the Magnificent 7 could find their legs again.
Revisiting this chart, the Retail-Only Put/Call Ratio still shows that there are many put options to be washed out of the system, although this process has begun. This should give us confidence that the market will not drop drastically and has a much greater chance of more gains until this indicator gets below the red line and has a transition period, followed by a trend change. When this indicator begins rising from below the red line, it will be the right time to go into capital protection mode.
There is a concern that greed is spreading quickly. Nonetheless, the Fear/Greed indicator has yet to hit extreme greed levels, so there should be more to run. Similarly, this indicator usually has a transition period before a trend change. You know, the Big Boys like to position themselves in the other direction before a rug pull drop or a face-ripper rally. The sideways action at extremes is indicative of the Big Boys’ repositioning. I want to mention that the main goal of this blog is to help us, The Little People, make money in the market and not fall victim to the Big Boys’ tricky manipulations.
Smart Money doesn’t seem so smart these days. They have missed out on the biggest rallies this year, while Dumb Money appears to be riding uptrends to profits. Perhaps Dumb Money is more financially educated than in the past and free trading equalized the playing field. Nonetheless, Dumb Money is profiting off this rally as Smart Money sits out again. I expect to see Dumb Money spend some time in the overbought area (see the circles in the chart below) as the uptrend continues. During those times, Smart Money may not feel so smart.
Supportive Intermarket Dynamics
The Intermarket picture looks supportive of a continued uptrend in stocks. The 10-year Treasury rate (TNX), US Dollar (DXY), and VIX are all in downtrends below their 10-day Simple Moving Averages (SMA). When the aforementioned three go down, stock prices have a tendency to trend higher.
Enough with the Analysis Paralysis Already! Could We Focus on Making Money?
Let’s use seasonality to guide investment selection. Here are a few investment ideas that historically outperform in December. Note that the stock charts included below comprise the daily chart on the top and the weekly chart on the bottom. The daily chart is useful for trade management, while the weekly chart shows broader trends and longer-term profit targets. Also note that in the future these setups will be for Paid Subscribers.
Mid-Cap Value ETF (IWS): Mid-Cap Value stocks showed relative strength to the SPY and QQQ last week and according to its seasonality chart relative to the S&P 500 this should continue throughout December:
On the daily chart (upper chart below) IWS popped above its 200-day Simple Moving Average and Ichimoku Cloud last week. It has been trading above the downtrend line and has been surfing the 5 and 8-day Exponential Moving Averages (black and pink lines). This is a picture of a new uptrend, where it is not yet obvious and thus is not too late to enter. One could buy IWS and set a stop loss order below the 8 EMA at around $106. Short-term targets are at $111 and $115. On the weekly chart (lower chart below) the 2021 high of $122 could serve as a longer-term target.
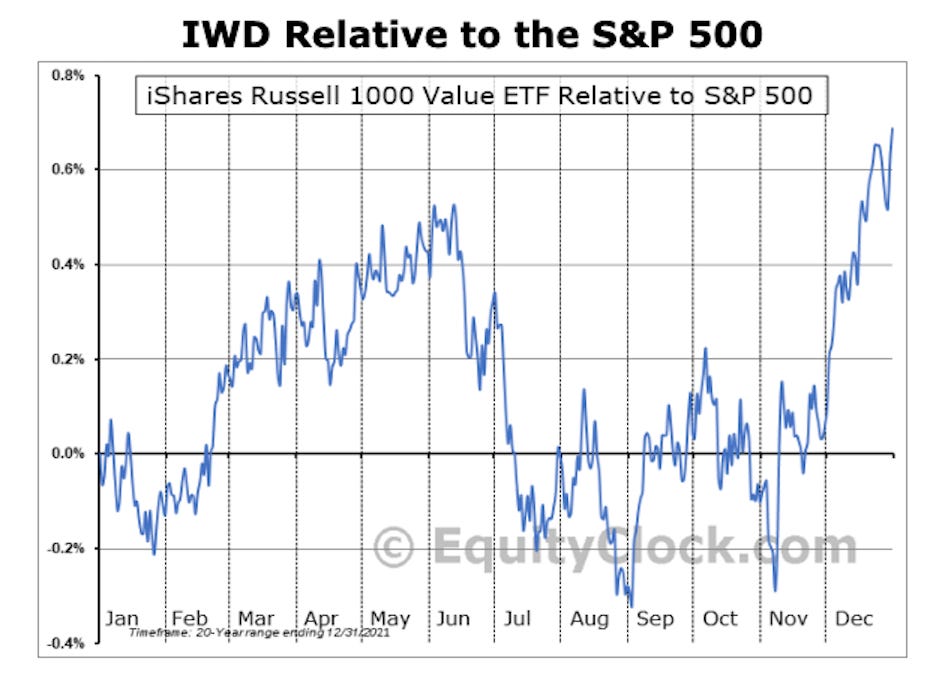
Large-Cap Value (IWD): Large-cap value also looks ready to run as the growth leaders take a rest. Seasonally, value does well in December too.
IWD is above the cloud and all moving averages on both the daily and weekly charts. It is not as extended as large-cap growth and technology, so this asset class could follow the leaders to higher prices. Portfolio managers who want to participate in equities, while keeping volatility reasonable could be attracted to large-cap value stocks. Traders could buy some IWD with a stop loss order below the 8 EMA around $154. Short-term targets are at $160 and $164. The longer-term target sits around $171.
Materials ETF (XLB): The Materials Sector has bullish seasonality from November to January. On the daily chart, XLB showed early strength and broke above the Ichimoku Cloud and the downtrend line. One could buy XLB, and set a stop loss order below the 8 EMA around $79. Short-term targets could be $84 and $86 and the longer-term target could be $89.
XLB also has relative strength to the S&P 500 in December:
Real Estate: Real Estate tends to have a very strong December:
However, due to high interest rates, real estate has had a tough year. The setup for XLRE looks decent on the daily chart. Seasonal strength could help price break above the 200 SMA and the downtrend line. XLRE being under the Ichimoku Cloud on the weekly chart is discouraging. It is possible that XLRE surfs the 8 EMA through the weekly Ichimoku Cloud. If traders want to take this risky play, use a stop below the 8 EMA and look for $39 and $42 to be profit targets. The key to this trade is to see how price reacts to the weekly Ichimoku Cloud. It’s seasonality vs. resistance. Let’s see which one wins.
Conclusion
I expect the rally to grind higher next week, led by mid-caps, value, and non-technology sectors. This rotation is needed as large-cap technology leaders take a break. Under the surface, the breadth, volatility, and Intermarket dynamics are quite bullish. A pullback is possible around December 4th, and this could be a good buying opportunity for the next leg higher, which could start from December 13th to 22nd. Let’s hope we all have happy holidays!
We are working on providing cycle forecasts for the major asset classes, sectors, cryptocurrencies and commodities. Stay tuned and we’ll share more information about this project as it develops.
Disclaimer - All materials, information, and ideas from Cycles Edge are for educational purposes only and should not be considered Financial Advice. This blog may document actions done by the owners/writers of this blog, thus it should be assumed that positions are likely taken. If this is an issue, please discontinue reading. Cycles Edge takes no responsibility for possible losses, as markets can be volatile and unpredictable, leading to constantly changing opinions or forecasts.


