


Sentiment seems to be the driving power in the markets this year and probably edges out economics.
Sentiment Power Pushes the Market
This current rally is possible because sentiment got too bearish and when one side of the market gets too confident, the market makers flip the script. The Bull/Bear Ratio below hit it’s most bearish point on 1/13/25 and that market the bottom of the January 2025 pullback.

Dumb Money almost hit an oversold low and ripped back the other direction. Dumb Money can push this market higher before it gets overbought.

The Fear & Greed Model also touch the Fear extreme and reversed. This also has room to run before it gets to the Greed extreme.

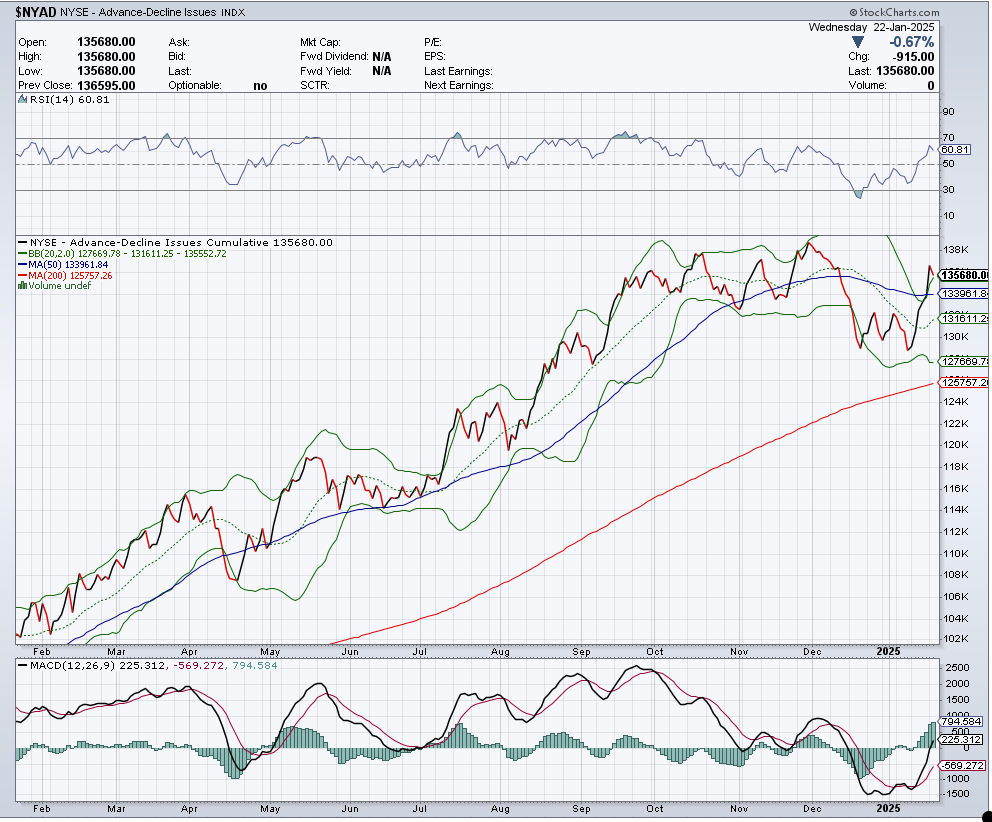
Breadth Needs a Breath
We should not expect the market to go up in a straight line however. The McClellan Breadth Oscillator is overbought and may need to recharge before making another leg up.

Similarly the NYSE Advance/Decline Line exceeded the Upper Bollinger Band and now appears to be pulling back. With RSI not yet oversold and MACD showing bullish momentum, a buyable pullback is possible.
ETF Levels to Watch
Given our Cycle Forecast (discussed later), we don’t expect the market to fall apart. We do expect a pullback to a moving average, which would provide a buyable pullback. You can see from the chart below that the S&P 500 is stretched from the 5 SMA (black), 9 EMA (pink) and 20 SMA (blue). It is highly likely that a pullback to one of these moving averages will find buyers who were too slow to buy the first leg up. Here are the levels to look for buying strength:
5 SMA = $598.30
9 EMA = $595.60
20 SMA = $592.17

It’s a similar look for the Nasdaq 100 (QQQ). Look for a pullback to these levels:
5 SMA = $521.57
9 EMA = $519.72
20 SMA = $518.00

The Dow 30 (DIA) also looks ready to pull back to a moving average. Notice the doji candlestick today, telling us that the trend ran out of gas for now. Look for buying opportunities at these levels:
5 SMA = $435.98
9 EMA = $433.23
20 SMA = 429.07

The Russell 2000 (IWM) appears to be leading the way down and had a down day while the other indexes had positive days. This is known as Index Divergence and tells us that strength is waning. Here are the key buying levels on the IWM:
5 SMA = $226.41
9 EMA = $224.94
20 SMA = $222.84

On Thursday Initial Jobless Claims come out at 8:30 AM and President Trump speaks at 11:00 AM. On Friday Global Manufacturing PMI comes out at 9:45 AM. These events could move the markets and provide the dip that we are looking for.

Cycles Support Further Upside
Let’s analyze the SPY using our Cycles SMA setup. We can see that the 125 SMA (royal blue) held as support and since 1/13/25 the SPY bounced from the Lower Bollinger Band (gray) to near the Upper Bollinger Band. We consider this $607 to $609 area the first target. As SPY is stretched from it’s moving averages a pullback to the moving averages is the rest we’ll need for a possible run to the R2 Pivot Point at $620 which is our second target. We believe that if this occurs, it will occur before 2/10/2025 as the cycle bracket begins to decline at that point and that often brings profit-taking. The CCI is not yet overbought and the Money Flow Index just crossed the 50 mark, which confirms bullish momentum.

Our Cycle Forecast for the S&P 500 is shown below: