Technicals vs. Cycles
Setups for NVIDIA (NVDA), Costco (COST) and Microsoft (MSFT)
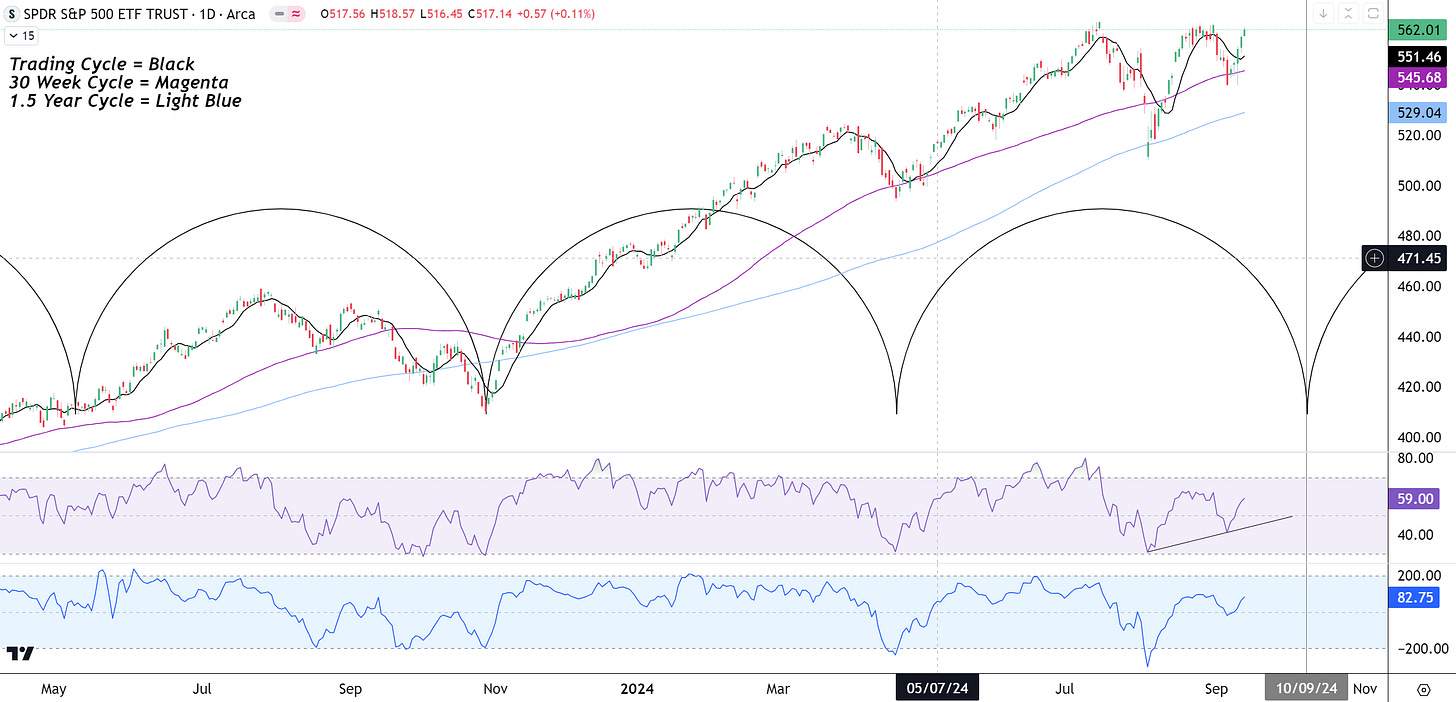
Technicals are bullish and cycles are bearish. Using the Cycle Simple Moving Average (SMA) technique we can see that the S&P 500 (SPY) bounced 4% last week and is now back above the Trading Cycle EMA (black). This is the shortest cycle and tells us that the short term trend is up. We can also see that a double bottom was formed right on the 30-Week Cycle SMA (magenta). The August 5th low bounced off the 1.5 Year Cycle SMA (Light Blue), and the higher low pattern is actually quite bullish. With the RSI (indicator with purple background) in an uptrend above the 50 mark after forming a higher high, the uptrend has strength. The CCI (indicator with blue background) is above 0, telling us that the SPY is in an uptrend once again. Overall, the technical picture points to new highs.
The Primary Cycle Bracket above hints that it is a bit early for a bottom, as a bottom is expected around 10/9. If this was correct, then we should expect more downside volatility before 10/9. Looking below, our Cycle Forecast for the SPY (included in our 3Q2024 Cycle Forecast package) pointed to a countertrend move from 9/6 to 9/13 and that did occur. The cycle forecasts point to more downside action into the end of September. This is where Cycles point to continued volatility, despite the new technical uptrend.
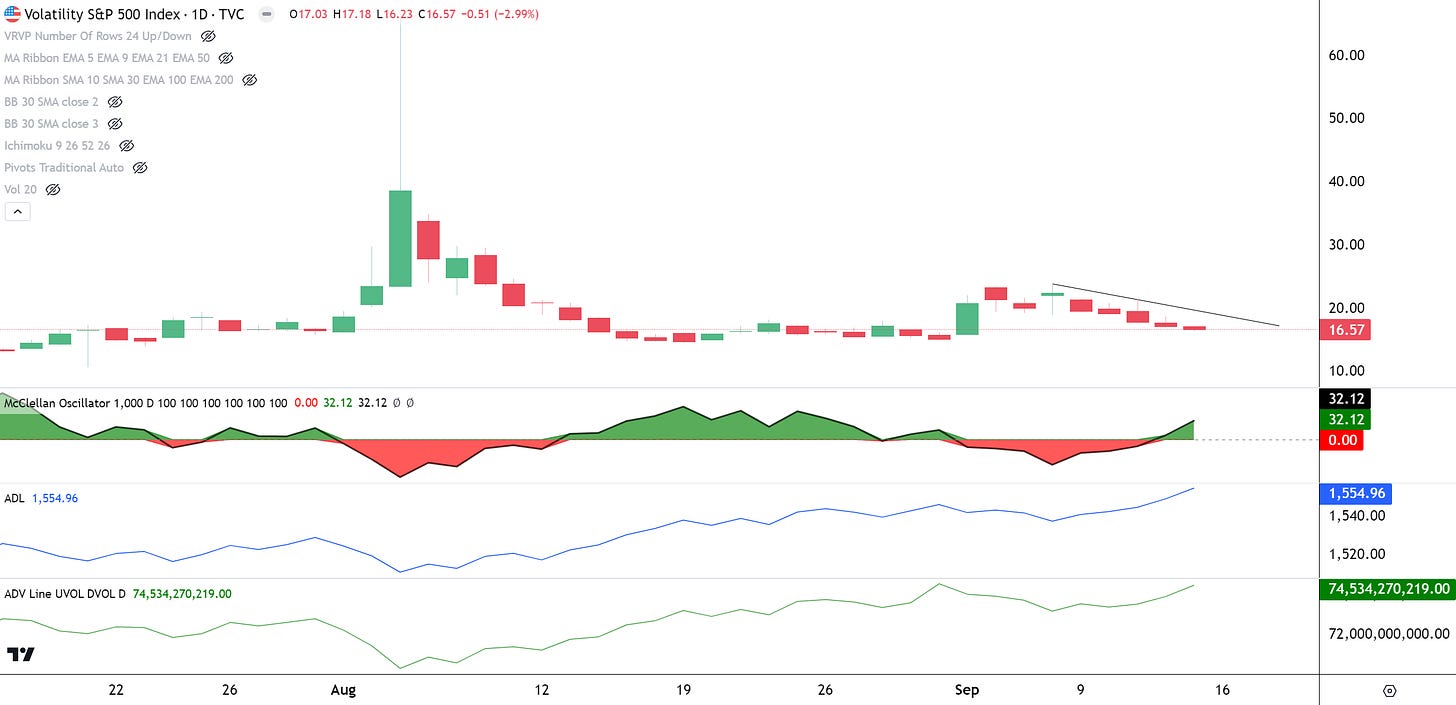
As for Market Internals, the Volatility index (VIX) is back in a downtrend, pointing to higher stock prices for the near future. Breadth recovered, as the McClellan Breadth Oscillator is in an uptrend and back above the 0 mark. The Advance Decline Line is also in an uptrend making new highs. All of this is quite bullish. However the Advance Decline Volume Line, while pointing higher, failed to make new highs for now. This is the one Market Internal that is a bit puzzling, saying that this rally so far is low volume, increasing the odds of a sudden reversal.
Options positioning looking at the Equity Put/Call Ratio’s (CPCS) 5 SMA tells us that the recent rush to buy Put Options from 8/21 to 9/9 reversed. From 9/9, Put Options are being washed out and the market is buying Call Options betting on a new uptrend. This is already close to the bullish extreme area (red line), and if this extreme is touched, another reversal bearish reversal could occur for the market. Perhaps this may coincide with a possible “Sell the News” event on Wednesday 9/18 with the FOMC cutting rates for the first time in years.
Next week the FOMC rate decision on Wednesday is the big event. Other than that the Economic Calendar is pretty light. There are Retail Sales on Tuesday and the Philly Fed Manufacturing Index on Thursday. Weak numbers could reignite recession fears, while strong numbers should be supportive of continued upside for the stock market.
Conclusion
The Technicals and Market Internals point to a retest of the highs or new highs for the S&P 500. Cycles continue to warn of more downside volatility. Short term traders should play the bounce into Wednesday, but protect profits then. If the uptrend continues after the FOMC, then the market could trend higher for some time. If the market sells off after the FOMC then it could get ugly, especially since the latter half of September is more bearish according to Seasonality.
In the Premium Section we’ll go over setups for NVIDIA (NVDA), Costco (COST) and Microsoft (MSFT).
Disclaimer - All materials, information, and ideas from Cycles Edge are for educational purposes only and should not be considered Financial Advice. This blog may document actions done by the owners/writers of this blog, thus it should be assumed that positions are likely taken. If this is an issue, please discontinue reading. Cycles Edge takes no responsibility for possible losses, as markets can be volatile and unpredictable, leading to constantly changing opinions or forecasts.


