


The 5 Best Trading Techniques of 2025
Premium Section: The 18 Year Economic Cycle or "McWhirter" Cycle

Last week, February Options expiration brought out the bears, who pushed the S&P 500 (SPY) down near the Max Pain level as we discussed here. You can see from the Max Pain chart below that the $610 Call Wall provided resistance, while the market dropped slightly past the Max Pain level at $601.

So what now? Will the market bounce or continue lower? In this article we’ll use the techniques that work best in this challenging year.
Technique #1: Bollinger Bands & Slow Stochastics
Bollinger Bands with the standard settings (2 Standard Deviations of the 20 Simple Moving Average Midline) have been the best indicator this year to guide trades on the daily chart. You can see from the chart below that the Bollinger Bands have been calling bottoms, tops and Midline continuations. Bottoms were formed on the Lower Bollinger Bands on 12/20/24, 1/2/25 and 1/13/25. Tops occurred on the Upper Bollinger Bands on 1/23/25 and 2/19/25. Continuation bounces occurred on the Bollinger Band Midline (20 SMA) on 2/3/25 and 2/12/25. Pretty good for one indicator.
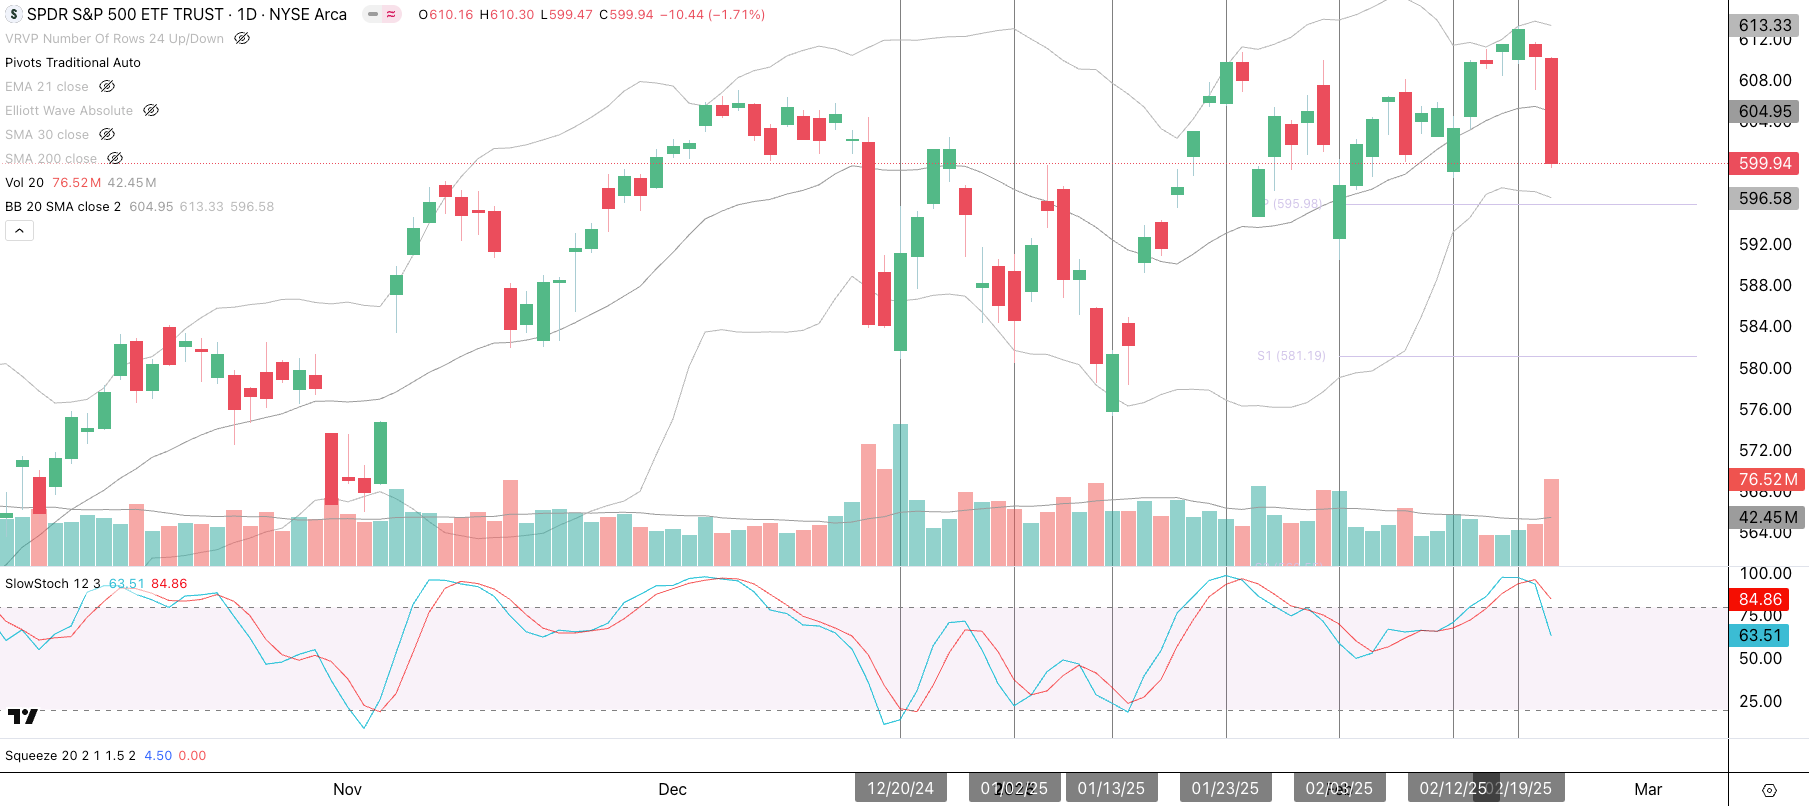
The Slow Stochastics have been the best oscillator indicator this year. Profitable trades could have been done on crossovers this year. Notice that the bearish crossover that occurred on 2/19/25 was a good early warning before the February OPEX drop that happened on Friday.
In conclusion, the Bollinger Bands and Slow Stochastics combo have been the best tools to swing trade this market.What comes next could be a bounce on the Lower Bollinger Band at $596, which has confluence with the Pivot Point. We’ll have to see if support holds there. If price is able to push the Lower Bollinger Band down, continued downside is possible.
Technique #2: Stage Analysis
Stan Weinstein’s Stage Analysis has also been quite accurate in 2025. For those unfamiliar, you can read about it here. It basically uses the 30-period SMA and price action to determine the stage of a investment’s advance:

The default timeframe that Stan Weinstein used was the weekly chart. Using the 30 SMA with Stage Analysis on the weekly chart can really lead to large moves. Below is a weekly chart of the SPY with only the 30 SMA and Slow Stochastics. Notice that very lucrative trades were signaled when price crossed above and stayed above the 30 SMA. Also, bullish Stochastic crossovers gave confirmation. Recently the 8/5/24 and 1/13/25 bottoms were 30 SMA bounces. The 30 SMA on the Weekly chart could be one of the best indicators for position traders or investors.

I did notice that this technique can be used on the 30 minute timeframe for short-term trades. Again, notice how a combination of the 30 SMA and the Slow Stochastics produced numerous profitable trades since the December 2024 FOMC meeting, where volatility started. The 30 SMA and Slow Stochastics can be used effectively for short-term trades. What comes next is probably a bounce to the 30 SMA, given the Slow Stochastics bullish crossover that occurred in the oversold zone.

Technique #3: Elliott Wave
Although Elliott Wave is subjective, I find it to be quite useful in guiding trades, especially on the mid timeframes. Below is a chart of the SPY on a 1-hour Timeframe. Notice that we just witnessed a complete Elliott Wave in February. The Wave 1 Impulse Wave started at the beginning of the month. Wave 2 was a Flat Correction. Wave 3 was another Impulse Wave. Wave 4 was a shallow Flat Correction. Wave 5 was a smaller Impulse Wave, which was a new high. After the 2/19/25 high, an ABC ZigZag Correction just occurred. Setting a Fibonacci Extension on Wave 2’s low is a technique called Fibonacci Pinball. Notice that the Wave 5 touched the 0.786 Extension before rolling over. Pretty amazing!

Elliott Wave was also useful on the daily timeframe, however I find the 1-hour timeframe better for managing trades. Using the Fibonacci Pinball technique, we can see that the 2/19 high touched the 1.272 Fibonacci Extension before reversing. Wave 5 is most likely over and it was a “truncated” or shortened Wave 5.

Elliott Wave’s usage of Impulse and Corrective Waves is quite useful for managing trades. What comes next is one of the two:
Most Likely Scenario: Given Friday’s impulsive candle to the downside, an ABC correction may be starting on the daily chart.
Worst Case Scenario: SPY could form a Wave 1 of a 5 Wave Impulse Wave to the downside.
Best Case Scenario: If the SPY can reverse Friday’s technical damage and make new highs, Wave 5 can extend.
Technique #4: Volume Analysis
The Anchored Volume-Weighted Average Price (AVWAP) is a volume-based moving average that allows volume to take the lead. The key to using AVWAPs effectively is selecting the right anchor point. Tops, bottoms, and key events are the most effective places to anchor AVWAPs.
Analyzing the chart below we can see that price dropped to an AVWAP support confluence zone between $599 to $597. If this area breaks, the next support level comes from the 9/11/24 AVWAP (purple) at $588. If that breaks then the next support is at the 8/5/24 AVWAP (red) at $578. Notice how the AVWAP levels have Volume Profile high volume nodes. This increases our confidence that these are strong supports.

On the bearish side is the appearance on a selling volume spike on Friday and the decline in the Money Flow Index, which is a volume-based RSI indicator. A key buy signal is if price can break above the 2/19/25 AVWAP (black), however that has not happened yet. Volume analysis tells us to patiently observe and wait for buyers to come back in at a support level. MFI turning higher would be a good confirmation.
Technique #5: The Cycles SMA System & Cycle Brackets
The Cycles SMA System has a few components:
The Dynamic Cycle SMA: An SMA set to half the length of a cycle is a good representation of that cycle on the daily chart. The Primary Cycle bracket (large cycle bracket below) has 72 trading days, thus a 36 SMA (blue) is representative of the 72 bar Primary Cycle.
The Dynamic CCI Indicator: The Commodity Channel Index (CCI) indicator is one of the best pure oscillators. Setting the CCI to the length of the Dynamic Cycle SMA (in this case 36 days) ties it to the cycle.
Static SMAs: SMAs set to various cycle lengths (not currently shown) are useful in catching pullbacks. For example the 4-Year Cycle corresponds to the 460 SMA. If price falls to and bounces off the 460 SMA, you know that the decline was of 4-Year Cycle magnitude. Since we are only focusing on the Dynamic Cycle SMA I did not show these Static SMAs.
Cycle Brackets: The key to cycle brackets is to find the Primary Cycle, and to do this you can set a cycle bracket from one significant low to another. The SPY has a Primary Cycles or 72 bars and Primary Cycles tend to subdivide by 2 or 3. In this case the SPY’s Primary Cycle appears to subdivide into 3 Trading Cycles (smaller cycle bracket).
Let’s analyze the SPY now:

This system indicated that turbulence would likely begin around 2/14/25 as the cycles began to age. Entering a cycle renewal phase typically attracts sellers, so the turbulence period could last from 2/14/25 to 3/4/25. However, if the new cycle turns out to be bearish, the downside could extend further.
Notice how the price touched the 36 SMA on Friday. We expect the price to break below the 36 SMA as the cycle bracket renews. This outlook is supported by the CCI, which has broken below its moving average (gray) after leaving the overbought zone. This suggests more downside until the CCI turns up again, ideally from the oversold zone. A new primary cycle uptrend will be confirmed once the price reclaims the 36 SMA.
In the Premium Section we’ll go over the 18-Year Economic Cycle for 2025.
Disclaimer - All materials, information, and ideas from Cycles Edge are for educational purposes only and should not be considered Financial Advice. This blog may document actions done by the owners/writers of this blog, thus it should be assumed that positions are likely taken. If this is an issue, please discontinue reading. Cycles Edge takes no responsibility for possible losses, as markets can be volatile and unpredictable, leading to constantly changing opinions or forecasts. All sales are final.