The Autumn Fall
Premium Section: Downside Price Targets for SPY, QQQ, DIA & IWM
Summer trading is over and we warned our subscribers last week that the complexion of the market could change quickly after Labor Day. It seems like Wall Street got back to work from partying in the Hamptons and took profit. And why wouldn’t they? The S&P 500 (SPY) was stuck at resistance for 2 weeks, while the market is overvalued and retail traders piled money into call options expecting the market to break to new highs.
When retail loads up on options, the opposite usually happens as market makers do not want to pay profits to retail as we discussed here. The chart of the Equity Put/Call Ratio (CPCS) and the SPY show the SPY falling as call options get washed out. The CPCS is not yet at the bearish extreme (green line - when retail owns many put options) so there should be more downside. When the market is heavy with put options over the next few days/weeks, we can expect a meaningful bounce.
Recession fears are back on the menu and with slowing job growth, investors do have a legitimate reason to worry. On top of that, the Yield Curve just un-inverted and is starting to re-steepen. This is one of the most accurate recession and bear market indicators telling us the possibility of a recession and a large drop over the next few years should be in focus. Notice in the chart below that the 2000 bear market occurred as the Yield Curve broke above 0. In the 2007 Global Financial Crisis the bear market began as the Yield Curve un-inverted and hit 0.6%. The Yield Curve is currently at 0.06% but it’s trajectory appears pretty steep. No wonder Wall Street sold out!
It seems like we got our End of Summer Bull BBQ after all as the Autumn Fall is in motion. We hope we saved our subscribers a lot of pain as our cycles have been tipping us off to a nasty correction for some time now. Let’s go over Market Conditions, Seasonality and in the Premium Section this week we’ll go over our downside targets for the S&P 500 (SPY), Nasdaq 100 (QQQ), Russell 2000 (IWM) and Dow Jones Industrial Average (DIA).
Market Conditions: What Happened to the Hoopla?
It seems like yesterday that everyone on CNBC was playing the role of “Hype Man” harping strong breadth and the resurgence of Small Cap stocks. Well, you could see from the chart below that as fast as breadth went up, it also fell.
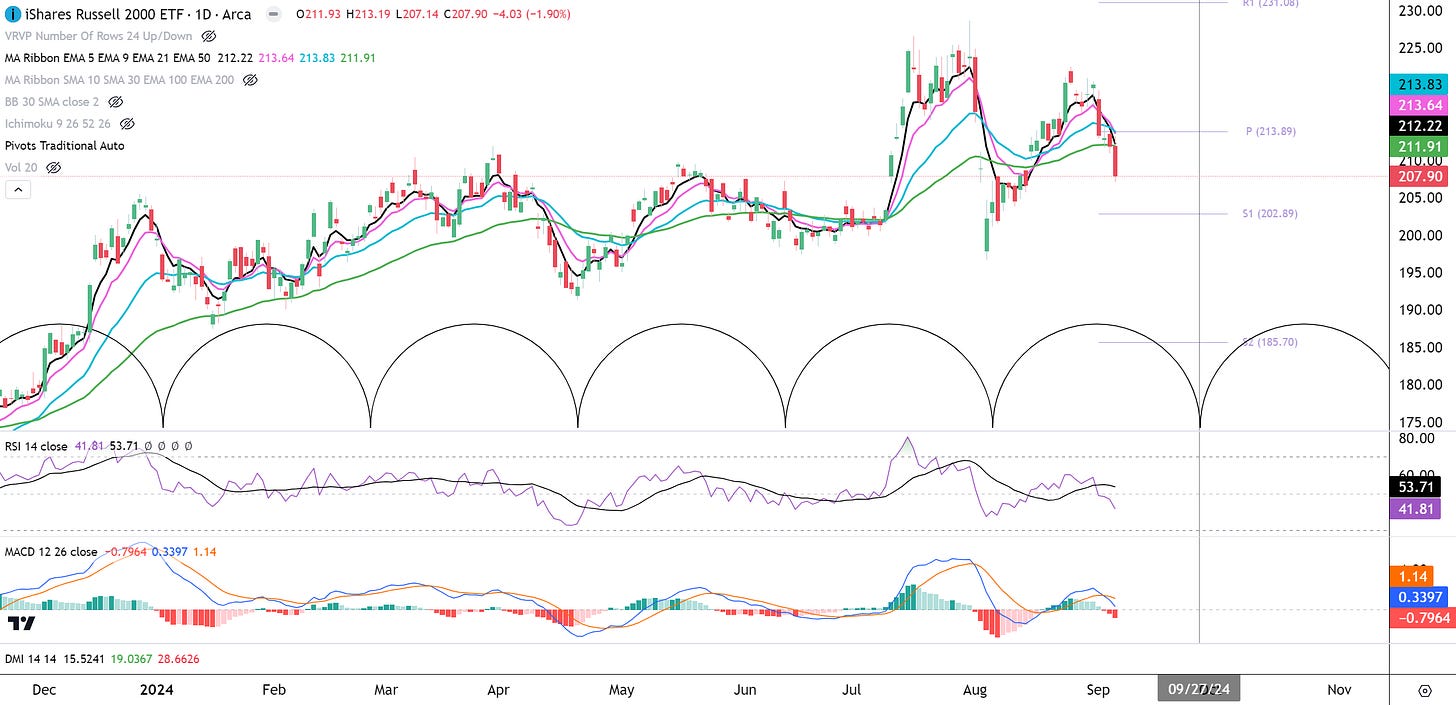
Similarly, the Russell 2000 (IWM), which is the most followed index for Small Cap stocks, made a lower high and then dropped right after Labor Day (down 5.53% for the week). With RSI in a downtrend but not yet at oversold levels and MACD making a bearish crossover, IWM will probably continue trending lower under the 9 EMA. IWM’s cycle bracket renews on 9/27 so perhaps a change of complexion could occur around then. It is also possible that the new cycle beginning on that date could be a negative cycle. We should make a mental note that doing the opposite of what the financial media says is often lucrative.
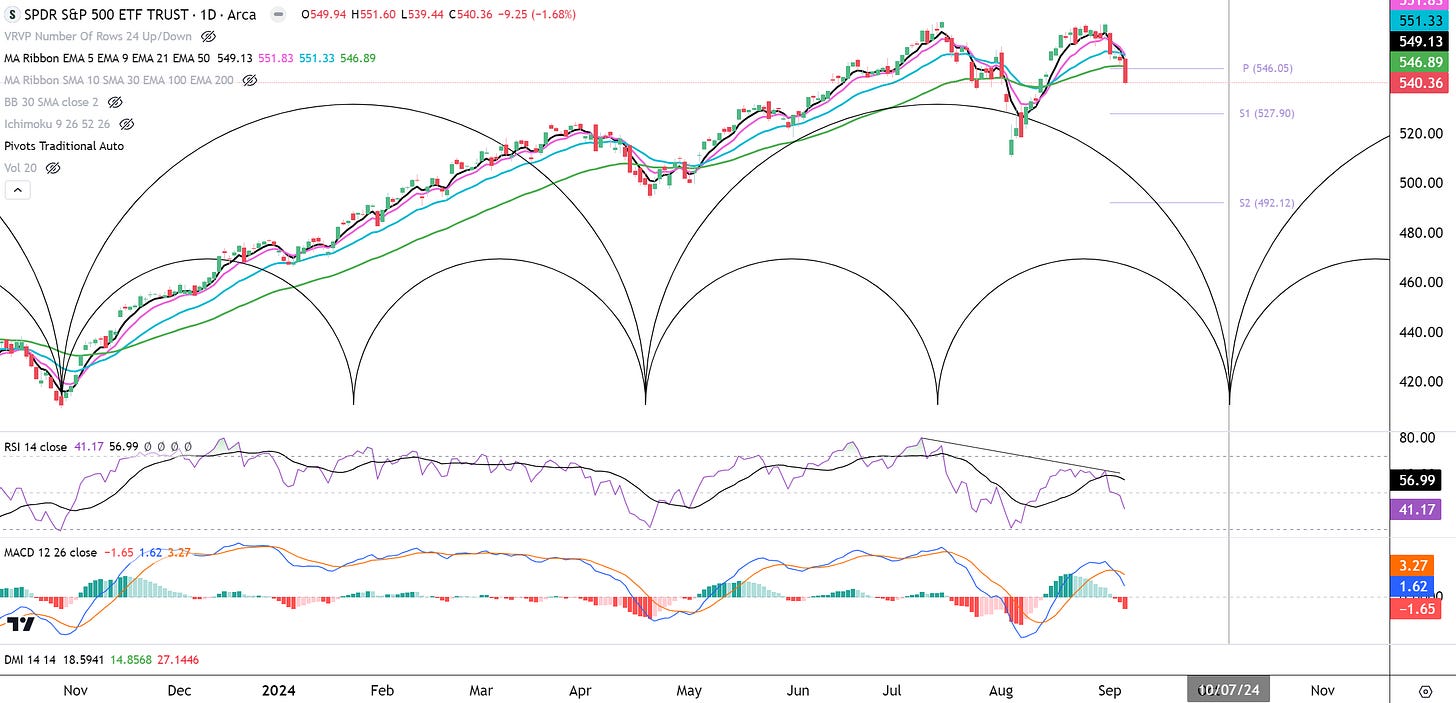
The SPY made a double top pattern and rolled over after Labor Day. It is down 4.14% for the week. It is below the 9 & 21 EMAs so it is in a bona fide downtrend. RSI is in a downtrend (not yet oversold) while the MACD made a bearish crossover, putting the odds in favor of more downside. The cycle bracket renews on 10/7 so the downside volatility could last for some time.
Meanwhile, the VIX is back in an uptrend above all moving averages. With RSI just turning above 50 and MACD just turning positive, we can expect the VIX uptrend to last for at least a few weeks.
Smart Money sold into the August highs while Dumb Money was hoping for new highs. They ended up selling into weakness and still have a lot of positions to sell.
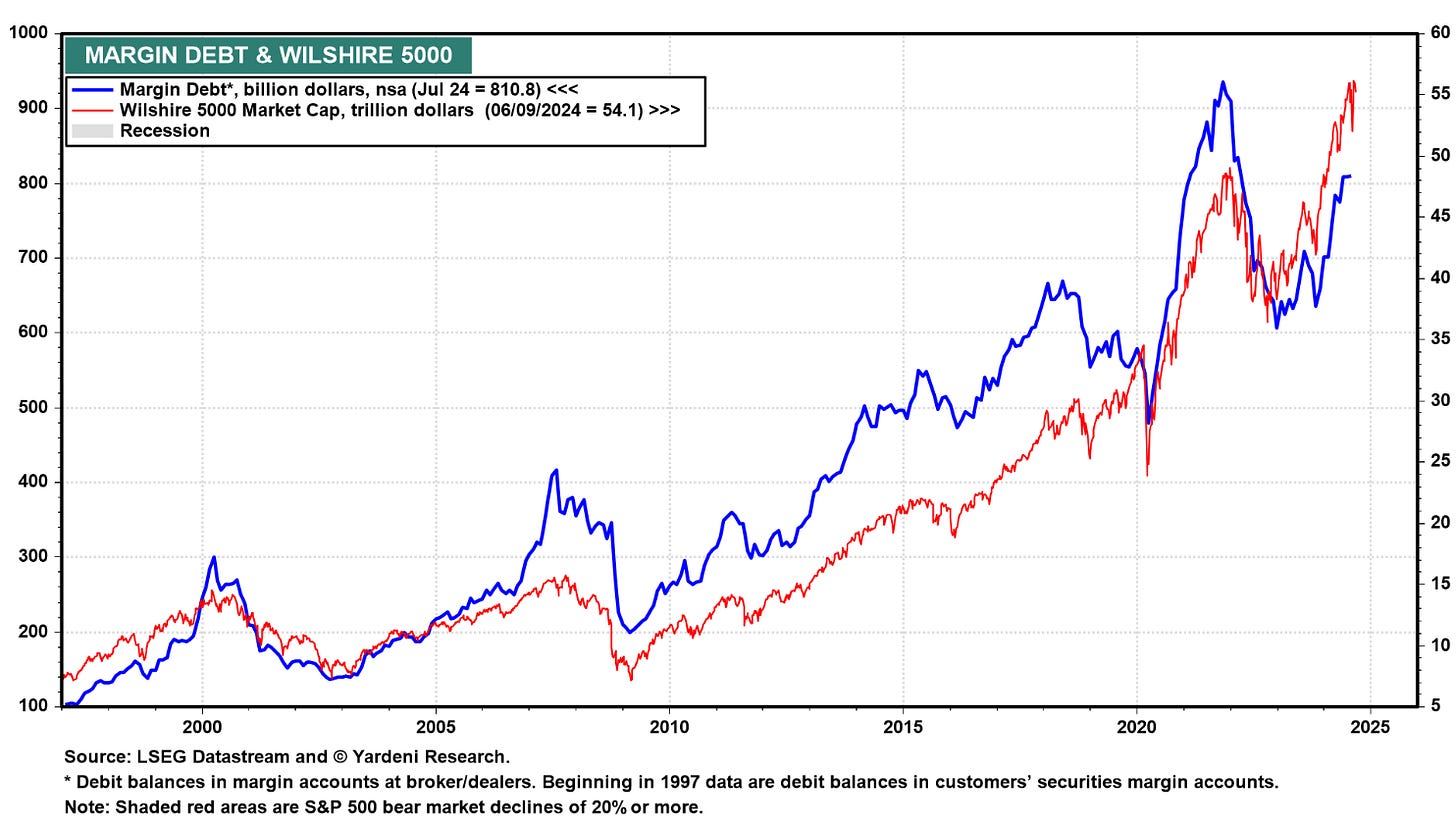
If Dumb Money selling coincides with the liquidation of margin debt (blue line below), a waterfall sell-off could occur. Margin debt (people borrowing money to invest) has been increasing since 2023. While it's not at an all-time high, it remains at elevated levels.
The Fear and Greed Model shows that greed hit an extreme and it reversed into fear pretty quickly. We are not yet at extreme fear, so this correction could last a while.
Seasonality: Autumn Seasonality
Autumn trading is driven by Wall Street behavior. Here is a key timeline:
After Labor Day: Wall Street gets back from vacation and gets back to business as funds focus on re-balancing their portfolios. At funds, analysts review their portfolios, make recommendations to the investment committee and if their ideas are accepted then trades are made. This process usually occurs in the first few weeks of September.
Stock Buyback Blackout: Most publicly traded companies have a blackout policy that restricts trading their own shares starting two weeks before the end of the quarter and lasting until a day or two after earnings are released. This means that corporate buyback liquidity can dry up around September 15th. With less liquidity, the second half of September could have more downside volatility.
Tax Loss Harvesting: Mutual Funds must report their tax losses by the October 31st deadline. That means that Mutual Funds will be incentivized sell their losers before said date. Retail investors have until December 31st to harvest their tax losses. In the Autumn, it is not a good idea to bottom-fish beaten down stocks, as they could go lower.
Year-End Window Dressing: Funds will want to own attractive leading stocks in their portfolio before December 31st, when they create marketing material for the next year. This creates buying pressure for winning stocks or stocks with great future prospects in the November to December period.
The key is to protect capital during the periods of incentivized selling (September to October), and profit from the leading groups during times of incentivized buying (November to December).
On another note, here is a Seasonality chart from Stock Traders Almanac. We are in an “Open Election Year” so the volatility this Autumn could be greater than usual. It also coincides with a 4-Year Cycle decline and trough that is expected by November 2024.
Also courtesy of Stock Traders Almanac is the September seasonal chart below. So far it has been very accurate with selling pressure in the first few days of September. According to this chart, a short term bottom is possible around 9/10. More downside pressure is possible between 9/13 to 9/18. Then more downside tends to occur after 9/20. This year the FOMC meeting is on 9/18 so be ready for volatility then. I expect a sell the news event sending the market lower around 9/18, however the market could easily send the market higher to trick people before pulling the rug.
This week the most important economic data releases will be Consumer Price Index (CPI) on Wednesday, Producer Price Index (PPI) and Initial Jobless Claims on Thursday. Expect volatility on these days.
Conclusion: We are in the Autumn Selling Season right now and although relief rallies are possible, a change of trend is more likely in November after a new US President is elected. It’s time to protect capital and adept traders can short the market at short-term resistance levels. In the Premium Section we’ll look at downside targets for the SPY, QQQ, DIA and IWM. You won’t want to miss this chance to make generational gains!
Disclaimer - All materials, information, and ideas from Cycles Edge are for educational purposes only and should not be considered Financial Advice. This blog may document actions done by the owners/writers of this blog, thus it should be assumed that positions are likely taken. If this is an issue, please discontinue reading. Cycles Edge takes no responsibility for possible losses, as markets can be volatile and unpredictable, leading to constantly changing opinions or forecasts.


